Estimated redshift from machine learning (Ukwatta et al. 2016) - may take a few minute to calcaulte
Image
Pre-slew 15.0-350.0 keV image (Event data)

#   RAcent    DECcent   POSerr    Theta     Phi              Peak Cts       SNR   Name
   96.8668   -20.0413   0.0156     4.6735   -40.1182         1.2491770     12.276 TRIG_01205899

Foreground time interval of the image:
  7.832  72.701 (delta_t =  64.869 [sec])
Background time interval of the image:
-239.000   7.832 (delta_t = 246.832 [sec])
Lightcurves
Notes:
- 1) The mask-weighted light curves are using the flight position.
- 2) Multiple plots of different time binning/intervals are shown to cover all scenarios of short/long GRBs, rate/image triggers, and real/false positives.
- 3) For all the mask-weighted lightcurves, the y-axis units are counts/sec/det where a det is 0.4 x 0.4 = 0.16 sq cm.
- 4) The verticle lines correspond to following: green dotted lines are T50 interval, black dotted lines are T90 interval, blue solid line(s) is a spacecraft slew start time, and orange solid line(s) is a spacecraft slew end time.
- 5) Time of each bin is in the middle of the bin.
1 s binning
From T0-310 s to T0+310 s

From T100_start - 20 s to T100_end + 30 s
Full time interval

64 ms binning
Full time interval
From T100_start to T100_end
From T0-5 sec to T0+5 sec

16 ms binning
From T100_start-5 s to T100_start+5 s
8 ms binning
From T100_start-3 s to T100_start+3 s

2 ms binning
From T100_start-1 s to T100_start+1 s
SN=5 or 10 sec. binning (whichever binning is satisfied first)
SN=5 or 10 sec. binning (T < 200 sec)
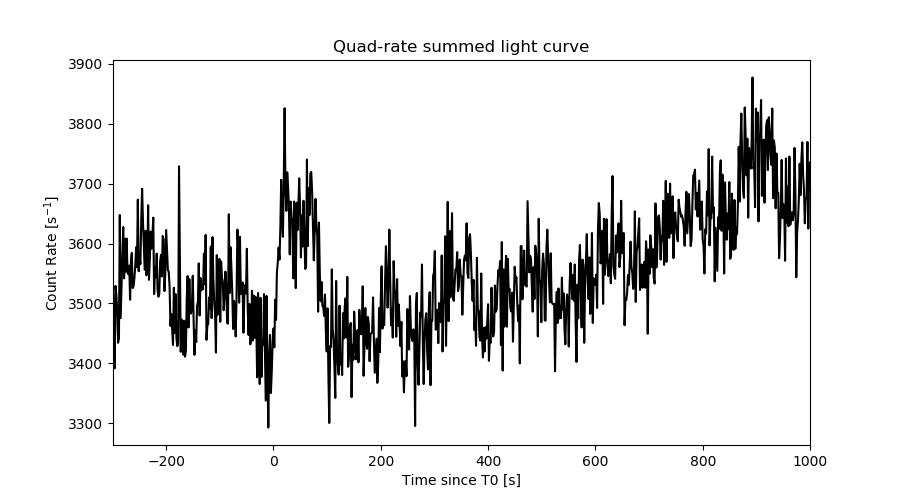
Quad-rate summed light curves (from T0-300s to T0+1000s)
Spectral Evolution

Spectra
Notes:
- 1) The fitting includes the systematic errors.
- 2) When the burst includes telescope slew time periods, the fitting uses an average response file made from multiple 5-s response files through out the slew time plus single time preiod for the non-slew times, and weighted by the total counts in the corresponding time period using addrmf. An average response file is needed becuase a spectral fit using the pre-slew DRM will introduce some errors in both a spectral shape and a normalization if the PHA file contains a lot of the slew/post-slew time interval.
- 3) For fits to more complicated models (e.g. a power-law over a cutoff power-law), the BAT team has decided to require a chi-square improvement of more than 6 for each extra dof.
Time averaged spectrum fit using the average DRM
Power-law model

Time interval is from    7.832 sec. to  133.496 sec.

Spectral model in power-law:
------------------------------------------------------------
Parameters  : value       lower 90%   higher 90%
Photon index: 1.98196     ( -0.217865   0.233332 )
Norm@50keV  : 7.02250E-04    ( -0.000112606   0.000109951 )
------------------------------------------------------------
#Fit statistic  : Chi-Squared                   62.10     using 59 bins.
 Reduced chi-squared = 1.08947
# Null hypothesis probability of 3.00e-01 with 57 degrees of freedom

Photon flux (15-150 keV)    in 125.7 sec: 0.104481 ( -0.0127102  0.012709 ) ph/cm2/s
Energy fluence (15-150 keV)             : 8.13478e-07 ( -1.21941e-07  1.25349e-07 ) ergs/cm2
Cutoff power-law model
Time interval is from    7.832 sec. to  133.496 sec.
Spectral model in the cutoff power-law:
------------------------------------------------------------
Parameters  : value       lower 90%   higher 90%
Photon index: 0.881953     ( -1.23367   1.00584 )
Epeak [keV] : 40.7607      ( -16.8275 25.9351 )
Norm@50keV  : 3.14996E-03    ( -0.00314993   0.0138778 )
------------------------------------------------------------
#Fit statistic  : Chi-Squared                   58.66     using 59 bins.
 Reduced chi-squared = 1.0475
# Null hypothesis probability of 3.78e-01 with 56 degrees of freedom

Photon flux (15-150 keV)    in 125.7 sec: 0.101048 ( -0.0129115  0.012997 ) ph/cm2/s
Energy fluence (15-150 keV)             : 7.30861e-07 ( -1.22383e-07  1.39672e-07 ) ergs/cm2
Band function

Time interval is from    7.832 sec. to  133.496 sec.


Spectral model in the Band function:
------------------------------------------------------------
Parameters  : value       lower 90%   higher 90%
alpha       :    (     )
beta        :     (     )
Epeak [keV] :       (   )
Norm@50keV   :     (     )
------------------------------------------------------------

Photon flux (15-150 keV)    in  sec:  (    ) ph/cm2/s
Energy fluence (15-150 keV)             : 0 ( 0  0 ) ergs/cm2
Single BB

Spectral model blackbody:
------------------------------------------------------------
Parameters  : value    Lower 90%  Upper 90%
kT [keV]    : 10.0155  (-1.33465  1.51543)
R^2/D10^2   : 4.97372E-02  (-0.0206514   0.035868)
(R is the radius in km and D10 is the distance to the source in units of 10 kpc)
------------------------------------------------------------
#Fit statistic  : Chi-Squared                   67.44     using 59 bins.
 Reduced chi-squared =
# Null hypothesis probability of 1.62e-01 with 57 degrees of freedom

Energy  Fluence     90% Error
[keV]   [erg/cm2]   [erg/cm2]
15- 25  1.278e-07   2.521e-08
25- 50  3.184e-07   5.204e-08
50-150  1.669e-07   5.181e-08
15-150  6.132e-07   1.076e-07
Thermal bremsstrahlung (OTTB)
Spectral model: thermal bremsstrahlung
------------------------------------------------------------
Parameters  : value         Lower 90%    Upper 90%
kT [keV]    : 63.9657       (-19.3664      34.1058)
Norm        : 0.537441       (-0.0964982     0.116469)
------------------------------------------------------------
#Fit statistic  : Chi-Squared                   59.11     using 59 bins.
 Reduced chi-squared =
# Null hypothesis probability of 3.98e-01 with 57 degrees of freedom

Energy  Fluence     90% Error
[keV]   [erg/cm2]   [erg/cm2]
15- 25  1.714e-07   2.809e-08
25- 50  2.659e-07   3.878e-08
50-150  3.187e-07   1.094e-07
15-150  7.561e-07   1.448e-07
Double BB

Spectral model: bbodyrad<1> + bbodyrad<2>
------------------------------------------------------------
Parameters  : value         Lower 90%    Upper 90%
kT1 [keV]   : 4.70831        (-2.0651      2.49858)
R1^2/D10^2  : 0.473258        (-0.361366      6.00119)
kT2 [keV]   : 14.0996        (-3.16075      6.54859)
R2^2/D10^2  : 1.04671E-02    (-0.00862896   0.0209053)
------------------------------------------------------------
#Fit statistic  : Chi-Squared                   57.85     using 59 bins.
 Reduced chi-squared =
# Null hypothesis probability of 3.70e-01 with 55 degrees of freedom

Energy  Fluence     90% Error
[keV]   [erg/cm2]   [erg/cm2]
15- 25  1.682e-07   9.088e-08
25- 50  2.703e-07   1.390e-07
50-150  2.736e-07   1.618e-07
15-150  7.121e-07   3.725e-07
Peak spectrum fit
Power-law model

Time interval is from   65.004 sec. to   66.004 sec.

Spectral model in power-law:
------------------------------------------------------------
Parameters  : value       lower 90%   higher 90%
Photon index: 1.80496     ( -0.7206   0.83637 )
Norm@50keV  : 2.69233E-03    ( -0.00128861   0.00115014 )
------------------------------------------------------------
#Fit statistic  : Chi-Squared                   51.94     using 59 bins.
 Reduced chi-squared = 0.911228
# Null hypothesis probability of 6.65e-01 with 57 degrees of freedom

Photon flux (15-150 keV)    in 1 sec: 0.371733 ( -0.136076  0.136146 ) ph/cm2/s
Energy fluence (15-150 keV)             : 2.47851e-08 ( -1.09067e-08  1.16131e-08 ) ergs/cm2
Cutoff power-law model

Time interval is from   65.004 sec. to   66.004 sec.
Spectral model in the cutoff power-law:
------------------------------------------------------------
Parameters  : value       lower 90%   higher 90%
Photon index: 2.16325     ( -2.26183   4.51821 )
Epeak [keV] : 64.2172      ( -9999.26 -9999.27 )
Norm@50keV  : 1.71110E-03    ( -0.00170807   0.0426816 )
------------------------------------------------------------
#Fit statistic  : Chi-Squared                   51.73     using 59 bins.
 Reduced chi-squared = 0.92375
# Null hypothesis probability of 6.37e-01 with 56 degrees of freedom

Photon flux (15-150 keV)    in 1 sec: 0.372475 ( -0.137222  0.135788 ) ph/cm2/s
Energy fluence (15-150 keV)             : 1.95839e-08 ( -1.33234e-08  1.1582e-08 ) ergs/cm2
Band function

Time interval is from   65.004 sec. to   66.004 sec.


Spectral model in the Band function:
------------------------------------------------------------
Parameters  : value       lower 90%   higher 90%
alpha       :    (     )
beta        :     (     )
Epeak [keV] :       (   )
Norm@50keV   :     (     )
------------------------------------------------------------

Photon flux (15-150 keV)    in  sec:  (    ) ph/cm2/s
Energy fluence (15-150 keV)             : 0 ( 0  0 ) ergs/cm2
Single BB
Spectral model blackbody:
------------------------------------------------------------
Parameters  : value    Lower 90%  Upper 90%
kT [keV]    : 10.3615  (-5.15324  13.5975)
R^2/D10^2   : 0.143441  (-0.136654   1.80242)
(R is the radius in km and D10 is the distance to the source in units of 10 kpc)
------------------------------------------------------------
#Fit statistic  : Chi-Squared                   55.98     using 59 bins.
 Reduced chi-squared =
# Null hypothesis probability of 5.14e-01 with 57 degrees of freedom

Energy  Fluence     90% Error
[keV]   [erg/cm2]   [erg/cm2]
15- 25  3.171e-09   2.045e-09
25- 50  8.284e-09   5.230e-09
50-150  4.787e-09   3.698e-09
15-150  1.624e-08   1.086e-08
Thermal bremsstrahlung (OTTB)
Spectral model: thermal bremsstrahlung
------------------------------------------------------------
Parameters  : value         Lower 90%    Upper 90%
kT [keV]    : 99.9478       (-99.9975      -99.9975)
Norm        : 1.62965       (-0.689104     1.45398)
------------------------------------------------------------
#Fit statistic  : Chi-Squared                   52.39     using 59 bins.
 Reduced chi-squared =
# Null hypothesis probability of 6.48e-01 with 57 degrees of freedom

Energy  Fluence     90% Error
[keV]   [erg/cm2]   [erg/cm2]
15- 25  4.260e-09   2.748e-09
25- 50  7.365e-09   4.649e-09
50-150  1.193e-08   9.860e-09
15-150  2.356e-08   1.697e-08
Double BB
Spectral model: bbodyrad<1> + bbodyrad<2>
------------------------------------------------------------
Parameters  : value         Lower 90%    Upper 90%
kT1 [keV]   : 4.34028        (-2.48546      6.42304)
R1^2/D10^2  : 3.44542        (-3.32982      372.218)
kT2 [keV]   : 24.5117        (-14.1925      -24.533)
R2^2/D10^2  : 5.70253E-03    (-0.00559648   0.120224)
------------------------------------------------------------
#Fit statistic  : Chi-Squared                   51.61     using 59 bins.
 Reduced chi-squared =
# Null hypothesis probability of 6.05e-01 with 55 degrees of freedom

Energy  Fluence     90% Error
[keV]   [erg/cm2]   [erg/cm2]
15- 25  5.192e-09   3.043e-09
25- 50  5.457e-09   2.925e-09
50-150  1.513e-08   1.121e-08
15-150  2.578e-08   1.326e-08
Pre-slew spectrum (Pre-slew PHA with pre-slew DRM)
Power-law model
Spectral model in power-law:
------------------------------------------------------------
Parameters  : value       lower 90%   higher 90%
Photon index: 1.76321     ( -0.193608   0.201165 )
Norm@50keV  : 1.13435E-03    ( -0.000151205   0.000148558 )
------------------------------------------------------------
#Fit statistic  : Chi-Squared                   56.28     using 59 bins.
 Reduced chi-squared =
# Null hypothesis probability of 5.02e-01 with 57 degrees of freedom

Photon flux (15-150 keV)    in 64.87 sec: 0.154137 ( -0.0176194  0.0176232 ) ph/cm2/s
Energy fluence (15-150 keV)             : 6.78521e-07 ( -9.21757e-08  9.40712e-08 ) ergs/cm2
Cutoff power-law model
Spectral model in the cutoff power-law:
------------------------------------------------------------
Parameters  : value       lower 90%   higher 90%
Photon index: 0.764809     ( -1.06876   0.865296 )
Epeak [keV] : 52.5720      ( -11.3758 62.9369 )
Norm@50keV  : 4.22492E-03    ( -0.00422492   0.0130412 )
------------------------------------------------------------
#Fit statistic  : Chi-Squared                   52.32     using 59 bins.
 Reduced chi-squared =
# Null hypothesis probability of 6.15e-01 with 56 degrees of freedom

Photon flux (15-150 keV)    in 64.87 sec: 0.149270 ( -0.018035  0.018082 ) ph/cm2/s
Energy fluence (15-150 keV)             : 6.14725e-07 ( -9.82761e-08  1.06337e-07 ) ergs/cm2
Band function
Spectral model in the Band function:
------------------------------------------------------------
Parameters  : value       lower 90%   higher 90%
alpha       :    (     )
beta        :     (     )
Epeak [keV] :       (   )
Norm@50keV   :     (     )
------------------------------------------------------------

Photon flux (15-150 keV)    in  sec:  (    ) ph/cm2/s
Energy fluence (15-150 keV)             : 0 ( 0  0 ) ergs/cm2
S(25-50 keV) vs. S(50-100 keV) plot

S(25-50 keV)  = 2.44e-07
S(50-100 keV) = 2.46e-07
T90 vs. Hardness ratio plot

T90                                   = 114.304000020027 sec.
Hardness ratio (energy fluence ratio) = 1.0082
Color vs. Color plot
Count Ratio  (25-50 keV) / (15-25 keV) = 1.07924
Count Ratio (50-100 keV) / (15-25 keV) = 0.48154
Mask shadow pattern

IMX = 6.251576326169320E-02, IMY = 5.267702996374011E-02
TIME vs. PHA plot around the trigger time
TIME vs. DetID plot around the trigger time
100 us light curve (15-350 keV)
Spacecraft aspect plot
Bright source in the pre-burst/pre-slew/post-slew images
Pre-burst image of 15-350 keV band
Time interval of the image:
-239.000000 7.832000

# RAcent  DECcent POSerr Theta    Phi  PeakCts   SNR AngSep     Name
#  [deg]    [deg]    ['] [deg]  [deg]                   [']
 83.6501  22.0317    1.7  43.9   49.3   8.7820   6.9    1.4	Crab
135.5086 -40.5354    1.4  36.8 -152.0   3.9398   8.0    1.5	Vela X-1
148.3825   1.1164    2.5  50.1  145.8   8.6057   4.6 ------	UNKNOWN
 79.3905 -14.3963    2.8  21.5   -9.6   1.5818   4.1 ------	UNKNOWN
 98.8866 -29.0207    2.5  11.0  -94.9   1.6449   4.6 ------	UNKNOWN
 41.6138 -15.9787    2.2  57.0  -24.2   9.0041   5.2 ------	UNKNOWN
135.8459 -59.4945    2.9  48.1 -129.3   6.5406   4.0 ------	UNKNOWN
Pre-slew background subtracted image of 15-350 keV band
Time interval of the image:
7.832000 72.700600

# RAcent  DECcent POSerr Theta    Phi  PeakCts   SNR AngSep     Name
#  [deg]    [deg]    ['] [deg]  [deg]                   [']
 83.6122  22.1306    5.4  44.0   49.3  -0.8009  -2.2    7.1	Crab
135.4844 -40.6028    4.5  36.8 -151.9  -0.3447  -2.6    3.5	Vela X-1
 96.8670 -20.0414    0.9   4.7  -40.1   1.2493  12.3 ------	UNKNOWN
 50.8830 -12.4634    2.5  48.9  -17.4   1.1118   4.7 ------	UNKNOWN
 52.0145 -17.3845    2.4  46.9  -23.7   0.9834   4.9 ------	UNKNOWN
Post-slew image of 15-350 keV band
Time interval of the image:
111.100600 963.120000

# RAcent  DECcent POSerr Theta    Phi  PeakCts   SNR AngSep     Name
#  [deg]    [deg]    ['] [deg]  [deg]                   [']
135.5272 -40.5198    1.8  38.8 -147.3  11.5471   6.4    2.1	Vela X-1
 94.0632  11.9191    4.6  32.1   77.0   6.2389   2.5 ------	UNKNOWN
117.1077   1.4607    2.9  29.3  127.3   7.1407   4.0 ------	UNKNOWN
 48.4575 -19.2034    3.2  45.4  -15.5   7.1337   3.6 ------	UNKNOWN
140.2708 -55.6603    3.1  48.1 -129.3  19.5314   3.7 ------	UNKNOWN
Plot creation:
Sat Mar  9 15:17:55 EST 2024