Estimated redshift from machine learning (Ukwatta et al. 2016) - may take a few minute to calcaulte
Image
Pre-slew 15.0-350.0 keV image (Event data)
#   RAcent    DECcent   POSerr    Theta     Phi              Peak Cts       SNR   Name
  199.3003    60.6126   0.0179    31.9520   116.7761         2.0342732     10.723 TRIG_01210276

Foreground time interval of the image:
 -1.872  59.053 (delta_t =  60.925 [sec])
Background time interval of the image:
-239.648  -1.872 (delta_t = 237.776 [sec])
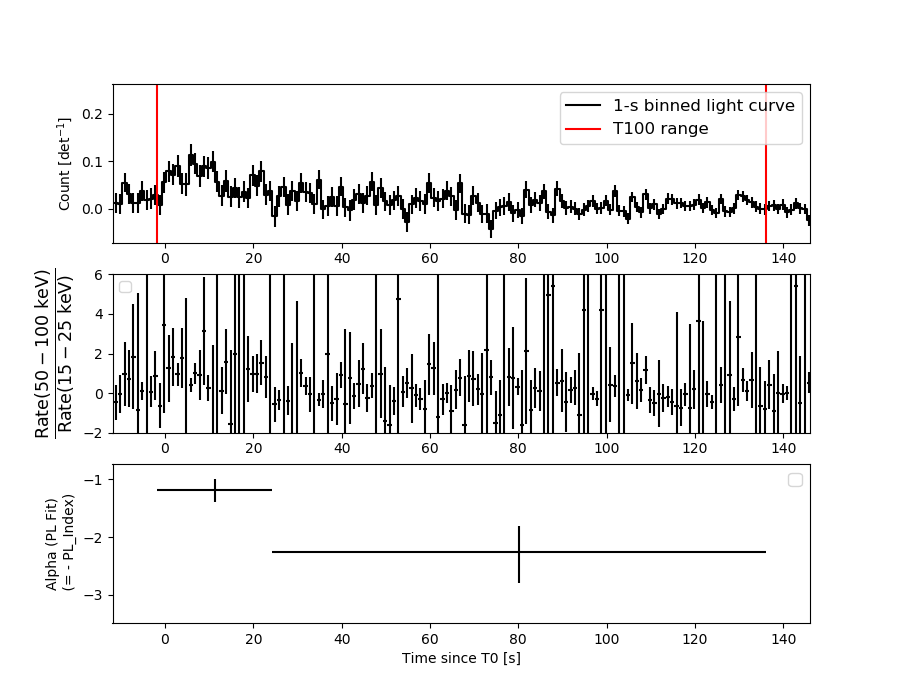
Lightcurves
Notes:
- 1) The mask-weighted light curves are using the flight position.
- 2) Multiple plots of different time binning/intervals are shown to cover all scenarios of short/long GRBs, rate/image triggers, and real/false positives.
- 3) For all the mask-weighted lightcurves, the y-axis units are counts/sec/det where a det is 0.4 x 0.4 = 0.16 sq cm.
- 4) The verticle lines correspond to following: green dotted lines are T50 interval, black dotted lines are T90 interval, blue solid line(s) is a spacecraft slew start time, and orange solid line(s) is a spacecraft slew end time.
- 5) Time of each bin is in the middle of the bin.
1 s binning
From T0-310 s to T0+310 s
From T100_start - 20 s to T100_end + 30 s

Full time interval
64 ms binning
Full time interval
From T100_start to T100_end

From T0-5 sec to T0+5 sec
16 ms binning
From T100_start-5 s to T100_start+5 s

Blue+Cyan dotted lines: Time interval of the scaled map
From 0.000000 to 12.160000
8 ms binning
From T100_start-3 s to T100_start+3 s
Blue+Cyan dotted lines: Time interval of the scaled map
From 0.000000 to 12.160000
2 ms binning
From T100_start-1 s to T100_start+1 s

Blue+Cyan dotted lines: Time interval of the scaled map
From 0.000000 to 12.160000
SN=5 or 10 sec. binning (whichever binning is satisfied first)
SN=5 or 10 sec. binning (T < 200 sec)

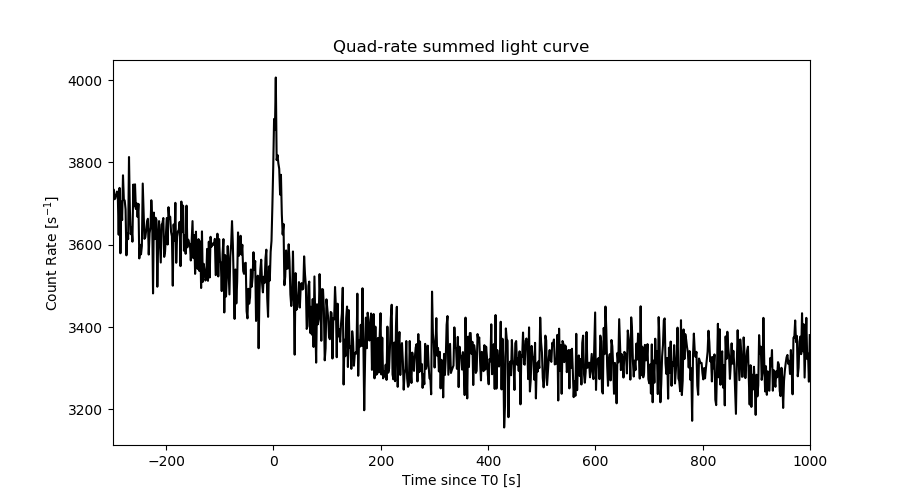
Quad-rate summed light curves (from T0-300s to T0+1000s)
Spectral Evolution
Spectra
Notes:
- 1) The fitting includes the systematic errors.
- 2) When the burst includes telescope slew time periods, the fitting uses an average response file made from multiple 5-s response files through out the slew time plus single time preiod for the non-slew times, and weighted by the total counts in the corresponding time period using addrmf. An average response file is needed becuase a spectral fit using the pre-slew DRM will introduce some errors in both a spectral shape and a normalization if the PHA file contains a lot of the slew/post-slew time interval.
- 3) For fits to more complicated models (e.g. a power-law over a cutoff power-law), the BAT team has decided to require a chi-square improvement of more than 6 for each extra dof.
Time averaged spectrum fit using the average DRM
Power-law model
Time interval is from   -1.872 sec. to  136.064 sec.

Spectral model in power-law:
------------------------------------------------------------
Parameters  : value       lower 90%   higher 90%
Photon index: 1.64213     ( -0.219667   0.225703 )
Norm@50keV  : 1.30195E-03    ( -0.00017574   0.000172912 )
------------------------------------------------------------
#Fit statistic  : Chi-Squared                   55.38     using 59 bins.
 Reduced chi-squared = 0.971579
# Null hypothesis probability of 5.36e-01 with 57 degrees of freedom

Photon flux (15-150 keV)    in 137.9 sec: 0.169570 ( -0.021272  0.021295 ) ph/cm2/s
Energy fluence (15-150 keV)             : 1.67133e-06 ( -2.38637e-07  2.42235e-07 ) ergs/cm2
Cutoff power-law model

Time interval is from   -1.872 sec. to  136.064 sec.
Spectral model in the cutoff power-law:
------------------------------------------------------------
Parameters  : value       lower 90%   higher 90%
Photon index: 1.31019     ( -1.32404   0.543643 )
Epeak [keV] : 96.8698      ( -53.7038 -97.1122 )
Norm@50keV  : 1.96178E-03    ( -0.00195756   0.00801941 )
------------------------------------------------------------
#Fit statistic  : Chi-Squared                   55.10     using 59 bins.
 Reduced chi-squared = 0.983929
# Null hypothesis probability of 5.09e-01 with 56 degrees of freedom

Photon flux (15-150 keV)    in 137.9 sec: 0.167228 ( -0.022905  0.022501 ) ph/cm2/s
Energy fluence (15-150 keV)             : 1.62045e-06 ( -2.91146e-07  2.54176e-07 ) ergs/cm2
Band function

Time interval is from   -1.872 sec. to  136.064 sec.


Spectral model in the Band function:
------------------------------------------------------------
Parameters  : value       lower 90%   higher 90%
alpha       :    (     )
beta        :     (     )
Epeak [keV] :       (   )
Norm@50keV   :     (     )
------------------------------------------------------------

Photon flux (15-150 keV)    in  sec:  (    ) ph/cm2/s
Energy fluence (15-150 keV)             : 0 ( 0  0 ) ergs/cm2
Single BB
Spectral model blackbody:
------------------------------------------------------------
Parameters  : value    Lower 90%  Upper 90%
kT [keV]    : 12.7640  (-1.6383  1.95339)
R^2/D10^2   : 3.37084E-02  (-0.013742   0.0219853)
(R is the radius in km and D10 is the distance to the source in units of 10 kpc)
------------------------------------------------------------
#Fit statistic  : Chi-Squared                   63.78     using 59 bins.
 Reduced chi-squared =
# Null hypothesis probability of 2.50e-01 with 57 degrees of freedom

Energy  Fluence     90% Error
[keV]   [erg/cm2]   [erg/cm2]
15- 25  1.606e-07   3.705e-08
25- 50  5.423e-07   8.832e-08
50-150  5.525e-07   1.666e-07
15-150  1.255e-06   2.156e-07
Thermal bremsstrahlung (OTTB)
Spectral model: thermal bremsstrahlung
------------------------------------------------------------
Parameters  : value         Lower 90%    Upper 90%
kT [keV]    : 157.998       (-70.7257      -156.223)
Norm        : 0.694507       (-0.0926531     0.126539)
------------------------------------------------------------
#Fit statistic  : Chi-Squared                   55.12     using 59 bins.
 Reduced chi-squared =
# Null hypothesis probability of 5.46e-01 with 57 degrees of freedom

Energy  Fluence     90% Error
[keV]   [erg/cm2]   [erg/cm2]
15- 25  2.448e-07   1.315e-07
25- 50  4.572e-07   2.435e-07
50-150  9.216e-07   5.324e-07
15-150  1.624e-06   9.081e-07
Double BB

Spectral model: bbodyrad<1> + bbodyrad<2>
------------------------------------------------------------
Parameters  : value         Lower 90%    Upper 90%
kT1 [keV]   : 2.11425        (-0.985707      2.2588)
R1^2/D10^2  : 52.1528        (-44.2231      142146)
kT2 [keV]   : 14.2066        (-2.10521      2.91757)
R2^2/D10^2  : 2.16081E-02    (-0.010713   0.0146585)
------------------------------------------------------------
#Fit statistic  : Chi-Squared                   54.59     using 59 bins.
 Reduced chi-squared =
# Null hypothesis probability of 4.90e-01 with 55 degrees of freedom

Energy  Fluence     90% Error
[keV]   [erg/cm2]   [erg/cm2]
15- 25  2.274e-07   7.547e-08
25- 50  4.879e-07   1.174e-07
50-150  6.314e-07   1.896e-07
15-150  1.347e-06   2.899e-07
Peak spectrum fit
Power-law model

Time interval is from    2.164 sec. to    3.164 sec.

Spectral model in power-law:
------------------------------------------------------------
Parameters  : value       lower 90%   higher 90%
Photon index: 1.36573     ( -0.579828   0.567077 )
Norm@50keV  : 7.72720E-03    ( -0.00246918   0.00244152 )
------------------------------------------------------------
#Fit statistic  : Chi-Squared                   61.74     using 59 bins.
 Reduced chi-squared = 1.08316
# Null hypothesis probability of 3.11e-01 with 57 degrees of freedom

Photon flux (15-150 keV)    in 1 sec: 0.933985 ( -0.298638  0.299815 ) ph/cm2/s
Energy fluence (15-150 keV)             : 7.5216e-08 ( -2.62201e-08  2.69038e-08 ) ergs/cm2
Cutoff power-law model

Time interval is from    2.164 sec. to    3.164 sec.
Spectral model in the cutoff power-law:
------------------------------------------------------------
Parameters  : value       lower 90%   higher 90%
Photon index: 1.36267     ( -2.4719   -1.31628 )
Epeak [keV] : 9999.19      ( -9999.21 -9999.21 )
Norm@50keV  : 7.75668E-03    ( -0.00775668   0.174417 )
------------------------------------------------------------
#Fit statistic  : Chi-Squared                   61.74     using 59 bins.
 Reduced chi-squared = 1.1025
# Null hypothesis probability of 2.78e-01 with 56 degrees of freedom

Photon flux (15-150 keV)    in 1 sec: 0.935580 ( -0.302468  0.29965 ) ph/cm2/s
Energy fluence (15-150 keV)             : 7.54362e-08 ( -2.94444e-08  2.26369e-08 ) ergs/cm2
Band function

Time interval is from    2.164 sec. to    3.164 sec.


Spectral model in the Band function:
------------------------------------------------------------
Parameters  : value       lower 90%   higher 90%
alpha       :    (     )
beta        :     (     )
Epeak [keV] :       (   )
Norm@50keV   :     (     )
------------------------------------------------------------

Photon flux (15-150 keV)    in  sec:  (    ) ph/cm2/s
Energy fluence (15-150 keV)             : 0 ( 0  0 ) ergs/cm2
Single BB
Spectral model blackbody:
------------------------------------------------------------
Parameters  : value    Lower 90%  Upper 90%
kT [keV]    : 13.6019  (-4.99959  11.556)
R^2/D10^2   : 0.148748  (-0.146302   0.5964)
(R is the radius in km and D10 is the distance to the source in units of 10 kpc)
------------------------------------------------------------
#Fit statistic  : Chi-Squared                   64.99     using 59 bins.
 Reduced chi-squared =
# Null hypothesis probability of 2.18e-01 with 57 degrees of freedom

Energy  Fluence     90% Error
[keV]   [erg/cm2]   [erg/cm2]
15- 25  5.827e-09   3.775e-09
25- 50  2.105e-08   1.332e-08
50-150  2.525e-08   1.810e-08
15-150  5.213e-08   3.329e-08
Thermal bremsstrahlung (OTTB)

Spectral model: thermal bremsstrahlung
------------------------------------------------------------
Parameters  : value         Lower 90%    Upper 90%
kT [keV]    : 199.363       (-199.363      -199.363)
Norm        : 3.85394       (-1.21568     1.21567)
------------------------------------------------------------
#Fit statistic  : Chi-Squared                   62.13     using 59 bins.
 Reduced chi-squared =
# Null hypothesis probability of 2.99e-01 with 57 degrees of freedom

Energy  Fluence     90% Error
[keV]   [erg/cm2]   [erg/cm2]
15- 25  9.597e-09   5.945e-09
25- 50  1.846e-08   1.177e-08
50-150  4.049e-08   2.534e-08
15-150  6.854e-08   4.297e-08
Double BB

Spectral model: bbodyrad<1> + bbodyrad<2>
------------------------------------------------------------
Parameters  : value         Lower 90%    Upper 90%
kT1 [keV]   : 9.48351        (-2.30813      5.38112)
R1^2/D10^2  : 0.449305        (-0.386711      2.92345)
kT2 [keV]   : 124.312        (-47.1438      -125.179)
R2^2/D10^2  : 2.95260E-04    (-0.000241758   0.0416298)
------------------------------------------------------------
#Fit statistic  : Chi-Squared                   60.36     using 59 bins.
 Reduced chi-squared =
# Null hypothesis probability of 2.88e-01 with 55 degrees of freedom

Energy  Fluence     90% Error
[keV]   [erg/cm2]   [erg/cm2]
15- 25  8.292e-09   5.150e-09
25- 50  2.044e-08   1.273e-08
50-150  4.849e-08   1.676e-08
15-150  7.722e-08   3.252e-08
Pre-slew spectrum (Pre-slew PHA with pre-slew DRM)
Power-law model

Spectral model in power-law:
------------------------------------------------------------
Parameters  : value       lower 90%   higher 90%
Photon index: 1.46528     ( -0.208549   0.20898 )
Norm@50keV  : 2.48509E-03    ( -0.00030606   0.000304482 )
------------------------------------------------------------
#Fit statistic  : Chi-Squared                   57.10     using 59 bins.
 Reduced chi-squared =
# Null hypothesis probability of 4.72e-01 with 57 degrees of freedom

Photon flux (15-150 keV)    in 60.92 sec: 0.307430 ( -0.0377841  0.0378478 ) ph/cm2/s
Energy fluence (15-150 keV)             : 1.44471e-06 ( -1.94413e-07  1.96595e-07 ) ergs/cm2
Cutoff power-law model

Spectral model in the cutoff power-law:
------------------------------------------------------------
Parameters  : value       lower 90%   higher 90%
Photon index: 1.12486     ( -1.12331   0.52211 )
Epeak [keV] : 124.225      ( -124.591 -124.591 )
Norm@50keV  : 3.74543E-03    ( -0.00179385   0.0105925 )
------------------------------------------------------------
#Fit statistic  : Chi-Squared                   56.71     using 59 bins.
 Reduced chi-squared =
# Null hypothesis probability of 4.48e-01 with 56 degrees of freedom

Photon flux (15-150 keV)    in 60.92 sec: 0.303346 ( -0.039701  0.039375 ) ph/cm2/s
Energy fluence (15-150 keV)             : 1.40277e-06 ( -2.32495e-07  2.23857e-07 ) ergs/cm2
Band function

Spectral model in the Band function:
------------------------------------------------------------
Parameters  : value       lower 90%   higher 90%
alpha       :    (     )
beta        :     (     )
Epeak [keV] :       (   )
Norm@50keV   :     (     )
------------------------------------------------------------

Photon flux (15-150 keV)    in  sec:  (    ) ph/cm2/s
Energy fluence (15-150 keV)             : 0 ( 0  0 ) ergs/cm2
S(25-50 keV) vs. S(50-100 keV) plot
S(25-50 keV)  = 4.41e-07
S(50-100 keV) = 5.65e-07
T90 vs. Hardness ratio plot

T90                                   = 89.8400000333786 sec.
Hardness ratio (energy fluence ratio) = 1.28118
Color vs. Color plot
Count Ratio  (25-50 keV) / (15-25 keV) = 1.51487
Count Ratio (50-100 keV) / (15-25 keV) = 0.764906
Mask shadow pattern

IMX = -2.809824120636634E-01, IMY = -5.568273803114844E-01
TIME vs. PHA plot around the trigger time

Blue+Cyan dotted lines: Time interval of the scaled map
From 0.000000 to 12.160000
TIME vs. DetID plot around the trigger time
Blue+Cyan dotted lines: Time interval of the scaled map
From 0.000000 to 12.160000
100 us light curve (15-350 keV)
Blue+Cyan dotted lines: Time interval of the scaled map
From 0.000000 to 12.160000
Spacecraft aspect plot

Bright source in the pre-burst/pre-slew/post-slew images
Pre-burst image of 15-350 keV band
Time interval of the image:
-239.648000 -1.872000

# RAcent  DECcent POSerr Theta    Phi  PeakCts   SNR AngSep     Name
#  [deg]    [deg]    ['] [deg]  [deg]                   [']
244.9524 -15.6178    2.9  58.0  -25.3   7.1532   4.0    2.1	Sco X-1
254.6495  35.3127    5.2  11.4  -78.7   0.8290   2.2    9.6	Her X-1
299.4965  35.0579    5.2  43.7 -123.1   2.8685   2.2    9.8	Cyg X-1
308.2468  41.1062    5.7  47.3 -134.9  -2.2026  -2.0   11.1	Cyg X-3
199.6759  17.7853    3.1  44.3   46.7   4.9685   3.7 ------	UNKNOWN
265.9263  70.3831    2.4  30.3  171.7   2.2272   4.7 ------	UNKNOWN
266.8387  45.6627    2.4  17.3 -132.3   1.8131   4.7 ------	UNKNOWN
298.5993  32.1435    2.2  44.5 -118.9   8.6170   5.3 ------	UNKNOWN
Pre-slew background subtracted image of 15-350 keV band
Time interval of the image:
-1.872000 59.052590

# RAcent  DECcent POSerr Theta    Phi  PeakCts   SNR AngSep     Name
#  [deg]    [deg]    ['] [deg]  [deg]                   [']
245.0142 -15.7239    4.4  58.1  -25.3   1.6103   2.6    5.4	Sco X-1
254.2070  35.2906    0.0  11.1  -77.4  -0.1166  -1.2   12.7	Her X-1
299.4033  35.2594    0.0  43.6 -123.3   0.5805   1.8    9.8	Cyg X-1
308.1091  40.9519   39.5  47.3 -134.7   0.0890   0.3    0.1	Cyg X-3
202.7752   9.2277    2.8  48.4   35.5   2.1184   4.1 ------	UNKNOWN
199.3005  60.6126    1.1  32.0  116.8   2.0397  10.7 ------	UNKNOWN
Post-slew image of 15-350 keV band
Time interval of the image:
129.652600 926.352590

# RAcent  DECcent POSerr Theta    Phi  PeakCts   SNR AngSep     Name
#  [deg]    [deg]    ['] [deg]  [deg]                   [']
213.7884  16.9914    2.5  44.9  -15.7   8.2951   4.6 ------	UNKNOWN
Plot creation:
Sat Mar  9 15:16:04 EST 2024