Estimated redshift from machine learning (Ukwatta et al. 2016) - may take a few minute to calcaulte
Image
Pre-slew 15.0-350.0 keV image (Event data)
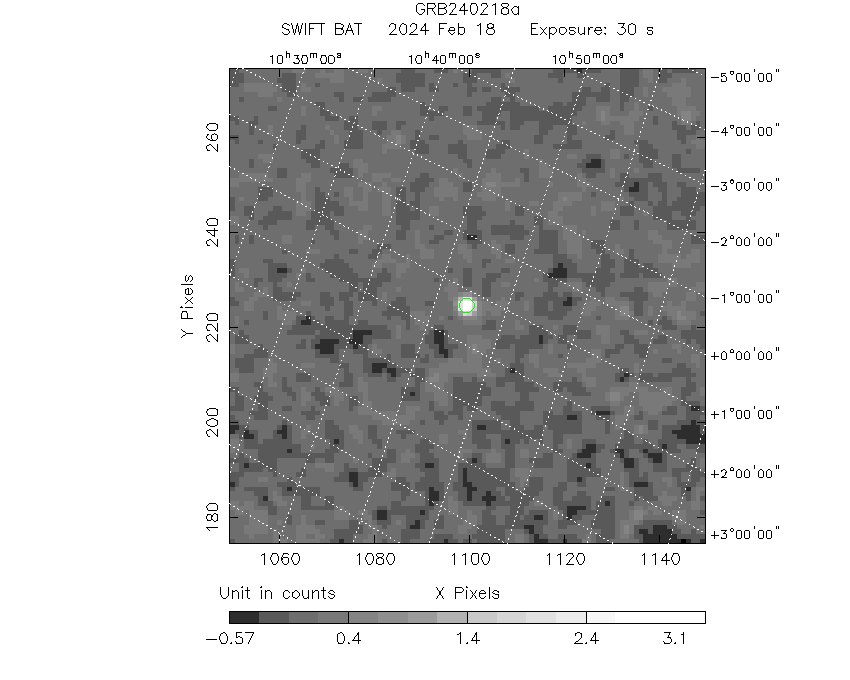
#   RAcent    DECcent   POSerr    Theta     Phi              Peak Cts       SNR   Name
  161.8058     1.2898   0.0081    35.0877   131.0785         3.5812795     23.837 TRIG_01215912

Foreground time interval of the image:
-19.224  10.501 (delta_t =  29.725 [sec])
Background time interval of the image:
-239.600 -19.224 (delta_t = 220.376 [sec])
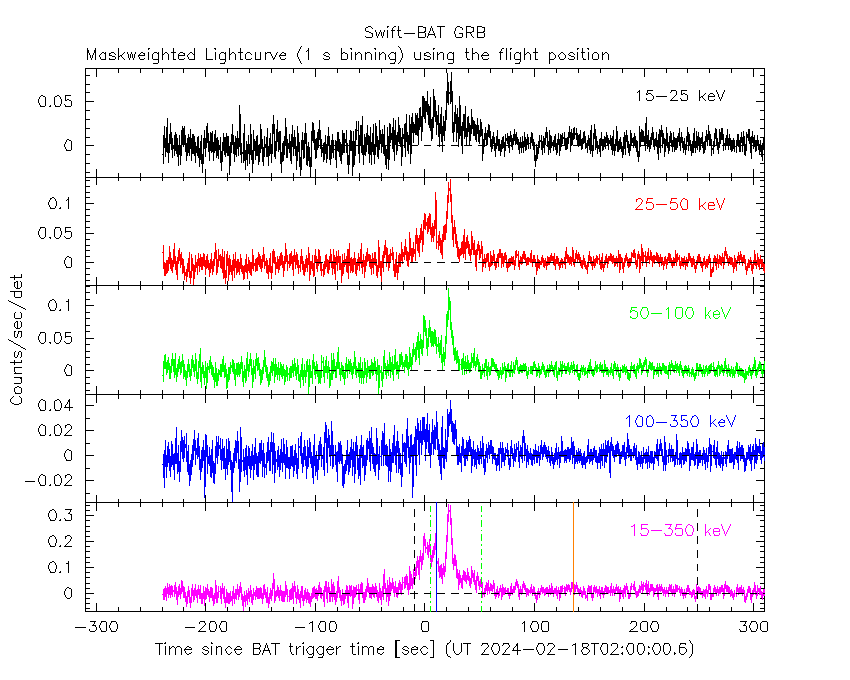
Lightcurves
Notes:
- 1) The mask-weighted light curves are using the flight position.
- 2) Multiple plots of different time binning/intervals are shown to cover all scenarios of short/long GRBs, rate/image triggers, and real/false positives.
- 3) For all the mask-weighted lightcurves, the y-axis units are counts/sec/det where a det is 0.4 x 0.4 = 0.16 sq cm.
- 4) The verticle lines correspond to following: green dotted lines are T50 interval, black dotted lines are T90 interval, blue solid line(s) is a spacecraft slew start time, and orange solid line(s) is a spacecraft slew end time.
- 5) Time of each bin is in the middle of the bin.
1 s binning
From T0-310 s to T0+310 s
From T100_start - 20 s to T100_end + 30 s

Full time interval

64 ms binning
Full time interval

From T100_start to T100_end

From T0-5 sec to T0+5 sec

16 ms binning
From T100_start-5 s to T100_start+5 s

8 ms binning
From T100_start-3 s to T100_start+3 s

2 ms binning
From T100_start-1 s to T100_start+1 s

SN=5 or 10 sec. binning (whichever binning is satisfied first)

SN=5 or 10 sec. binning (T < 200 sec)

Quad-rate summed light curves (from T0-300s to T0+1000s)

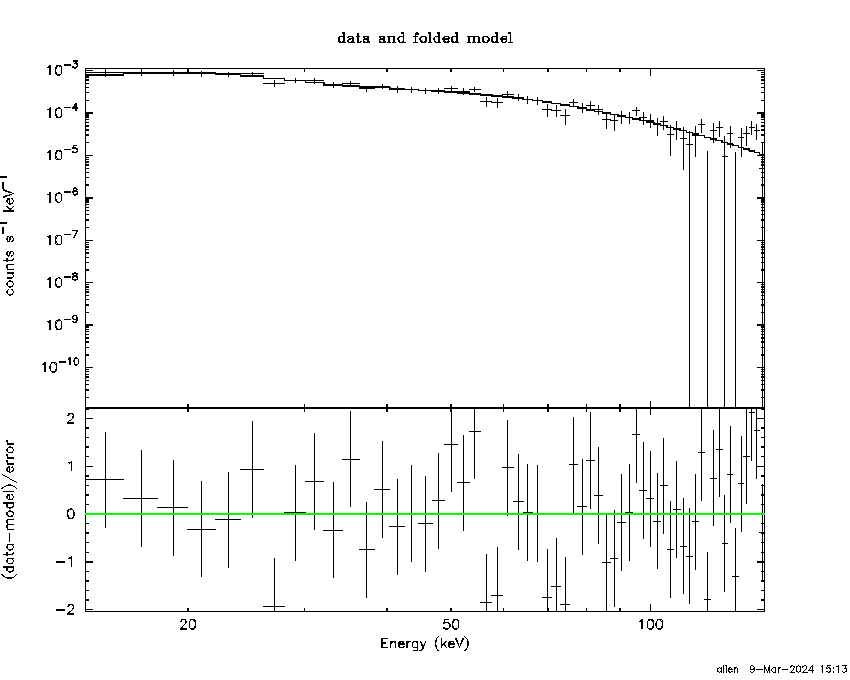
Spectral Evolution

Spectra
Notes:
- 1) The fitting includes the systematic errors.
- 2) When the burst includes telescope slew time periods, the fitting uses an average response file made from multiple 5-s response files through out the slew time plus single time preiod for the non-slew times, and weighted by the total counts in the corresponding time period using addrmf. An average response file is needed becuase a spectral fit using the pre-slew DRM will introduce some errors in both a spectral shape and a normalization if the PHA file contains a lot of the slew/post-slew time interval.
- 3) For fits to more complicated models (e.g. a power-law over a cutoff power-law), the BAT team has decided to require a chi-square improvement of more than 6 for each extra dof.
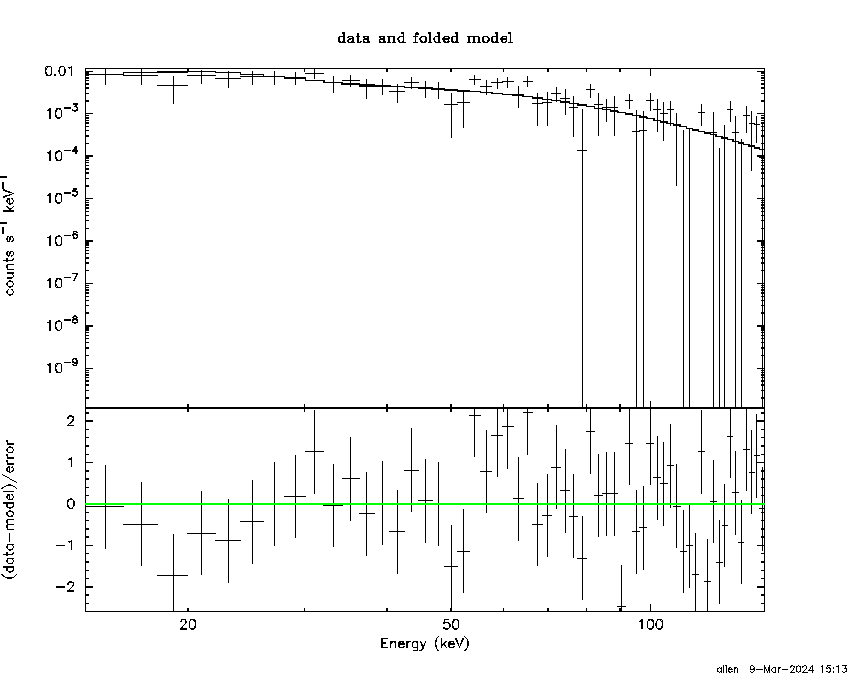
Time averaged spectrum fit using the average DRM
Power-law model

Time interval is from  -19.224 sec. to  315.300 sec.

Spectral model in power-law:
------------------------------------------------------------
Parameters  : value       lower 90%   higher 90%
Photon index: 1.61914     ( -0.0798526   0.0803192 )
Norm@50keV  : 1.98215E-03    ( -8.77709e-05   8.74555e-05 )
------------------------------------------------------------
#Fit statistic  : Chi-Squared                   60.42     using 59 bins.
 Reduced chi-squared = 1.06
# Null hypothesis probability of 3.53e-01 with 57 degrees of freedom

Photon flux (15-150 keV)    in 334.5 sec: 0.256257 ( -0.011703  0.011731 ) ph/cm2/s
Energy fluence (15-150 keV)             : 6.18765e-06 ( -2.90444e-07  2.91623e-07 ) ergs/cm2
Cutoff power-law model

Time interval is from  -19.224 sec. to  315.300 sec.
Spectral model in the cutoff power-law:
------------------------------------------------------------
Parameters  : value       lower 90%   higher 90%
Photon index: 1.40789     ( -0.340438   0.248745 )
Epeak [keV] : 142.140      ( -58.5391 -142.147 )
Norm@50keV  : 2.52244E-03    ( -0.000599555   0.00116696 )
------------------------------------------------------------
#Fit statistic  : Chi-Squared                   59.15     using 59 bins.
 Reduced chi-squared = 1.05625
# Null hypothesis probability of 3.61e-01 with 56 degrees of freedom

Photon flux (15-150 keV)    in 334.5 sec: 0.252950 ( -0.012668  0.012687 ) ph/cm2/s
Energy fluence (15-150 keV)             : 6.08492e-06 ( -3.30707e-07  3.2874e-07 ) ergs/cm2
Band function

Time interval is from  -19.224 sec. to  315.300 sec.


Spectral model in the Band function:
------------------------------------------------------------
Parameters  : value       lower 90%   higher 90%
alpha       :    (     )
beta        :     (     )
Epeak [keV] :       (   )
Norm@50keV   :     (     )
------------------------------------------------------------

Photon flux (15-150 keV)    in  sec:  (    ) ph/cm2/s
Energy fluence (15-150 keV)             : 0 ( 0  0 ) ergs/cm2
Single BB

Spectral model blackbody:
------------------------------------------------------------
Parameters  : value    Lower 90%  Upper 90%
kT [keV]    : 14.2906  (  )
R^2/D10^2   : 3.27681E-02  (   )
(R is the radius in km and D10 is the distance to the source in units of 10 kpc)
------------------------------------------------------------
#Fit statistic  : Chi-Squared                  169.84     using 59 bins.
 Reduced chi-squared =
# Null hypothesis probability of 3.76e-13 with 57 degrees of freedom

Energy  Fluence     90% Error
[keV]   [erg/cm2]   [erg/cm2]
15- 25  4.718e-07   3.847e-08
25- 50  1.791e-06   1.050e-07
50-150  2.433e-06   2.201e-07
15-150  4.695e-06   2.275e-07
Thermal bremsstrahlung (OTTB)
Spectral model: thermal bremsstrahlung
------------------------------------------------------------
Parameters  : value         Lower 90%    Upper 90%
kT [keV]    : 175.070       (-36.2109      -174.35)
Norm        : 1.03755       (-0.050904     0.0561803)
------------------------------------------------------------
#Fit statistic  : Chi-Squared                   59.55     using 59 bins.
 Reduced chi-squared =
# Null hypothesis probability of 3.83e-01 with 57 degrees of freedom

Energy  Fluence     90% Error
[keV]   [erg/cm2]   [erg/cm2]
15- 25  8.780e-07   5.586e-08
25- 50  1.662e-06   1.612e-07
50-150  3.484e-06   1.054e-06
15-150  6.024e-06   1.259e-06
Double BB

Spectral model: bbodyrad<1> + bbodyrad<2>
------------------------------------------------------------
Parameters  : value         Lower 90%    Upper 90%
kT1 [keV]   : 7.94631        (-1.46013      1.46057)
R1^2/D10^2  : 0.181991        (-0.0718483      0.166194)
kT2 [keV]   : 28.7507        (-5.99155      11.7629)
R2^2/D10^2  : 2.00634E-03    (-0.00134222   0.00279924)
------------------------------------------------------------
#Fit statistic  : Chi-Squared                   68.32     using 59 bins.
 Reduced chi-squared =
# Null hypothesis probability of 1.07e-01 with 55 degrees of freedom

Energy  Fluence     90% Error
[keV]   [erg/cm2]   [erg/cm2]
15- 25  7.807e-07   1.044e-07
25- 50  1.736e-06   2.106e-07
50-150  3.507e-06   8.886e-07
15-150  6.023e-06   1.007e-06
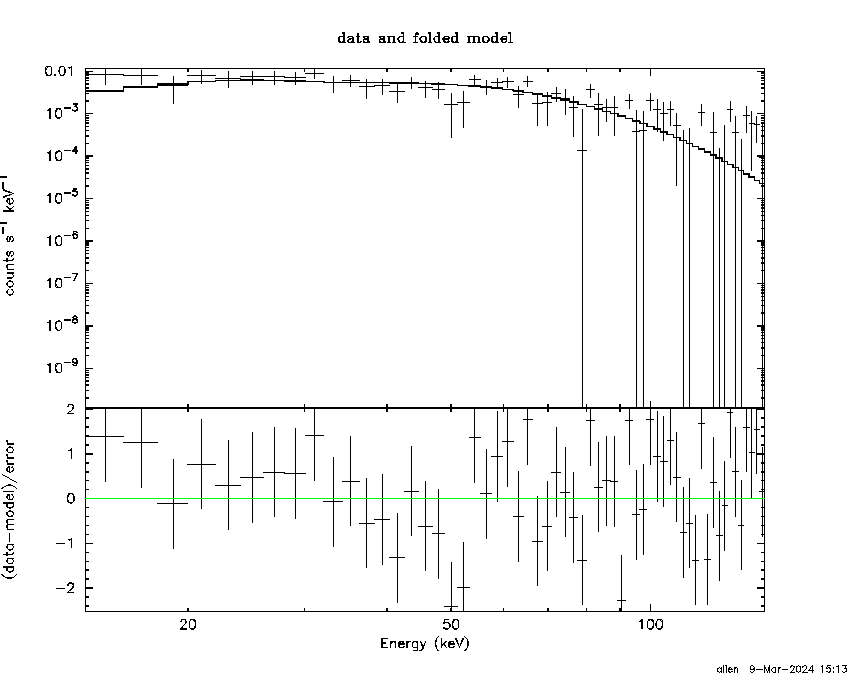
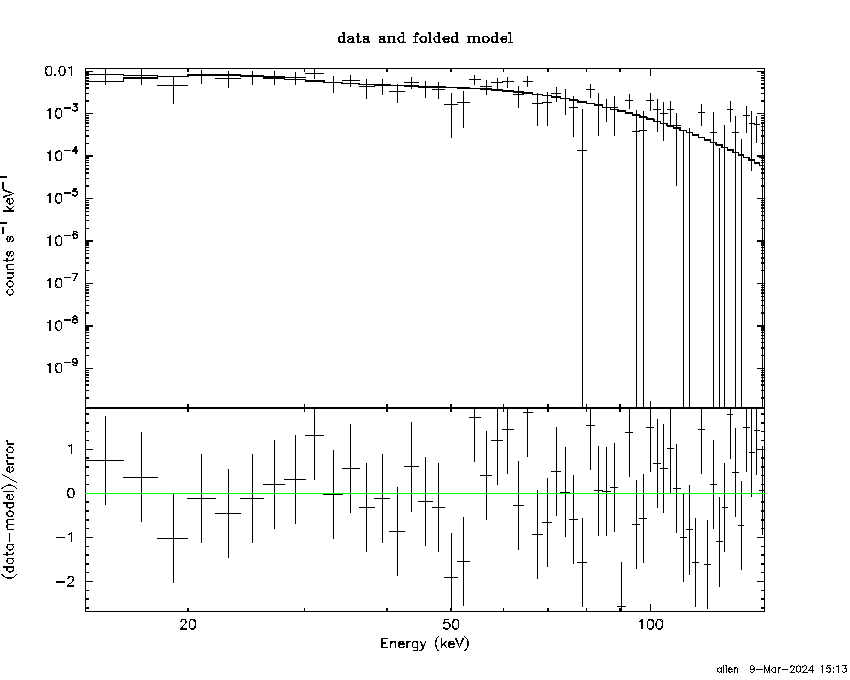
Peak spectrum fit
Power-law model

Time interval is from   21.620 sec. to   22.620 sec.

Spectral model in power-law:
------------------------------------------------------------
Parameters  : value       lower 90%   higher 90%
Photon index: 1.40468     ( -0.179708   0.182125 )
Norm@50keV  : 2.42206E-02    ( -0.00275519   0.00274811 )
------------------------------------------------------------
#Fit statistic  : Chi-Squared                   67.27     using 59 bins.
 Reduced chi-squared = 1.18018
# Null hypothesis probability of 1.66e-01 with 57 degrees of freedom

Photon flux (15-150 keV)    in 1 sec: 2.95282 ( -0.33728  0.33776 ) ph/cm2/s
Energy fluence (15-150 keV)             : 2.33841e-07 ( -2.90598e-08  2.92767e-08 ) ergs/cm2
Cutoff power-law model

Time interval is from   21.620 sec. to   22.620 sec.
Spectral model in the cutoff power-law:
------------------------------------------------------------
Parameters  : value       lower 90%   higher 90%
Photon index: 0.304777     ( -0.990356   0.814139 )
Epeak [keV] : 80.1835      ( -17.7422 78.3497 )
Norm@50keV  : 8.36385E-02    ( -0.0495064   0.162849 )
------------------------------------------------------------
#Fit statistic  : Chi-Squared                   61.69     using 59 bins.
 Reduced chi-squared = 1.10161
# Null hypothesis probability of 2.80e-01 with 56 degrees of freedom

Photon flux (15-150 keV)    in 1 sec: 2.84601 ( -0.34825  0.34772 ) ph/cm2/s
Energy fluence (15-150 keV)             : 2.21335e-07 ( -3.10432e-08  3.12456e-08 ) ergs/cm2
Band function

Time interval is from   21.620 sec. to   22.620 sec.


Spectral model in the Band function:
------------------------------------------------------------
Parameters  : value       lower 90%   higher 90%
alpha       :    (     )
beta        :     (     )
Epeak [keV] :       (   )
Norm@50keV   :     (     )
------------------------------------------------------------

Photon flux (15-150 keV)    in  sec:  (    ) ph/cm2/s
Energy fluence (15-150 keV)             : 0 ( 0  0 ) ergs/cm2
Single BB
Spectral model blackbody:
------------------------------------------------------------
Parameters  : value    Lower 90%  Upper 90%
kT [keV]    : 16.2985  (-1.98171  2.27618)
R^2/D10^2   : 0.269926  (-0.0981829   0.151455)
(R is the radius in km and D10 is the distance to the source in units of 10 kpc)
------------------------------------------------------------
#Fit statistic  : Chi-Squared                   68.95     using 59 bins.
 Reduced chi-squared =
# Null hypothesis probability of 1.33e-01 with 57 degrees of freedom

Energy  Fluence     90% Error
[keV]   [erg/cm2]   [erg/cm2]
15- 25  1.476e-08   3.160e-09
25- 50  6.310e-08   9.670e-09
50-150  1.180e-07   2.442e-08
15-150  1.958e-07   3.125e-08
Thermal bremsstrahlung (OTTB)
Spectral model: thermal bremsstrahlung
------------------------------------------------------------
Parameters  : value         Lower 90%    Upper 90%
kT [keV]    : 200.000       (-53.1052      -200)
Norm        : 12.2607       (-1.37188     1.37188)
------------------------------------------------------------
#Fit statistic  : Chi-Squared                   66.57     using 59 bins.
 Reduced chi-squared =
# Null hypothesis probability of 1.81e-01 with 57 degrees of freedom

Energy  Fluence     90% Error
[keV]   [erg/cm2]   [erg/cm2]
15- 25  3.054e-08   1.691e-08
25- 50  5.874e-08   3.228e-08
50-150  1.288e-07   7.085e-08
15-150  2.181e-07   1.193e-07
Double BB
Spectral model: bbodyrad<1> + bbodyrad<2>
------------------------------------------------------------
Parameters  : value         Lower 90%    Upper 90%
kT1 [keV]   : 6.35998        (-3.59377      5.75413)
R1^2/D10^2  : 2.63435        (-2.1422      88.9766)
kT2 [keV]   : 20.5880        (-3.98556      15.4154)
R2^2/D10^2  : 0.103207    (-0.0937875   0.0858512)
------------------------------------------------------------
#Fit statistic  : Chi-Squared                   61.39     using 59 bins.
 Reduced chi-squared =
# Null hypothesis probability of 2.58e-01 with 55 degrees of freedom

Energy  Fluence     90% Error
[keV]   [erg/cm2]   [erg/cm2]
15- 25  2.366e-08   1.330e-08
25- 50  5.961e-08   2.988e-08
50-150  1.354e-07   7.600e-08
15-150  2.187e-07   9.844e-08
Pre-slew spectrum (Pre-slew PHA with pre-slew DRM)
Power-law model

Spectral model in power-law:
------------------------------------------------------------
Parameters  : value       lower 90%   higher 90%
Photon index: 1.42135     ( -0.0989762   0.0990283 )
Norm@50keV  : 8.06266E-03    ( -0.000458105   0.000457775 )
------------------------------------------------------------
#Fit statistic  : Chi-Squared                   53.31     using 59 bins.
 Reduced chi-squared =
# Null hypothesis probability of 6.14e-01 with 57 degrees of freedom

Photon flux (15-150 keV)    in 29.72 sec: 0.986746 ( -0.0586469  0.0587678 ) ph/cm2/s
Energy fluence (15-150 keV)             : 2.30552e-06 ( -1.41655e-07  1.4214e-07 ) ergs/cm2
Cutoff power-law model

Spectral model in the cutoff power-law:
------------------------------------------------------------
Parameters  : value       lower 90%   higher 90%
Photon index: 0.978407     ( -0.43929   0.399968 )
Epeak [keV] : 122.986      ( -36.8764 493.448 )
Norm@50keV  : 1.31196E-02    ( -0.00457174   0.00785813 )
------------------------------------------------------------
#Fit statistic  : Chi-Squared                   49.71     using 59 bins.
 Reduced chi-squared =
# Null hypothesis probability of 7.10e-01 with 56 degrees of freedom

Photon flux (15-150 keV)    in 29.72 sec: 0.965231 ( -0.061608  0.061729 ) ph/cm2/s
Energy fluence (15-150 keV)             : 2.24725e-06 ( -1.53578e-07  1.52764e-07 ) ergs/cm2
Band function

Spectral model in the Band function:
------------------------------------------------------------
Parameters  : value       lower 90%   higher 90%
alpha       :    (     )
beta        :     (     )
Epeak [keV] :       (   )
Norm@50keV   :     (     )
------------------------------------------------------------

Photon flux (15-150 keV)    in  sec:  (    ) ph/cm2/s
Energy fluence (15-150 keV)             : 0 ( 0  0 ) ergs/cm2
S(25-50 keV) vs. S(50-100 keV) plot

S(25-50 keV)  = 1.62e-06
S(50-100 keV) = 2.11e-06
T90 vs. Hardness ratio plot
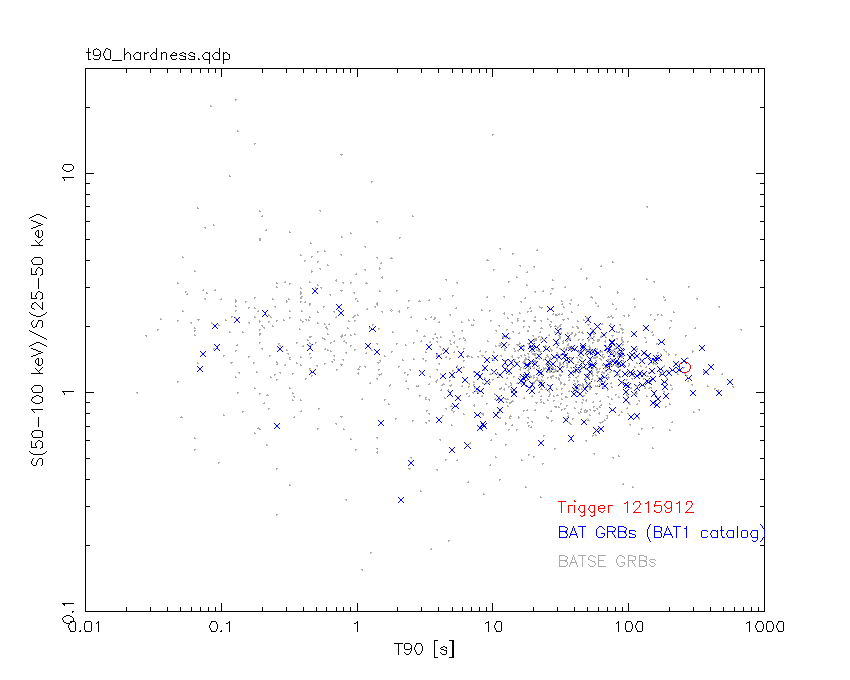
T90                                   = 258.031999945641 sec.
Hardness ratio (energy fluence ratio) = 1.30247
Color vs. Color plot

Count Ratio  (25-50 keV) / (15-25 keV) = 1.24558
Count Ratio (50-100 keV) / (15-25 keV) = 0.897885
Mask shadow pattern

IMX = -4.616012525820294E-01, IMY = -5.295442998562524E-01
TIME vs. PHA plot around the trigger time

TIME vs. DetID plot around the trigger time

100 us light curve (15-350 keV)

Spacecraft aspect plot

Bright source in the pre-burst/pre-slew/post-slew images
Pre-burst image of 15-350 keV band
Time interval of the image:
-239.600000 -19.224000

# RAcent  DECcent POSerr Theta    Phi  PeakCts   SNR AngSep     Name
#  [deg]    [deg]    ['] [deg]  [deg]                   [']
135.5729 -40.5623    2.0  27.8 -126.6   2.4990   5.7    2.1	Vela X-1
162.3501  -4.2314    2.6  33.6  140.5   2.1437   4.5 ------	UNKNOWN
120.5214  12.0312    2.3  26.9   43.2   2.0782   5.1 ------	UNKNOWN
 72.9554 -11.9610    2.1  55.2  -32.3   9.5929   5.4 ------	UNKNOWN
Pre-slew background subtracted image of 15-350 keV band
Time interval of the image:
-19.224000 10.500600

# RAcent  DECcent POSerr Theta    Phi  PeakCts   SNR AngSep     Name
#  [deg]    [deg]    ['] [deg]  [deg]                   [']
135.6052 -40.4985    2.3  27.7 -126.7  -0.4436  -4.9    4.9	Vela X-1
161.8058   1.2898    0.5  35.1  131.1   3.5811  23.8 ------	UNKNOWN
185.1200 -40.2664    2.4  55.3 -166.7   1.2905   4.8 ------	UNKNOWN
 83.6861 -25.7293    3.0  44.8  -50.1   0.8645   3.8 ------	UNKNOWN
 87.5457 -34.8657    3.5  43.6  -64.0   1.0093   3.3 ------	UNKNOWN
Post-slew image of 15-350 keV band
Time interval of the image:
135.700600 962.531000

# RAcent  DECcent POSerr Theta    Phi  PeakCts   SNR AngSep     Name
#  [deg]    [deg]    ['] [deg]  [deg]                   [']
135.4644 -40.5653    2.2  48.2  -18.2  11.4727   5.1    3.0	Vela X-1
114.1203  -7.3832    2.7  48.3   34.0  13.7710   4.3 ------	UNKNOWN
134.8704   0.2953    2.4  26.9   43.2   7.3599   4.7 ------	UNKNOWN
171.3141  11.7770    2.6  14.2  176.7   4.9383   4.4 ------	UNKNOWN
134.8755 -27.5431    3.2  38.7   -5.1   6.0225   3.6 ------	UNKNOWN
213.8744  30.3303    2.3  57.3 -170.9  23.8232   5.0 ------	UNKNOWN
174.3628 -42.9453    2.7  45.6  -57.9  23.9098   4.3 ------	UNKNOWN
Plot creation:
Sat Mar  9 15:14:02 EST 2024