Estimated redshift from machine learning (Ukwatta et al. 2016) - may take a few minute to calcaulte
Image
Pre-slew 15.0-350.0 keV image (Event data)

#   RAcent    DECcent   POSerr    Theta     Phi              Peak Cts       SNR   Name
  143.2078   -68.0314   0.0150    24.2829  -157.8715         0.3472245     12.876 TRIG_01216804

Foreground time interval of the image:
 -2.704   1.368 (delta_t =   4.072 [sec])
Background time interval of the image:
-132.387  -2.704 (delta_t = 129.683 [sec])
Lightcurves
Notes:
- 1) The mask-weighted light curves are using the flight position.
- 2) Multiple plots of different time binning/intervals are shown to cover all scenarios of short/long GRBs, rate/image triggers, and real/false positives.
- 3) For all the mask-weighted lightcurves, the y-axis units are counts/sec/det where a det is 0.4 x 0.4 = 0.16 sq cm.
- 4) The verticle lines correspond to following: green dotted lines are T50 interval, black dotted lines are T90 interval, blue solid line(s) is a spacecraft slew start time, and orange solid line(s) is a spacecraft slew end time.
- 5) Time of each bin is in the middle of the bin.
1 s binning
From T0-310 s to T0+310 s

From T100_start - 20 s to T100_end + 30 s
Full time interval
64 ms binning
Full time interval

From T100_start to T100_end

From T0-5 sec to T0+5 sec

16 ms binning
From T100_start-5 s to T100_start+5 s

Blue+Cyan dotted lines: Time interval of the scaled map
From 0.000000 to 1.024000
8 ms binning
From T100_start-3 s to T100_start+3 s

Blue+Cyan dotted lines: Time interval of the scaled map
From 0.000000 to 1.024000
2 ms binning
From T100_start-1 s to T100_start+1 s
Blue+Cyan dotted lines: Time interval of the scaled map
From 0.000000 to 1.024000
SN=5 or 10 sec. binning (whichever binning is satisfied first)

SN=5 or 10 sec. binning (T < 200 sec)

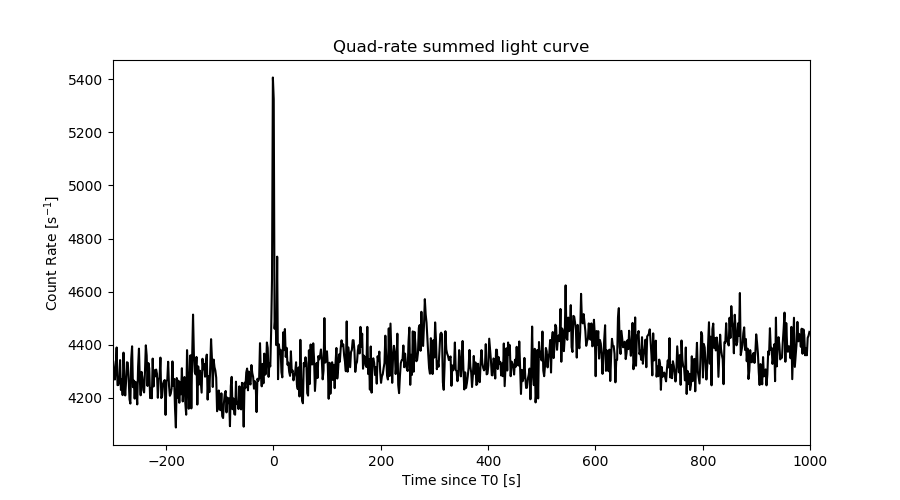
Quad-rate summed light curves (from T0-300s to T0+1000s)
Spectral Evolution

Spectra
Notes:
- 1) The fitting includes the systematic errors.
- 2) When the burst includes telescope slew time periods, the fitting uses an average response file made from multiple 5-s response files through out the slew time plus single time preiod for the non-slew times, and weighted by the total counts in the corresponding time period using addrmf. An average response file is needed becuase a spectral fit using the pre-slew DRM will introduce some errors in both a spectral shape and a normalization if the PHA file contains a lot of the slew/post-slew time interval.
- 3) For fits to more complicated models (e.g. a power-law over a cutoff power-law), the BAT team has decided to require a chi-square improvement of more than 6 for each extra dof.
Time averaged spectrum fit using the average DRM
Power-law model

Time interval is from   -2.704 sec. to    1.368 sec.

Spectral model in power-law:
------------------------------------------------------------
Parameters  : value       lower 90%   higher 90%
Photon index: 0.751449     ( -0.22918   0.214506 )
Norm@50keV  : 5.29051E-03    ( -0.000712003   0.000697735 )
------------------------------------------------------------
#Fit statistic  : Chi-Squared                   54.21     using 59 bins.
 Reduced chi-squared = 0.951053
# Null hypothesis probability of 5.80e-01 with 57 degrees of freedom

Photon flux (15-150 keV)    in 4.072 sec: 0.609401 ( -0.077689  0.07827 ) ph/cm2/s
Energy fluence (15-150 keV)             : 2.57062e-07 ( -3.20697e-08  3.21842e-08 ) ergs/cm2
Cutoff power-law model
Time interval is from   -2.704 sec. to    1.368 sec.
Spectral model in the cutoff power-law:
------------------------------------------------------------
Parameters  : value       lower 90%   higher 90%
Photon index: -4.55262E-02     ( -1.1695   0.867725 )
Epeak [keV] : 161.653      ( -64.6433 -161.653 )
Norm@50keV  : 1.09455E-02    ( -0.00591274   0.0178782 )
------------------------------------------------------------
#Fit statistic  : Chi-Squared                   51.96     using 59 bins.
 Reduced chi-squared = 0.927857
# Null hypothesis probability of 6.28e-01 with 56 degrees of freedom

Photon flux (15-150 keV)    in 4.072 sec: 0.587961 ( -0.081304  0.081871 ) ph/cm2/s
Energy fluence (15-150 keV)             : 2.49861e-07 ( -3.4152e-08  3.37598e-08 ) ergs/cm2
Band function

Time interval is from   -2.704 sec. to    1.368 sec.


Spectral model in the Band function:
------------------------------------------------------------
Parameters  : value       lower 90%   higher 90%
alpha       :    (     )
beta        :     (     )
Epeak [keV] :       (   )
Norm@50keV   :     (     )
------------------------------------------------------------

Photon flux (15-150 keV)    in  sec:  (    ) ph/cm2/s
Energy fluence (15-150 keV)             : 0 ( 0  0 ) ergs/cm2
Single BB
Spectral model blackbody:
------------------------------------------------------------
Parameters  : value    Lower 90%  Upper 90%
kT [keV]    : 27.0492  (-4.12851  5.48585)
R^2/D10^2   : 1.24507E-02  (-0.00519006   0.00810425)
(R is the radius in km and D10 is the distance to the source in units of 10 kpc)
------------------------------------------------------------
#Fit statistic  : Chi-Squared                   55.08     using 59 bins.
 Reduced chi-squared =
# Null hypothesis probability of 5.47e-01 with 57 degrees of freedom

Energy  Fluence     90% Error
[keV]   [erg/cm2]   [erg/cm2]
15- 25  6.171e-09   1.670e-09
25- 50  3.638e-08   9.638e-09
50-150  1.943e-07   3.824e-08
15-150  2.369e-07   4.689e-08
Thermal bremsstrahlung (OTTB)
Spectral model: thermal bremsstrahlung
------------------------------------------------------------
Parameters  : value         Lower 90%    Upper 90%
kT [keV]    : 200.000       (-21.1793      -200)
Norm        : 2.48188       (-0.330142     0.330142)
------------------------------------------------------------
#Fit statistic  : Chi-Squared                   91.10     using 59 bins.
 Reduced chi-squared =
# Null hypothesis probability of 2.76e-03 with 57 degrees of freedom

Energy  Fluence     90% Error
[keV]   [erg/cm2]   [erg/cm2]
15- 25  2.517e-08   1.428e-08
25- 50  4.843e-08   2.663e-08
50-150  1.062e-07   5.886e-08
15-150  1.798e-07   1.008e-07
Double BB
Spectral model: bbodyrad<1> + bbodyrad<2>
------------------------------------------------------------
Parameters  : value         Lower 90%    Upper 90%
kT1 [keV]   : 9.31568        (-4.40781      13.7773)
R1^2/D10^2  : 0.103219        (-0.0954536      1.70503)
kT2 [keV]   : 34.2487        (-8.55008      -34.1548)
R2^2/D10^2  : 5.58364E-03    (-0.00520625   0.0086475)
------------------------------------------------------------
#Fit statistic  : Chi-Squared                   51.33     using 59 bins.
 Reduced chi-squared =
# Null hypothesis probability of 6.15e-01 with 55 degrees of freedom

Energy  Fluence     90% Error
[keV]   [erg/cm2]   [erg/cm2]
15- 25  1.105e-08   6.546e-09
25- 50  4.105e-08   2.140e-08
50-150  2.002e-07   1.075e-07
15-150  2.523e-07   1.304e-07
Peak spectrum fit
Power-law model

Time interval is from   -0.204 sec. to    0.796 sec.

Spectral model in power-law:
------------------------------------------------------------
Parameters  : value       lower 90%   higher 90%
Photon index: 0.830411     ( -0.237274   0.226152 )
Norm@50keV  : 1.08310E-02    ( -0.00151184   0.00149737 )
------------------------------------------------------------
#Fit statistic  : Chi-Squared                   53.35     using 59 bins.
 Reduced chi-squared = 0.935965
# Null hypothesis probability of 6.13e-01 with 57 degrees of freedom

Photon flux (15-150 keV)    in 1 sec: 1.24373 ( -0.17053  0.17117 ) ph/cm2/s
Energy fluence (15-150 keV)             : 1.24994e-07 ( -1.78766e-08  1.8004e-08 ) ergs/cm2
Cutoff power-law model

Time interval is from   -0.204 sec. to    0.796 sec.
Spectral model in the cutoff power-law:
------------------------------------------------------------
Parameters  : value       lower 90%   higher 90%
Photon index: -0.136557     ( -1.25104   0.956426 )
Epeak [keV] : 129.992      ( -43.3731 1795.5 )
Norm@50keV  : 2.81848E-02    ( -0.0169593   0.0615694 )
------------------------------------------------------------
#Fit statistic  : Chi-Squared                   50.36     using 59 bins.
 Reduced chi-squared = 0.899286
# Null hypothesis probability of 6.87e-01 with 56 degrees of freedom

Photon flux (15-150 keV)    in 1 sec: 1.19732 ( -0.17676  0.17724 ) ph/cm2/s
Energy fluence (15-150 keV)             : 1.19286e-07 ( -1.96836e-08  1.93736e-08 ) ergs/cm2
Band function

Time interval is from   -0.204 sec. to    0.796 sec.


Spectral model in the Band function:
------------------------------------------------------------
Parameters  : value       lower 90%   higher 90%
alpha       :    (     )
beta        :     (     )
Epeak [keV] :       (   )
Norm@50keV   :     (     )
------------------------------------------------------------

Photon flux (15-150 keV)    in  sec:  (    ) ph/cm2/s
Energy fluence (15-150 keV)             : 0 ( 0  0 ) ergs/cm2
Single BB
Spectral model blackbody:
------------------------------------------------------------
Parameters  : value    Lower 90%  Upper 90%
kT [keV]    : 23.8496  (-3.90942  5.10188)
R^2/D10^2   : 3.66147E-02  (-0.016144   0.0268474)
(R is the radius in km and D10 is the distance to the source in units of 10 kpc)
------------------------------------------------------------
#Fit statistic  : Chi-Squared                   53.10     using 59 bins.
 Reduced chi-squared =
# Null hypothesis probability of 6.22e-01 with 57 degrees of freedom

Energy  Fluence     90% Error
[keV]   [erg/cm2]   [erg/cm2]
15- 25  3.707e-09   1.118e-09
25- 50  2.052e-08   4.340e-09
50-150  8.700e-08   2.324e-08
15-150  1.112e-07   2.360e-08
Thermal bremsstrahlung (OTTB)

Spectral model: thermal bremsstrahlung
------------------------------------------------------------
Parameters  : value         Lower 90%    Upper 90%
kT [keV]    : 200.000       (-27.6957      -200)
Norm        : 4.89897       (-0.711218     0.711218)
------------------------------------------------------------
#Fit statistic  : Chi-Squared                   78.09     using 59 bins.
 Reduced chi-squared =
# Null hypothesis probability of 3.33e-02 with 57 degrees of freedom

Energy  Fluence     90% Error
[keV]   [erg/cm2]   [erg/cm2]
15- 25  1.219e-08   6.915e-09
25- 50  2.346e-08   1.319e-08
50-150  5.144e-08   2.909e-08
15-150  8.709e-08   4.845e-08
Double BB
Spectral model: bbodyrad<1> + bbodyrad<2>
------------------------------------------------------------
Parameters  : value         Lower 90%    Upper 90%
kT1 [keV]   : 11.5752        (-6.34      11.5912)
R1^2/D10^2  : 0.142716        (-0.0634122      1.81373)
kT2 [keV]   : 35.1315        (-32.0423      -36.2243)
R2^2/D10^2  : 9.01850E-03    (-0.00803622   0.0308746)
------------------------------------------------------------
#Fit statistic  : Chi-Squared                   49.83     using 59 bins.
 Reduced chi-squared =
# Null hypothesis probability of 6.72e-01 with 55 degrees of freedom

Energy  Fluence     90% Error
[keV]   [erg/cm2]   [erg/cm2]
15- 25  5.601e-09   3.339e-09
25- 50  2.244e-08   1.310e-08
50-150  9.250e-08   4.915e-08
15-150  1.205e-07   6.305e-08
Pre-slew spectrum (Pre-slew PHA with pre-slew DRM)
Power-law model
Spectral model in power-law:
------------------------------------------------------------
Parameters  : value       lower 90%   higher 90%
Photon index: 0.751449     ( -0.22918   0.214506 )
Norm@50keV  : 5.29051E-03    ( -0.000712003   0.000697735 )
------------------------------------------------------------
#Fit statistic  : Chi-Squared                   54.21     using 59 bins.
 Reduced chi-squared =
# Null hypothesis probability of 5.80e-01 with 57 degrees of freedom

Photon flux (15-150 keV)    in 4.072 sec: 0.609410 ( -0.0776909  0.0782679 ) ph/cm2/s
Energy fluence (15-150 keV)             : 2.57033e-07 ( -3.20635e-08  3.21913e-08 ) ergs/cm2
Cutoff power-law model

Spectral model in the cutoff power-law:
------------------------------------------------------------
Parameters  : value       lower 90%   higher 90%
Photon index: -4.55263E-02     ( -1.1695   0.867725 )
Epeak [keV] : 161.653      ( -59.7322 -161.653 )
Norm@50keV  : 1.09455E-02    ( -0.00592275   0.0178782 )
------------------------------------------------------------
#Fit statistic  : Chi-Squared                   51.96     using 59 bins.
 Reduced chi-squared =
# Null hypothesis probability of 6.28e-01 with 56 degrees of freedom

Photon flux (15-150 keV)    in 4.072 sec: 0.587970 ( -0.081292  0.081857 ) ph/cm2/s
Energy fluence (15-150 keV)             : 2.49993e-07 ( -3.41726e-08  3.37866e-08 ) ergs/cm2
Band function
Spectral model in the Band function:
------------------------------------------------------------
Parameters  : value       lower 90%   higher 90%
alpha       :    (     )
beta        :     (     )
Epeak [keV] :       (   )
Norm@50keV   :     (     )
------------------------------------------------------------

Photon flux (15-150 keV)    in  sec:  (    ) ph/cm2/s
Energy fluence (15-150 keV)             : 0 ( 0  0 ) ergs/cm2
S(25-50 keV) vs. S(50-100 keV) plot

S(25-50 keV)  = 4.00e-08
S(50-100 keV) = 9.53e-08
T90 vs. Hardness ratio plot

T90                                   = 3.94399988651276 sec.
Hardness ratio (energy fluence ratio) = 2.3825
Color vs. Color plot
Count Ratio  (25-50 keV) / (15-25 keV) = 2.57971
Count Ratio (50-100 keV) / (15-25 keV) = 3.21077
Mask shadow pattern

IMX = -4.179265294965571E-01, IMY = 1.699443114918553E-01
TIME vs. PHA plot around the trigger time
Blue+Cyan dotted lines: Time interval of the scaled map
From 0.000000 to 1.024000
TIME vs. DetID plot around the trigger time

Blue+Cyan dotted lines: Time interval of the scaled map
From 0.000000 to 1.024000
100 us light curve (15-350 keV)

Blue+Cyan dotted lines: Time interval of the scaled map
From 0.000000 to 1.024000
Spacecraft aspect plot
Bright source in the pre-burst/pre-slew/post-slew images
Pre-burst image of 15-350 keV band
Time interval of the image:
-132.387400 -2.704000

# RAcent  DECcent POSerr Theta    Phi  PeakCts   SNR AngSep     Name
#  [deg]    [deg]    ['] [deg]  [deg]                   [']
135.6249 -40.6323    1.5  15.4  115.1   1.6751   7.5    6.4	Vela X-1
170.5731 -60.6268    3.0  32.8  179.3   1.0479   3.9    7.6	Cen X-3
186.3543 -62.8329   21.8  40.0 -175.5  -0.1754  -0.5    9.1	GX 301-2
175.1695 -54.5732    2.2  36.2  169.4   1.5401   5.3 ------	UNKNOWN
Pre-slew background subtracted image of 15-350 keV band
Time interval of the image:
-2.704000 1.368000

# RAcent  DECcent POSerr Theta    Phi  PeakCts   SNR AngSep     Name
#  [deg]    [deg]    ['] [deg]  [deg]                   [']
135.4961 -40.5505    5.1  15.4  115.1   0.0631   2.3    1.5	Vela X-1
170.2053 -60.7319   34.6  32.8  179.6  -0.0106  -0.3    7.3	Cen X-3
186.6504 -62.7740  182.2  40.3 -175.5  -0.0025  -0.1    0.3	GX 301-2
152.3573 -32.0503    2.8  31.3  119.2   0.1597   4.1 ------	UNKNOWN
143.2078 -68.0314    0.9  24.3 -157.9   0.3474  12.9 ------	UNKNOWN
241.7167 -70.6547    2.1  55.2 -153.0   0.6246   5.4 ------	UNKNOWN
Post-slew image of 15-350 keV band
Time interval of the image:
76.812600 962.802000

# RAcent  DECcent POSerr Theta    Phi  PeakCts   SNR AngSep     Name
#  [deg]    [deg]    ['] [deg]  [deg]                   [']
135.5439 -40.5254    1.3  27.8   65.7  17.1011   8.6    1.9	Vela X-1
170.3291 -60.6092    1.8  13.7  148.7   8.3280   6.4    0.9	Cen X-3
186.6303 -62.7625    3.6  18.4  172.6   3.9785   3.2    0.9	GX 301-2
 92.2156 -35.4871    4.0  43.1   10.4   6.2802   2.9 ------	UNKNOWN
186.7872 -80.4846    3.2  16.4 -125.6   4.3866   3.6 ------	UNKNOWN
Plot creation:
Sat Mar  9 15:13:23 EST 2024