Estimated redshift from machine learning (Ukwatta et al. 2016) - may take a few minutes to calcaulte
Image
Pre-slew 15-350 keV image (Event data; bkg subtracted)

#   RAcent  DECcent POSerr  Theta    Phi     Peak Cts     SNR  Name
  245.2550 -15.7533 0.0626    0.0  -30.1      -0.0575    -3.1  TRIG_01216909
------------------------------------------

Foreground time interval of the image:
134.480 136.212 (delta_t =   1.732 [sec])
164.000 164.876 (delta_t =   0.876 [sec])
Background time interval of the image:
-119.000 -23.150 (delta_t =  95.850 [sec])
-20.000 134.480 (delta_t = 154.480 [sec])
Lightcurves
Notes:
- 1) All plots contain as much data as has been downloaded to date.
- 2) The mask-weighted light curves are using the flight position.
- 3) Multiple plots of different time binning/intervals are shown to cover all scenarios of short/long GRBs, rate/image triggers, and real/false positives.
- 4) For all the mask-weighted lightcurves, the y-axis units are counts/sec/det where a det is 0.4 x 0.4 = 0.16 sq cm.
- 5) The verticle lines correspond to following: green dotted lines are T50 interval, black dotted lines are T90 interval, blue solid line(s) is a spacecraft slew start time, and orange solid line(s) is a spacecraft slew end time.
- 6) Time of each bin is in the middle of the bin.
1 s binning
From T0-310 s to T0+310 s

From T100_start - 20 s to T100_end + 30 s

Full time interval

64 ms binning
Full time interval

From T100_start to T100_end

From T0-5 sec to T0+5 sec

16 ms binning
From T100_start-5 s to T100_start+5 s

Blue+Cyan dotted lines: Time interval of the scaled map
From 0.000000 to 64.000000
8 ms binning
From T100_start-3 s to T100_start+3 s

Blue+Cyan dotted lines: Time interval of the scaled map
From 0.000000 to 64.000000
2 ms binning
From T100_start-1 s to T100_start+1 s

Blue+Cyan dotted lines: Time interval of the scaled map
From 0.000000 to 64.000000
SN=5 or 10 sec. binning (whichever binning is satisfied first)

SN=5 or 10 sec. binning (T < 200 sec)

Spectra
Notes:
- 1) The fitting includes the systematic errors.
- 2) For long bursts, a spectral fit of the pre-slew DRM will introduce some errors in both a spectral shape and a normalization if the PHA file contains a lot of the slew/post-slew time interval.
- 3) For fits to more complicated models (e.g. a power-law over a cutoff power-law), the BAT team has decided to require a chi-square improvement of more than 6 for each extra dof.
- 4) For short bursts (T90<1sec), the specrtum is also fit with Blackbody, OTTB, and Double Blackbody.
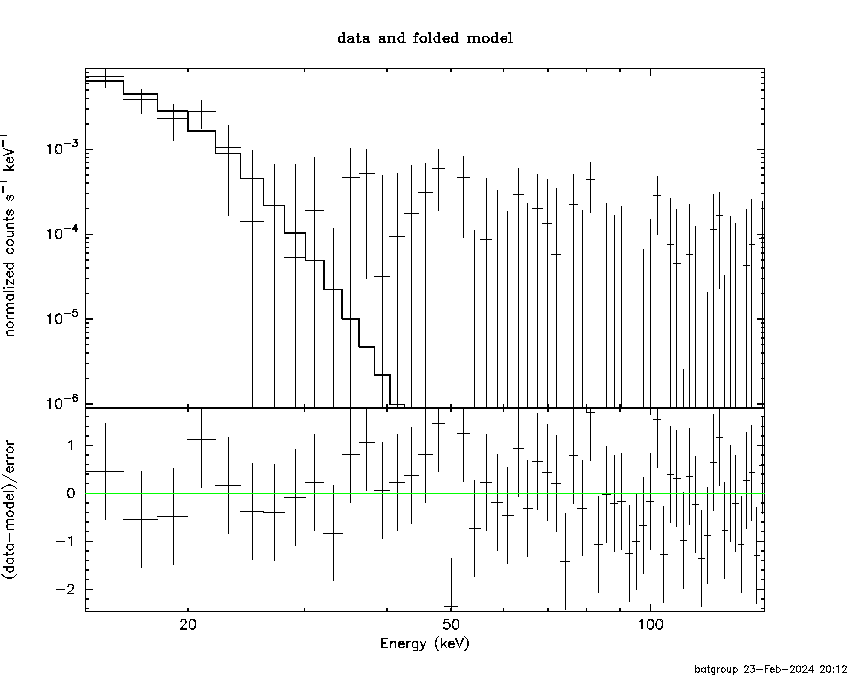
Time averaged spectrum fit using the pre-slew DRM
Power-law model

Multiple GTIs in the spectrum
tstart tstop
134.480000 136.212200
164.000000 164.876000

Spectral model in power-law:
------------------------------------------------------------
Parameters  : value       lower 90%   higher 90%
Photon index: 5.94387     ( -1.54523   2.20711 )
Norm@50keV  : 7.21599E-05    ( -7.21459e-05   0.000293303 )
------------------------------------------------------------
#Fit statistic : Chi-Squared =          40.89 using 59 PHA bins.
# Reduced chi-squared =         0.7173 for     57 degrees of freedom
# Null hypothesis probability =   9.470362e-01

Photon flux (15-150 keV)    in 2.608 sec: 0.280694 ( -0.091461  0.0911029 ) ph/cm2/s
Energy fluence (15-150 keV)             : 2.20491e-08 ( -8.05095e-09  9.0387e-09 ) ergs/cm2
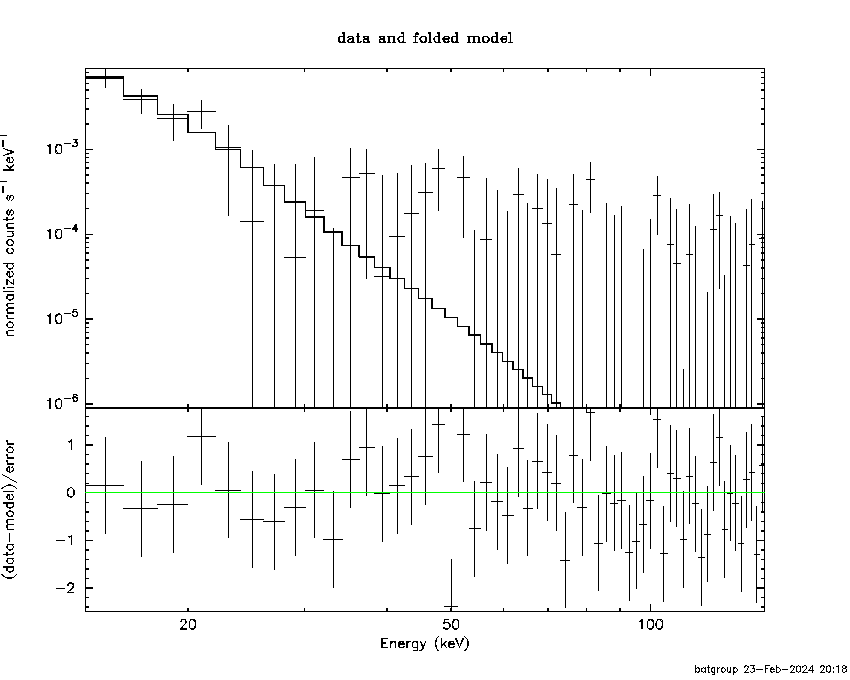
Cutoff power-law model

Multiple GTIs in the spectrum
tstart tstop
134.480000 136.212200
164.000000 164.876000
Spectral model in the cutoff power-law:
------------------------------------------------------------
Parameters  : value       lower 90%   higher 90%
Photon index: 1.00000     (     )
Epeak [keV] : 50.0000      (   )
Norm@50keV  : 3.58153E-03    (     )
------------------------------------------------------------
#Fit statistic : Chi-Squared =          70.07 using 59 PHA bins.
# Reduced chi-squared =          1.251 for     56 degrees of freedom
# Null hypothesis probability =   9.786145e-02

Photon flux (15-150 keV)    in 2.608 sec: 0.279286 (    ) ph/cm2/s
Energy fluence (15-150 keV)             : 2.18357e-08 ( -7.87566e-09  9.24773e-09 ) ergs/cm2
Band function

Multiple GTIs in the spectrum
tstart tstop
134.480000 136.212200
164.000000 164.876000

Spectral model in the Band function:
------------------------------------------------------------
Parameters  : value       lower 90%   higher 90%
alpha       : -3.58842   ( 1.27707   3.58739 )
beta        : -5.94654    ( 1.4608   -1.74731 )
Epeak [keV] : 31.7487      ( -31.7487 -31.7487 )
Norm@50keV   : 1.02221    ( 842.236   -1.01975 )
------------------------------------------------------------
#Fit statistic : Chi-Squared =          40.89 using 59 PHA bins.
# Reduced chi-squared =         0.7434 for     55 degrees of freedom
# Null hypothesis probability =   9.217413e-01

Photon flux (15-150 keV)    in 2.608 sec:  (    ) ph/cm2/s
Energy fluence (15-150 keV)             : 0 ( 0  0 ) ergs/cm2
Single BB
Spectral model blackbody:
------------------------------------------------------------
Parameters  : value    Lower 90%  Upper 90%
kT [keV]    : 2.27277  (-0.622651  0.774048)
R^2/D10^2   : 289.658  (-289.658   3796.14)
(R is the radius in km and D10 is the distance to the source in units of 10 kpc)
------------------------------------------------------------
#Fit statistic : Chi-Squared =          41.14 using 59 PHA bins.
# Reduced chi-squared =         0.7218 for     57 degrees of freedom
# Null hypothesis probability =   9.437219e-01

Energy  Fluence     90% Error
[keV]   [erg/cm2]   [erg/cm2]
15- 25  2.014e-08   1.138e-08
25- 50  9.910e-10   6.683e-10
50-150  1.174e-13   1.614e-13
15-150  2.113e-08   1.152e-08
Thermal bremsstrahlung (OTTB)

XSPEC12>exit
 XSPEC: quit


Spectral model: thermal bremsstrahlung
------------------------------------------------------------
Parameters  : value         Lower 90%    Upper 90%
kT [keV]    : 3.99970       (-1.50184      2.59607)
Norm        : 157.632       (-157.633     1428.89)
------------------------------------------------------------
 Reduced chi-squared =

Energy  Fluence     90% Error
[keV]   [erg/cm2]   [erg/cm2]
15- 25  1.979e-08   1.132e-08
25- 50  1.441e-09   8.996e-10
50-150  2.123e-12   2.658e-12
15-150  2.124e-08   1.202e-08
Double BB

XSPEC12>exit
 XSPEC: quit


Spectral model: bbodyrad<1> + bbodyrad<2>
------------------------------------------------------------
Parameters  : value         Lower 90%    Upper 90%
kT1 [keV]   : 2.10719        (-0.622643      0.774057)
R1^2/D10^2  : 490.015        (-251.497      3796.36)
kT2 [keV]   : 9.89986        (-3.65024      -3.65024)
R2^2/D10^2  : 2.26311E-02    (-0.0198541   16830.7)
------------------------------------------------------------
 Reduced chi-squared =

Energy  Fluence     90% Error
[keV]   [erg/cm2]   [erg/cm2]
15- 25  0.000e+00   0.000e+00
25- 50  0.000e+00   0.000e+00
50-150  0.000e+00   0.000e+00
15-150  0.000e+00   0.000e+00
Peak spectrum fit
Power-law model

Time interval is from  135.448 sec. to  136.212 sec.

Spectral model in power-law:
------------------------------------------------------------
Parameters  : value       lower 90%   higher 90%
Photon index: 5.93850     ( -2.94969   -5.94761 )
Norm@50keV  : 8.70644E-05    ( -8.57223e-05   0.00152842 )
------------------------------------------------------------
#Fit statistic : Chi-Squared =          36.60 using 59 PHA bins.
# Reduced chi-squared =         0.6420 for     57 degrees of freedom
# Null hypothesis probability =   9.837632e-01

Photon flux (15-150 keV)    in 0.7642 sec: 0.336255 ( -0.178747  0.190735 ) ph/cm2/s
Energy fluence (15-150 keV)             : 7.73745e-09 ( -7.73523e-09  7.88502e-09 ) ergs/cm2
Cutoff power-law model

Time interval is from  135.448 sec. to  136.212 sec.
Spectral model in the cutoff power-law:
------------------------------------------------------------
Parameters  : value       lower 90%   higher 90%
Photon index: 1.86896     (     )
Epeak [keV] : 0.641871      (   )
Norm@50keV  : 0.257985    (     )
------------------------------------------------------------
#Fit statistic : Chi-Squared =          37.46 using 59 PHA bins.
# Reduced chi-squared =         0.6689 for     56 degrees of freedom
# Null hypothesis probability =   9.731350e-01

Photon flux (15-150 keV)    in 0.7642 sec: 0.338270 ( -0.181272  0.183091 ) ph/cm2/s
Energy fluence (15-150 keV)             : 7.31613e-09 ( -4.06323e-09  8.33673e-09 ) ergs/cm2
Band function

Time interval is from  135.448 sec. to  136.212 sec.

Spectral model in the Band function:
------------------------------------------------------------
Parameters  : value       lower 90%   higher 90%
alpha       : 5.00000   ( -5   -5 )
beta        : -6.20047    (     )
Epeak [keV] : 0.663774      (   )
Norm@50keV   : 9.09460E+07    (     )
------------------------------------------------------------
#Fit statistic : Chi-Squared =          36.61 using 59 PHA bins.
# Reduced chi-squared =         0.6657 for     55 degrees of freedom
# Null hypothesis probability =   9.733865e-01

Photon flux (15-150 keV)    in 0.7642 sec:  (    ) ph/cm2/s
Energy fluence (15-150 keV)             : 0 ( 0  0 ) ergs/cm2
Single BB

 XSPEC: quit


Spectral model blackbody:
------------------------------------------------------------
Parameters  : value    Lower 90%  Upper 90%
kT [keV]    : 2.00509  (-0.825884  1.24816)
R^2/D10^2   : 873.877  (-991.077   189002)
(R is the radius in km and D10 is the distance to the source in units of 10 kpc)
------------------------------------------------------------
 Reduced chi-squared =

Energy  Fluence     90% Error
[keV]   [erg/cm2]   [erg/cm2]
15- 25  6.275e-09   3.844e-09
25- 50  1.723e-10   1.408e-10
50-150  4.816e-15   1.294e-14
15-150  6.448e-09   3.901e-09
Thermal bremsstrahlung (OTTB)

XSPEC12>exit
 XSPEC: quit


Spectral model: thermal bremsstrahlung
------------------------------------------------------------
Parameters  : value         Lower 90%    Upper 90%
kT [keV]    : 3.43046       (-1.80109      5.6052)
Norm        : 359.230       (-375.124     42115.7)
------------------------------------------------------------
 Reduced chi-squared =

Energy  Fluence     90% Error
[keV]   [erg/cm2]   [erg/cm2]
15- 25  6.445e-09   3.589e-09
25- 50  3.022e-10   2.284e-10
50-150  1.572e-13   2.522e-13
15-150  6.748e-09   3.924e-09
Double BB

XSPEC12>exit
 XSPEC: quit


Spectral model: bbodyrad<1> + bbodyrad<2>
------------------------------------------------------------
Parameters  : value         Lower 90%    Upper 90%
kT1 [keV]   : 1.87687        (-0.86153      1.09968)
R1^2/D10^2  : 1293.00        (-3216.3      6623.31)
kT2 [keV]   : 14.2396        (-7.90869      22.3293)
R2^2/D10^2  : 2.63019E-02    (-0.0304724   0.791273)
------------------------------------------------------------
 Reduced chi-squared =

Energy  Fluence     90% Error
[keV]   [erg/cm2]   [erg/cm2]
15- 25  5.972e-09   3.615e-09
25- 50  3.351e-09   2.259e-09
50-150  4.377e-09   3.667e-09
15-150  1.370e-08   8.227e-09
Pre-slew spectrum (Pre-slew PHA with pre-slew DRM)
Power-law model
Spectral model in power-law:
------------------------------------------------------------
Parameters  : value       lower 90%   higher 90%
Photon index: 5.94387     ( -1.54523   2.20711 )
Norm@50keV  : 7.21599E-05    ( -7.21459e-05   0.000293303 )
------------------------------------------------------------
#Fit statistic : Chi-Squared =          40.89 using 59 PHA bins.
# Reduced chi-squared =         0.7173 for     57 degrees of freedom
# Null hypothesis probability =   9.470362e-01

Photon flux (15-150 keV)    in 2.608 sec: 0.280694 ( -0.091461  0.0911029 ) ph/cm2/s
Energy fluence (15-150 keV)             : 2.20491e-08 ( -8.05095e-09  9.0387e-09 ) ergs/cm2
Cutoff power-law model

Spectral model in the cutoff power-law:
------------------------------------------------------------
Parameters  : value       lower 90%   higher 90%
Photon index: 1.00000     (     )
Epeak [keV] : 50.0000      (   )
Norm@50keV  : 3.58153E-03    (     )
------------------------------------------------------------
#Fit statistic : Chi-Squared =          70.07 using 59 PHA bins.
# Reduced chi-squared =          1.251 for     56 degrees of freedom
# Null hypothesis probability =   9.786145e-02

Photon flux (15-150 keV)    in 2.608 sec: 0.279286 (    ) ph/cm2/s
Energy fluence (15-150 keV)             : 2.18357e-08 ( -7.87566e-09  9.24773e-09 ) ergs/cm2
Band function

Spectral model in the Band function:
------------------------------------------------------------
Parameters  : value       lower 90%   higher 90%
alpha       : -3.58842   ( 1.27707   3.58739 )
beta        : -5.94654    ( 1.4608   -1.74731 )
Epeak [keV] : 31.7487      ( -31.7487 -31.7487 )
Norm@50keV   : 1.02221    ( 842.236   -1.01975 )
------------------------------------------------------------
#Fit statistic : Chi-Squared =          40.89 using 59 PHA bins.
# Reduced chi-squared =         0.7434 for     55 degrees of freedom
# Null hypothesis probability =   9.217413e-01

Photon flux (15-150 keV)    in 2.608 sec:  (    ) ph/cm2/s
Energy fluence (15-150 keV)             : 0 ( 0  0 ) ergs/cm2
S(25-50 keV) vs. S(50-100 keV) plot

S(25-50 keV)  = 2.75e-09
S(50-100 keV) = 1.79e-10
T90 vs. Hardness ratio plot

T90                                   = 1.1360000371933 sec.
Hardness ratio (energy fluence ratio) = 0.0650909
Color vs. Color plot

Count Ratio  (25-50 keV) / (15-25 keV) = 0.139151
Count Ratio (50-100 keV) / (15-25 keV) = -0.0809559
Mask shadow pattern

IMX = 1.833684830662600E-04, IMY = 1.064235333154780E-04
TIME vs. PHA plot around the trigger time

Blue+Cyan dotted lines: Time interval of the scaled map
From 0.000000 to 64.000000
TIME vs. DetID plot around the trigger time
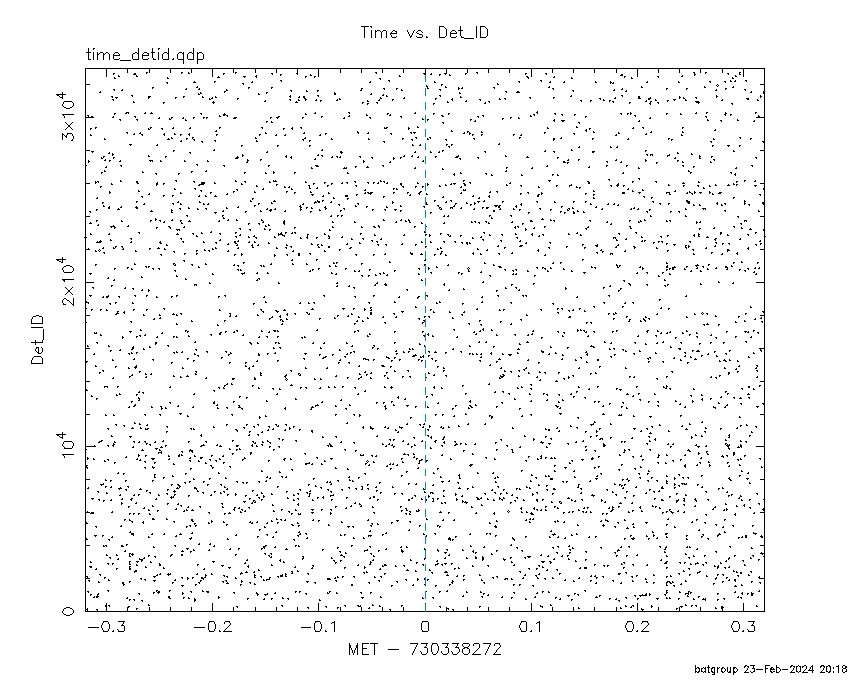
Blue+Cyan dotted lines: Time interval of the scaled map
From 0.000000 to 64.000000
100 us light curve (15-350 keV)

Blue+Cyan dotted lines: Time interval of the scaled map
From 0.000000 to 64.000000
Spacecraft aspect plot

Bright source in the pre-burst/pre-slew/post-slew images
Pre-burst image of 15-350 keV band
Time interval of the image:
-119.000000 -23.150000
-20.000000 134.480000

# RAcent  DECcent POSerr Theta    Phi  PeakCts   SNR AngSep     Name
#  [deg]    [deg]    ['] [deg]  [deg]                   [']
244.9941 -15.6441  313.3   0.3  101.9   0.0141   0.0    0.9	Sco X-1
254.3820  35.5037    9.8  52.0  179.8   1.3320   1.2   10.4	Her X-1
256.1804 -37.7508    7.3  24.0  -31.3  -0.7026  -1.6   10.8	4U 1700-377
256.5381 -36.5732   11.0  23.1  -33.3  -0.4571  -1.0   10.3	GX 349+2
262.9581 -24.6866    5.5  18.8  -68.5  -0.9205  -2.1    4.5	GX 1+4
264.8804 -44.2984    7.9  33.0  -35.8  -0.7608  -1.5   10.8	4U 1735-44
268.5035  -1.6173    0.0  26.9 -129.0   0.7447   1.5   12.8	SW J1753.5-0127
270.1178 -25.1189    7.6  25.1  -73.7  -0.7654  -1.5    9.3	GX 5-1
270.1416 -25.6859   10.2  25.3  -72.4   0.6036   1.2    9.3	GRS 1758-258
273.8522 -14.0064    4.2  27.7  -99.4  -1.5267  -2.7    9.1	GX 17+2
276.0963 -30.2188    8.4  31.7  -67.1  -0.8057  -1.4   12.6	H1820-303
284.9004 -24.8287   20.6  38.1  -79.3   0.5964   0.6    9.2	HT1900.1-2455
263.1583 -33.8872    9.1  24.3  -48.0   0.5929   1.3    9.0	GX 354-0
Pre-slew background subtracted image of 15-350 keV band
Time interval of the image:
134.480000 136.212200
164.000000 164.876000

# RAcent  DECcent POSerr Theta    Phi  PeakCts   SNR AngSep     Name
#  [deg]    [deg]    ['] [deg]  [deg]                   [']
245.1189 -15.7449    5.5   0.1   78.9  -0.0393  -2.1   10.2	Sco X-1
254.3397  35.3353    6.2  51.8  179.8   0.0978   1.8    5.8	Her X-1
255.7936 -37.9301   78.2  24.1  -30.4   0.0028   0.1   10.5	4U 1700-377
256.3290 -36.3696   13.3  22.9  -33.1   0.0163   0.9    6.1	GX 349+2
263.1678 -24.8125    5.7  19.1  -68.4  -0.0423  -2.0    9.5	GX 1+4
264.6172 -44.5238    6.7  33.1  -35.3  -0.0437  -1.7    7.0	4U 1735-44
268.3360  -1.5898    5.3  26.8 -129.3   0.0514   2.2    8.5	SW J1753.5-0127
270.3227 -24.9585    6.6  25.2  -74.1   0.0440   1.7    7.5	GX 5-1
270.4621 -25.8769    0.0  25.6  -72.2   0.0347   1.4   11.8	GRS 1758-258
273.8491 -14.1611    0.0  27.7  -99.1  -0.0444  -1.5   11.8	GX 17+2
275.8572 -30.4353    5.8  31.6  -66.6   0.0599   2.0    5.4	H1820-303
284.9714 -25.0432  223.9  38.2  -79.0   0.0034   0.1    8.2	HT1900.1-2455
263.1604 -33.8656    7.7  24.3  -48.1  -0.0322  -1.5    8.7	GX 354-0
Post-slew image of 15-350 keV band
Time interval of the image:
Plot creation:
Fri Feb 23 20:18:29 EST 2024