Estimated redshift from machine learning (Ukwatta et al. 2016) - may take a few minutes to calcaulte
Image
Pre-slew 15-350 keV image (Event data; bkg subtracted)
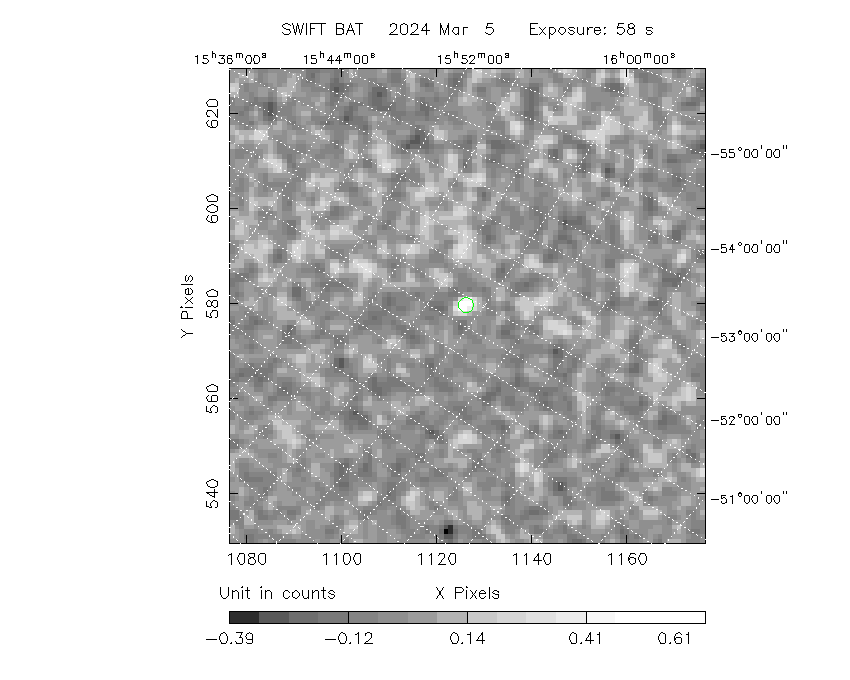
#   RAcent  DECcent POSerr  Theta    Phi     Peak Cts     SNR  Name
  229.7111 -57.3288 0.0235   29.3 -157.3       0.8057     8.2  TRIG_01218701
------------------------------------------

Foreground time interval of the image:
  0.000  32.000 (delta_t =  32.000 [sec])
 32.000  53.790 (delta_t =  21.790 [sec])
 55.000  56.190 (delta_t =   1.190 [sec])
 61.000  64.000 (delta_t =   3.000 [sec])
Background time interval of the image:
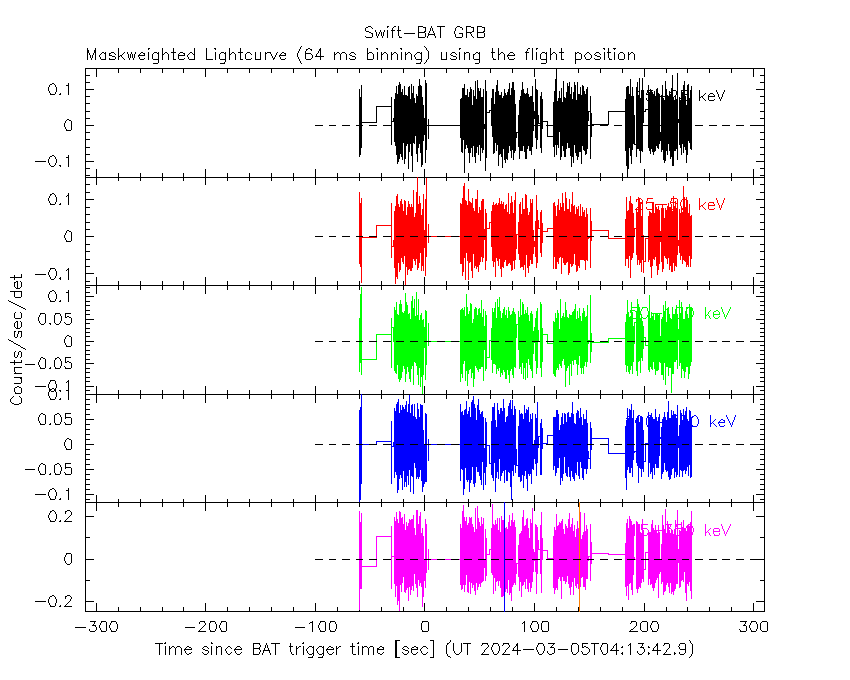
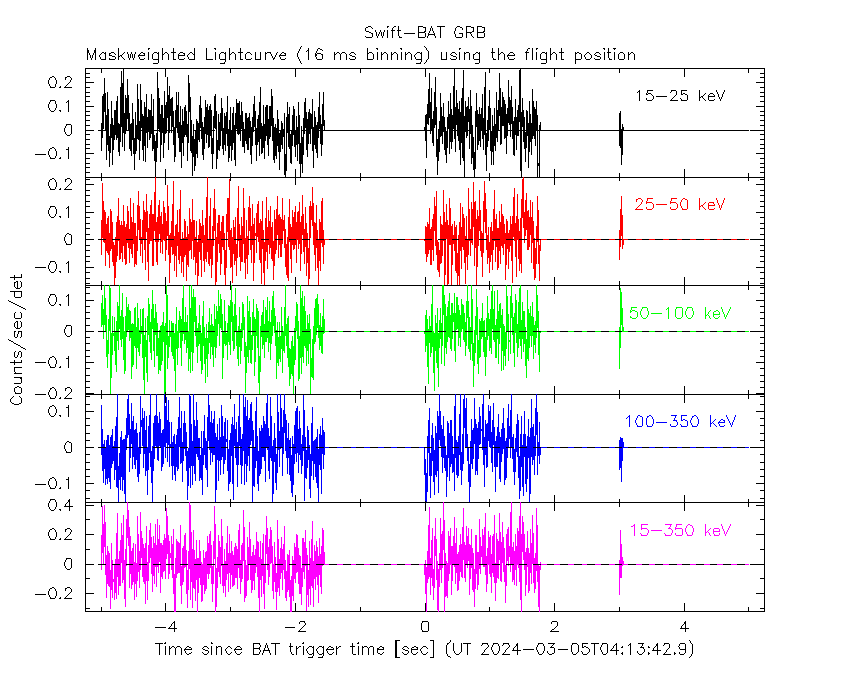
Lightcurves
Notes:
- 1) All plots contain as much data as has been downloaded to date.
- 2) The mask-weighted light curves are using the flight position.
- 3) Multiple plots of different time binning/intervals are shown to cover all scenarios of short/long GRBs, rate/image triggers, and real/false positives.
- 4) For all the mask-weighted lightcurves, the y-axis units are counts/sec/det where a det is 0.4 x 0.4 = 0.16 sq cm.
- 5) The verticle lines correspond to following: green dotted lines are T50 interval, black dotted lines are T90 interval, blue solid line(s) is a spacecraft slew start time, and orange solid line(s) is a spacecraft slew end time.
- 6) Time of each bin is in the middle of the bin.
1 s binning
From T0-310 s to T0+310 s

From T100_start - 20 s to T100_end + 30 s

Full time interval

64 ms binning
Full time interval
From T100_start to T100_end
From T0-5 sec to T0+5 sec

16 ms binning
From T100_start-5 s to T100_start+5 s
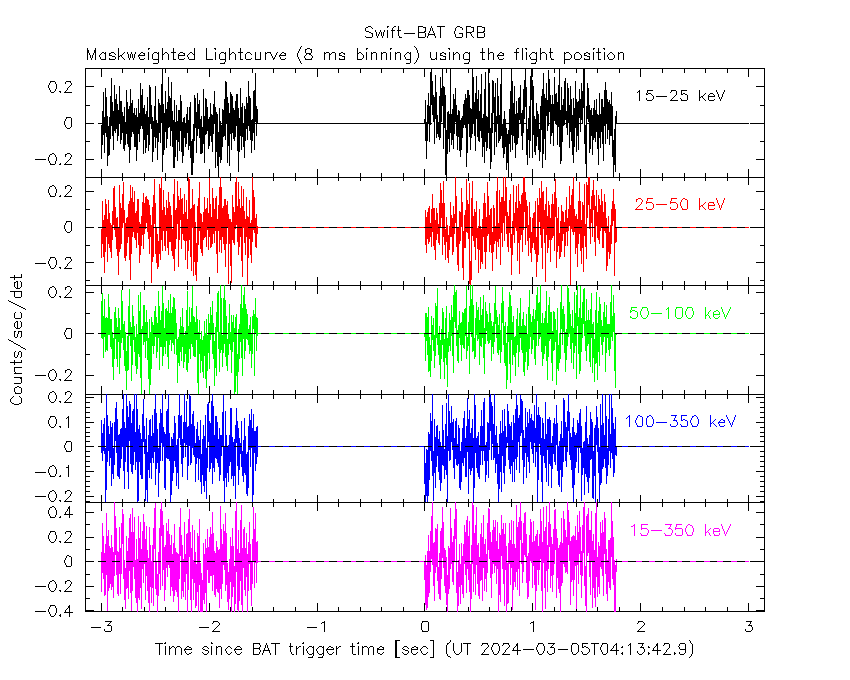
8 ms binning
From T100_start-3 s to T100_start+3 s
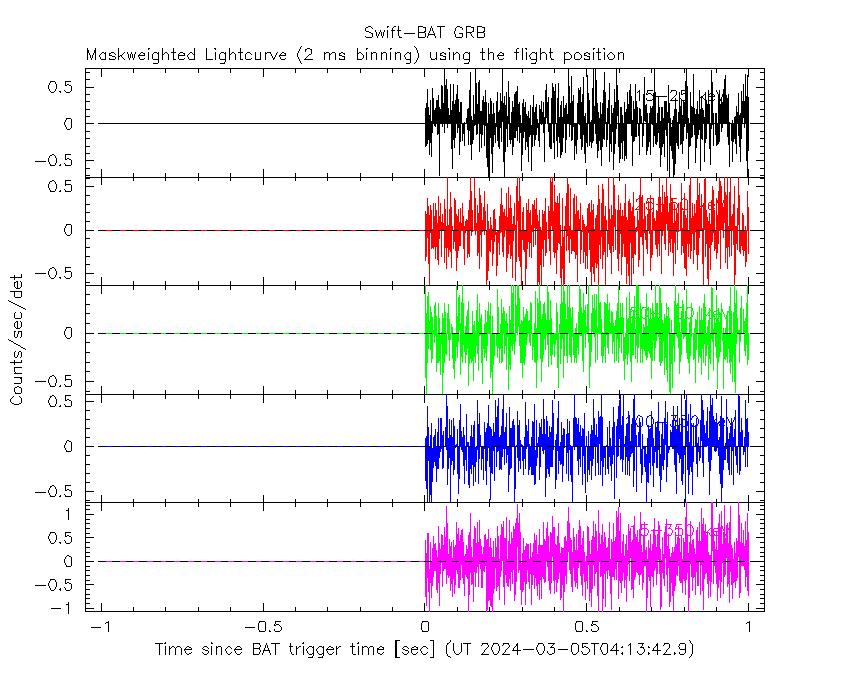
2 ms binning
From T100_start-1 s to T100_start+1 s
SN=5 or 10 sec. binning (whichever binning is satisfied first)
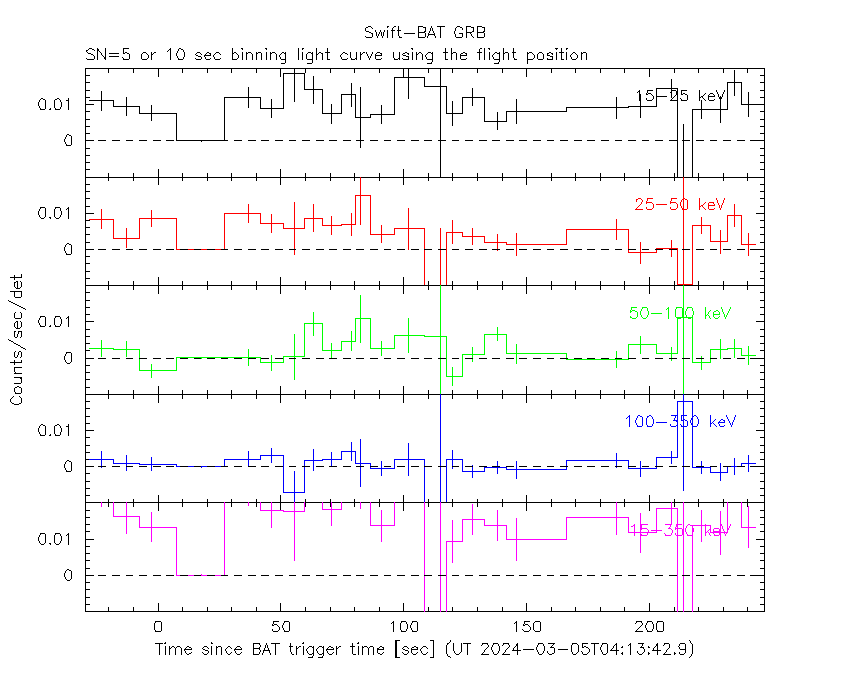
SN=5 or 10 sec. binning (T < 200 sec)

Spectra
Notes:
- 1) The fitting includes the systematic errors.
- 2) For long bursts, a spectral fit of the pre-slew DRM will introduce some errors in both a spectral shape and a normalization if the PHA file contains a lot of the slew/post-slew time interval.
- 3) For fits to more complicated models (e.g. a power-law over a cutoff power-law), the BAT team has decided to require a chi-square improvement of more than 6 for each extra dof.
- 4) For short bursts (T90<1sec), the specrtum is also fit with Blackbody, OTTB, and Double Blackbody.
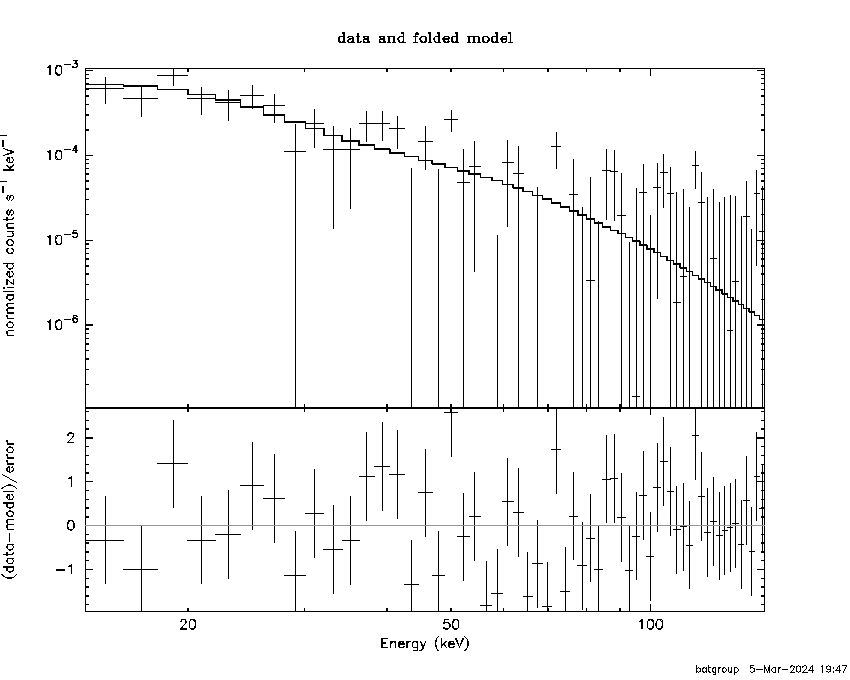
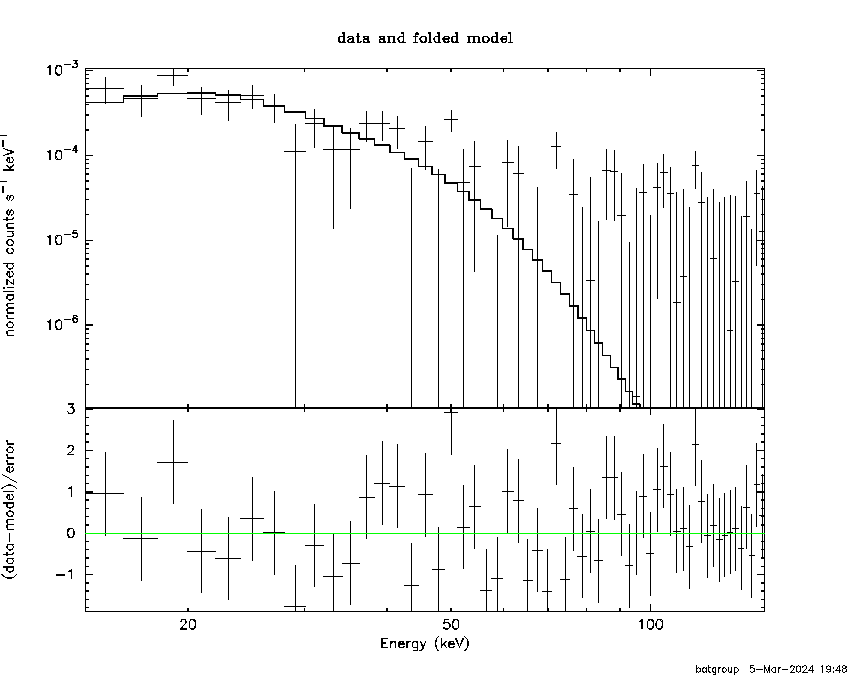
Time averaged spectrum fit using the pre-slew DRM
Power-law model
Multiple GTIs in the spectrum
tstart tstop
0.000000 32.000000
32.000000 53.790000
55.000000 56.190000
61.000000 64.000000

Spectral model in power-law:
------------------------------------------------------------
Parameters  : value       lower 90%   higher 90%
Photon index: 2.57936     ( -0.372339   0.433218 )
Norm@50keV  : 5.03589E-04    ( -0.000158375   0.000160356 )
------------------------------------------------------------
#Fit statistic : Chi-Squared =          56.26 using 59 PHA bins.
# Reduced chi-squared =         0.9870 for     57 degrees of freedom
# Null hypothesis probability =   5.027553e-01

Photon flux (15-150 keV)    in 57.98 sec: 0.103941 ( -0.0180529  0.0180625 ) ph/cm2/s
Energy fluence (15-150 keV)             : 2.98653e-07 ( -6.58119e-08  7.01726e-08 ) ergs/cm2
Cutoff power-law model

Multiple GTIs in the spectrum
tstart tstop
0.000000 32.000000
32.000000 53.790000
55.000000 56.190000
61.000000 64.000000
Spectral model in the cutoff power-law:
------------------------------------------------------------
Parameters  : value       lower 90%   higher 90%
Photon index: 1.16899     ( -2.87207   0.829449 )
Epeak [keV] : 18.4398      (   )
Norm@50keV  : 4.60253E-03    (     )
------------------------------------------------------------
#Fit statistic : Chi-Squared =          55.39 using 59 PHA bins.
# Reduced chi-squared =         0.9891 for     56 degrees of freedom
# Null hypothesis probability =   4.979515e-01

Photon flux (15-150 keV)    in 57.98 sec: 0.100737 ( -0.0179099  0.017508 ) ph/cm2/s
Energy fluence (15-150 keV)             : 2.60095e-07 ( -5.77904e-08  9.55047e-08 ) ergs/cm2
Band function

Multiple GTIs in the spectrum
tstart tstop
0.000000 32.000000
32.000000 53.790000
55.000000 56.190000
61.000000 64.000000

Spectral model in the Band function:
------------------------------------------------------------
Parameters  : value       lower 90%   higher 90%
alpha       : -1.32221   ( 1.32249   1.32249 )
beta        : -3.50903    ( 3.52489   1.22987 )
Epeak [keV] : 17.0656      ( -16.9988 9.17675 )
Norm@50keV   : 3.57532E-03    ( -0.0017891   312.635 )
------------------------------------------------------------
#Fit statistic : Chi-Squared =          55.11 using 59 PHA bins.
# Reduced chi-squared =          1.002 for     55 degrees of freedom
# Null hypothesis probability =   4.704750e-01

Photon flux (15-150 keV)    in 57.98 sec:  (    ) ph/cm2/s
Energy fluence (15-150 keV)             : 0 ( 0  0 ) ergs/cm2
Single BB
Spectral model blackbody:
------------------------------------------------------------
Parameters  : value    Lower 90%  Upper 90%
kT [keV]    : 6.72541  (-1.20427  1.36594)
R^2/D10^2   : 0.234819  (-0.12731   0.309771)
(R is the radius in km and D10 is the distance to the source in units of 10 kpc)
------------------------------------------------------------
#Fit statistic : Chi-Squared =          58.07 using 59 PHA bins.
# Reduced chi-squared =          1.019 for     57 degrees of freedom
# Null hypothesis probability =   4.354932e-01

Energy  Fluence     90% Error
[keV]   [erg/cm2]   [erg/cm2]
15- 25  9.472e-08   2.977e-08
25- 50  1.199e-07   4.223e-08
50-150  1.715e-08   1.024e-08
15-150  2.318e-07   6.126e-08
Thermal bremsstrahlung (OTTB)
XSPEC12>exit
 XSPEC: quit


Spectral model: thermal bremsstrahlung
------------------------------------------------------------
Parameters  : value         Lower 90%    Upper 90%
kT [keV]    : 26.4657       (-8.65956      14.8996)
Norm        : 0.937044       (-0.310276     0.509087)
------------------------------------------------------------
 Reduced chi-squared =

Energy  Fluence     90% Error
[keV]   [erg/cm2]   [erg/cm2]
15- 25  1.031e-07   2.421e-08
25- 50  1.095e-07   3.027e-08
50-150  5.056e-08   3.166e-08
15-150  2.632e-07   7.300e-08
Double BB

XSPEC12>exit
 XSPEC: quit


Spectral model: bbodyrad<1> + bbodyrad<2>
------------------------------------------------------------
Parameters  : value         Lower 90%    Upper 90%
kT1 [keV]   : 3.16688        (-2.9477      -3.19797)
R1^2/D10^2  : 3.24141        (-3.0722      -3.18513)
kT2 [keV]   : 8.60992        (-2.3141      -8.63544)
R2^2/D10^2  : 6.50741E-02    (-0.0637377   0.227688)
------------------------------------------------------------
 Reduced chi-squared =

Energy  Fluence     90% Error
[keV]   [erg/cm2]   [erg/cm2]
15- 25  1.019e-07   5.120e-08
25- 50  1.138e-07   6.227e-08
50-150  3.501e-08   2.399e-08
15-150  2.507e-07   1.303e-07
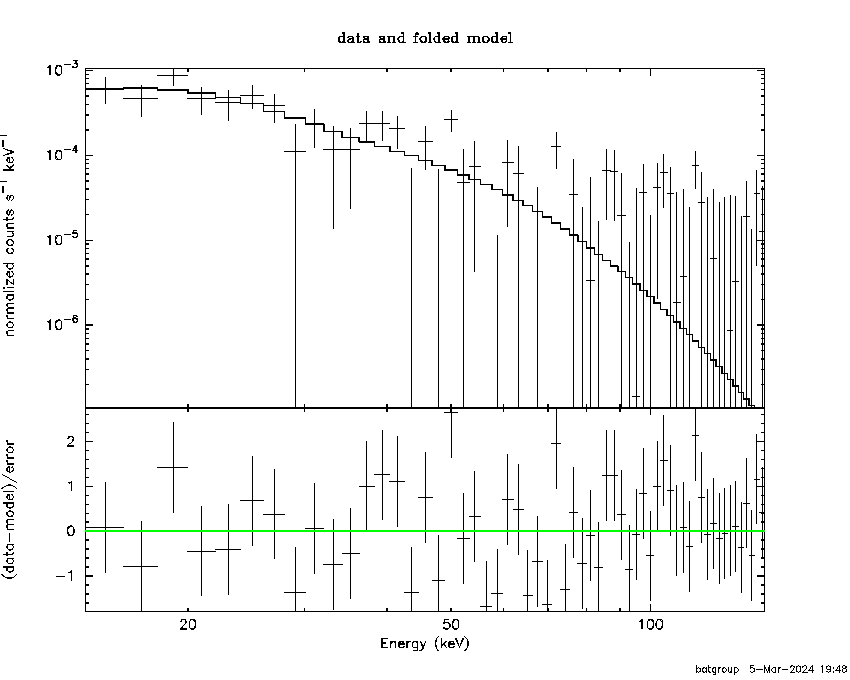
Peak spectrum fit
Power-law model

Time interval is from   61.000 sec. to   64.000 sec.

Spectral model in power-law:
------------------------------------------------------------
Parameters  : value       lower 90%   higher 90%
Photon index: 2.57936     ( -0.372339   0.433218 )
Norm@50keV  : 5.03589E-04    ( -0.000158375   0.000160356 )
------------------------------------------------------------
#Fit statistic : Chi-Squared =          56.26 using 59 PHA bins.
# Reduced chi-squared =         0.9870 for     57 degrees of freedom
# Null hypothesis probability =   5.027553e-01

Photon flux (15-150 keV)    in 57.98 sec: 0.103941 ( -0.0180529  0.0180625 ) ph/cm2/s
Energy fluence (15-150 keV)             : 2.98653e-07 ( -6.58119e-08  7.01726e-08 ) ergs/cm2
Cutoff power-law model

Time interval is from   61.000 sec. to   64.000 sec.
Spectral model in the cutoff power-law:
------------------------------------------------------------
Parameters  : value       lower 90%   higher 90%
Photon index: 1.16899     ( -2.87207   0.829449 )
Epeak [keV] : 18.4398      (   )
Norm@50keV  : 4.60253E-03    (     )
------------------------------------------------------------
#Fit statistic : Chi-Squared =          55.39 using 59 PHA bins.
# Reduced chi-squared =         0.9891 for     56 degrees of freedom
# Null hypothesis probability =   4.979515e-01

Photon flux (15-150 keV)    in 57.98 sec: 0.100737 ( -0.0179099  0.017508 ) ph/cm2/s
Energy fluence (15-150 keV)             : 2.60095e-07 ( -5.77904e-08  9.55047e-08 ) ergs/cm2
Band function
Time interval is from   61.000 sec. to   64.000 sec.

Spectral model in the Band function:
------------------------------------------------------------
Parameters  : value       lower 90%   higher 90%
alpha       : -1.32221   ( 1.32249   1.32249 )
beta        : -3.50903    ( 3.52489   1.22987 )
Epeak [keV] : 17.0656      ( -16.9988 9.17675 )
Norm@50keV   : 3.57532E-03    ( -0.0017891   312.637 )
------------------------------------------------------------
#Fit statistic : Chi-Squared =          55.11 using 59 PHA bins.
# Reduced chi-squared =          1.002 for     55 degrees of freedom
# Null hypothesis probability =   4.704750e-01

Photon flux (15-150 keV)    in 57.98 sec:  (    ) ph/cm2/s
Energy fluence (15-150 keV)             : 0 ( 0  0 ) ergs/cm2
Single BB

 XSPEC: quit


Spectral model blackbody:
------------------------------------------------------------
Parameters  : value    Lower 90%  Upper 90%
kT [keV]    : 6.72541  (-1.20427  1.36594)
R^2/D10^2   : 0.234819  (-0.12731   0.309771)
(R is the radius in km and D10 is the distance to the source in units of 10 kpc)
------------------------------------------------------------
 Reduced chi-squared =

Energy  Fluence     90% Error
[keV]   [erg/cm2]   [erg/cm2]
15- 25  9.472e-08   2.850e-08
25- 50  1.199e-07   4.236e-08
50-150  1.715e-08   1.088e-08
15-150  2.318e-07   6.444e-08
Thermal bremsstrahlung (OTTB)

XSPEC12>exit
 XSPEC: quit


Spectral model: thermal bremsstrahlung
------------------------------------------------------------
Parameters  : value         Lower 90%    Upper 90%
kT [keV]    : 26.4657       (-8.65956      14.8996)
Norm        : 0.937044       (-0.310276     0.509087)
------------------------------------------------------------
 Reduced chi-squared =

Energy  Fluence     90% Error
[keV]   [erg/cm2]   [erg/cm2]
15- 25  1.031e-07   2.438e-08
25- 50  1.095e-07   2.951e-08
50-150  5.056e-08   3.040e-08
15-150  2.632e-07   7.627e-08
Double BB
XSPEC12>exit
 XSPEC: quit


Spectral model: bbodyrad<1> + bbodyrad<2>
------------------------------------------------------------
Parameters  : value         Lower 90%    Upper 90%
kT1 [keV]   : 3.16688        (-3.19699      -3.19797)
R1^2/D10^2  : 3.24141        (-3.0722      -3.18513)
kT2 [keV]   : 8.60992        (-2.3141      -8.63544)
R2^2/D10^2  : 6.50741E-02    (-0.0637377   0.227688)
------------------------------------------------------------
 Reduced chi-squared =

Energy  Fluence     90% Error
[keV]   [erg/cm2]   [erg/cm2]
15- 25  1.019e-07   5.210e-08
25- 50  1.138e-07   6.181e-08
50-150  3.501e-08   2.498e-08
15-150  2.507e-07   1.325e-07
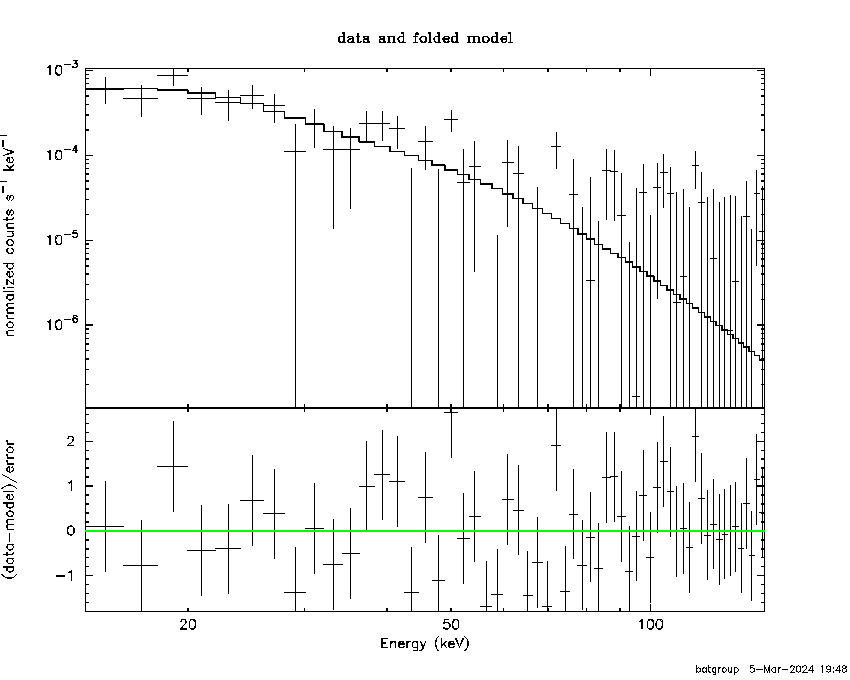
Pre-slew spectrum (Pre-slew PHA with pre-slew DRM)
Power-law model

Spectral model in power-law:
------------------------------------------------------------
Parameters  : value       lower 90%   higher 90%
Photon index: 2.57936     ( -0.372339   0.433218 )
Norm@50keV  : 5.03589E-04    ( -0.000158375   0.000160356 )
------------------------------------------------------------
#Fit statistic : Chi-Squared =          56.26 using 59 PHA bins.
# Reduced chi-squared =         0.9870 for     57 degrees of freedom
# Null hypothesis probability =   5.027553e-01

Photon flux (15-150 keV)    in 57.98 sec: 0.103941 ( -0.0180529  0.0180625 ) ph/cm2/s
Energy fluence (15-150 keV)             : 2.98653e-07 ( -6.58119e-08  7.01726e-08 ) ergs/cm2
Cutoff power-law model

Spectral model in the cutoff power-law:
------------------------------------------------------------
Parameters  : value       lower 90%   higher 90%
Photon index: 1.16899     ( -2.87207   0.829449 )
Epeak [keV] : 18.4398      (   )
Norm@50keV  : 4.60253E-03    (     )
------------------------------------------------------------
#Fit statistic : Chi-Squared =          55.39 using 59 PHA bins.
# Reduced chi-squared =         0.9891 for     56 degrees of freedom
# Null hypothesis probability =   4.979515e-01

Photon flux (15-150 keV)    in 57.98 sec: 0.100737 ( -0.0179099  0.017507 ) ph/cm2/s
Energy fluence (15-150 keV)             : 2.60095e-07 ( -5.77904e-08  9.55047e-08 ) ergs/cm2
Band function

Spectral model in the Band function:
------------------------------------------------------------
Parameters  : value       lower 90%   higher 90%
alpha       : -1.32221   ( 1.32249   1.32249 )
beta        : -3.50903    ( 3.52489   1.22987 )
Epeak [keV] : 17.0656      ( -16.9988 9.17675 )
Norm@50keV   : 3.57532E-03    ( -0.0017891   312.608 )
------------------------------------------------------------
#Fit statistic : Chi-Squared =          55.11 using 59 PHA bins.
# Reduced chi-squared =          1.002 for     55 degrees of freedom
# Null hypothesis probability =   4.704750e-01

Photon flux (15-150 keV)    in 57.98 sec:  (    ) ph/cm2/s
Energy fluence (15-150 keV)             : 0 ( 0  0 ) ergs/cm2
S(25-50 keV) vs. S(50-100 keV) plot

S(25-50 keV)  = 9.97e-08
S(50-100 keV) = 6.68e-08
T90 vs. Hardness ratio plot

T90                                   = 64 sec.
Hardness ratio (energy fluence ratio) = 0.67001
Color vs. Color plot

Count Ratio  (25-50 keV) / (15-25 keV) = 0.8384
Count Ratio (50-100 keV) / (15-25 keV) = 0.112405
Mask shadow pattern

IMX = -5.179702671674051E-01, IMY = 2.165537824673080E-01
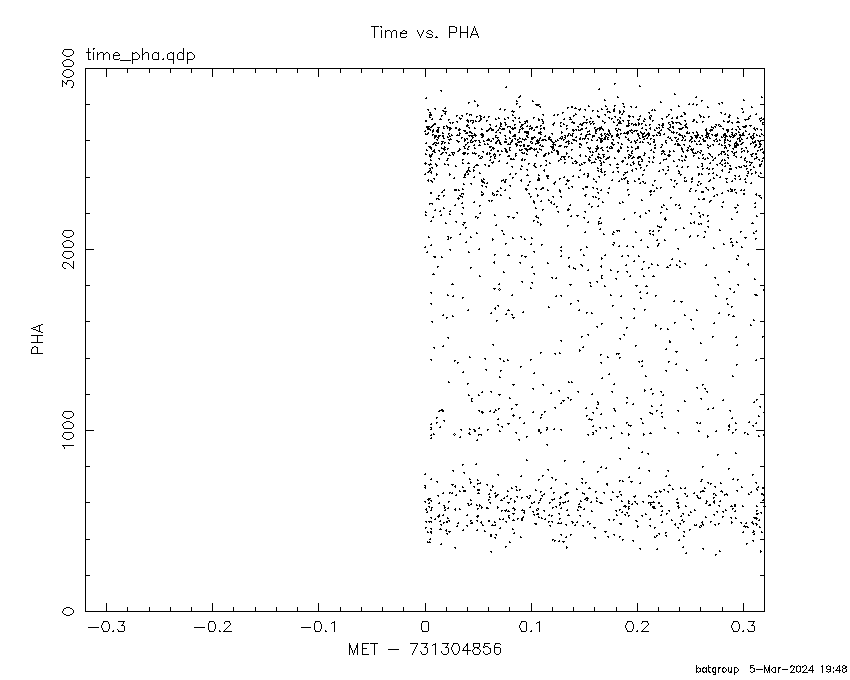
TIME vs. PHA plot around the trigger time
TIME vs. DetID plot around the trigger time

100 us light curve (15-350 keV)

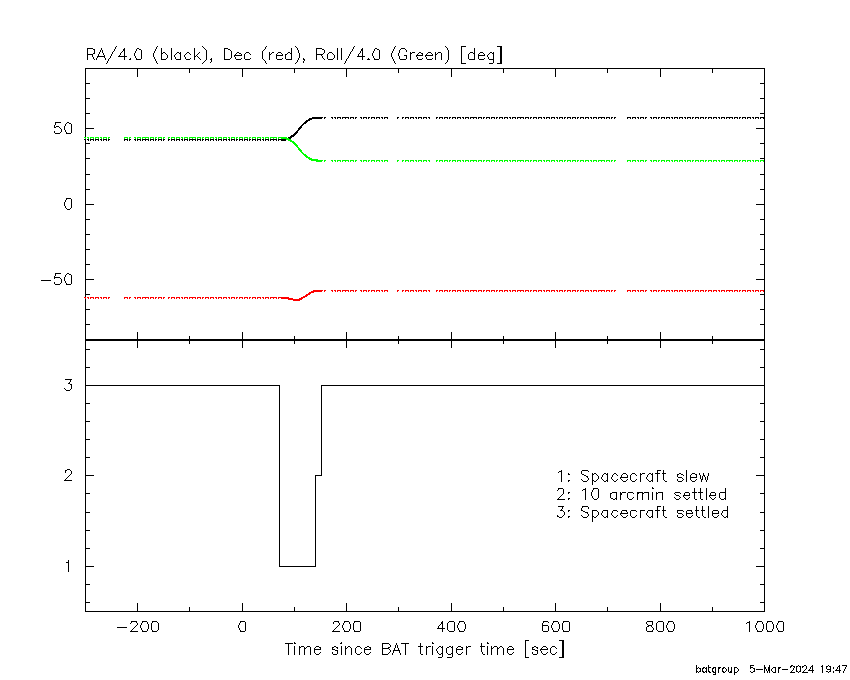
Spacecraft aspect plot
Bright source in the pre-burst/pre-slew/post-slew images
Pre-burst image of 15-350 keV band
Time interval of the image:
Pre-slew background subtracted image of 15-350 keV band
Time interval of the image:
0.000000 32.000000
32.000000 53.790000
55.000000 56.190000
61.000000 64.000000

# RAcent  DECcent POSerr Theta    Phi  PeakCts   SNR AngSep     Name
#  [deg]    [deg]    ['] [deg]  [deg]                   [']
135.4826 -40.6858    6.9  29.8   34.0   0.1757   1.7    8.1	Vela X-1
169.9905 -60.5000    3.6   1.5   90.1   0.2693   3.2   12.1	Cen X-3
186.5789 -62.7990    1.1   7.6 -162.4   0.8068  10.2    2.7	GX 301-2
255.9551 -37.8729   11.4  55.3 -158.8  -0.3712  -1.0    2.3	4U 1700-377
256.5114 -36.4914    9.4  56.7 -159.3  -0.4874  -1.2    5.5	GX 349+2
264.9087 -44.6209    3.7  53.6 -147.3   1.2329   3.1   12.5	4U 1735-44
203.6859 -29.7765    2.4  38.9  144.1   0.7904   4.8 ------	UNKNOWN
 95.6489 -29.8467    2.4  56.8    2.4   2.2876   4.9 ------	UNKNOWN
161.9623 -62.2822    2.2   3.9   -3.1   0.4330   5.3 ------	UNKNOWN
229.7109 -57.3289    1.4  29.3 -157.3   0.8059   8.2 ------	UNKNOWN
257.1731 -59.8169    2.6  39.1 -138.2   0.6071   4.4 ------	UNKNOWN
 65.4781 -65.9628    2.3  40.7  -48.4   0.8706   5.1 ------	UNKNOWN
Post-slew image of 15-350 keV band
Time interval of the image:
140.900620 148.400000
151.000000 151.630000
183.000000 190.230000
191.000000 191.020000
193.000000 199.110000
200.000000 200.060000
204.000000 214.043800
216.000000 230.870000
232.000000 243.052900

# RAcent  DECcent POSerr Theta    Phi  PeakCts   SNR AngSep     Name
#  [deg]    [deg]    ['] [deg]  [deg]                   [']
170.3966 -60.4947    5.9  29.7   33.1   0.3818   1.9    8.1	Cen X-3
186.6727 -62.7709    1.0  21.7   32.1   1.7458  11.2    0.4	GX 301-2
244.9374 -15.6429    1.4  43.3  176.1   2.2303   8.5    2.4	Sco X-1
255.9110 -37.8044    2.6  26.0 -153.0   0.6453   4.5    4.3	4U 1700-377
256.6127 -36.2951    0.0  27.6 -153.7   0.2876   1.8   11.5	GX 349+2
263.1022 -24.7648    6.8  40.4 -155.1   0.3785   1.7    5.2	GX 1+4
264.5403 -44.4481    5.1  25.1 -131.5   0.3584   2.3    8.7	4U 1735-44
270.2338 -25.0684    2.5  43.3 -146.4   1.2439   4.6    2.8	GX 5-1
270.1277 -25.5908    4.4  42.8 -146.2  -0.6782  -2.6   13.1	GRS 1758-258
274.0597 -14.1424    9.7  54.6 -149.3   0.7479   1.2    7.1	GX 17+2
276.0038 -30.3931    3.3  41.6 -135.8   0.9496   3.5    4.4	H1820-303
262.8690 -33.8898    4.4  32.4 -147.7   0.4913   2.6    6.8	GX 354-0
229.8457 -57.3753    1.9   0.1 -105.6   0.8711   6.2 ------	UNKNOWN
 35.5355 -66.9836    1.9  55.2  -32.3   4.6513   6.1 ------	UNKNOWN
Plot creation:
Tue Mar  5 19:49:01 EST 2024