Estimated redshift from machine learning (Ukwatta et al. 2016) - may take a few minutes to calcaulte
Image
Pre-slew 15-350 keV image (Event data; bkg subtracted)
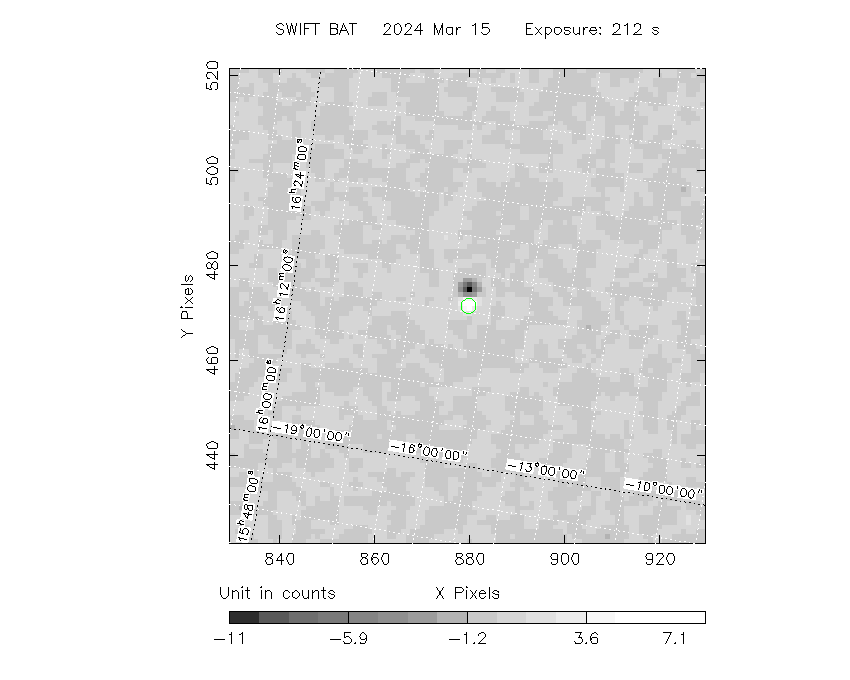
#   RAcent  DECcent POSerr  Theta    Phi     Peak Cts     SNR  Name
  243.1668 -15.5447 0.0073    0.6   90.8       9.6814    26.3  TRIG_01220158
------------------------------------------

Foreground time interval of the image:
-140.556 -78.900 (delta_t =  61.656 [sec])
-78.000  72.301 (delta_t = 150.301 [sec])
Background time interval of the image:
-239.000 -143.200 (delta_t =  95.800 [sec])
-142.000 -140.556 (delta_t =   1.444 [sec])
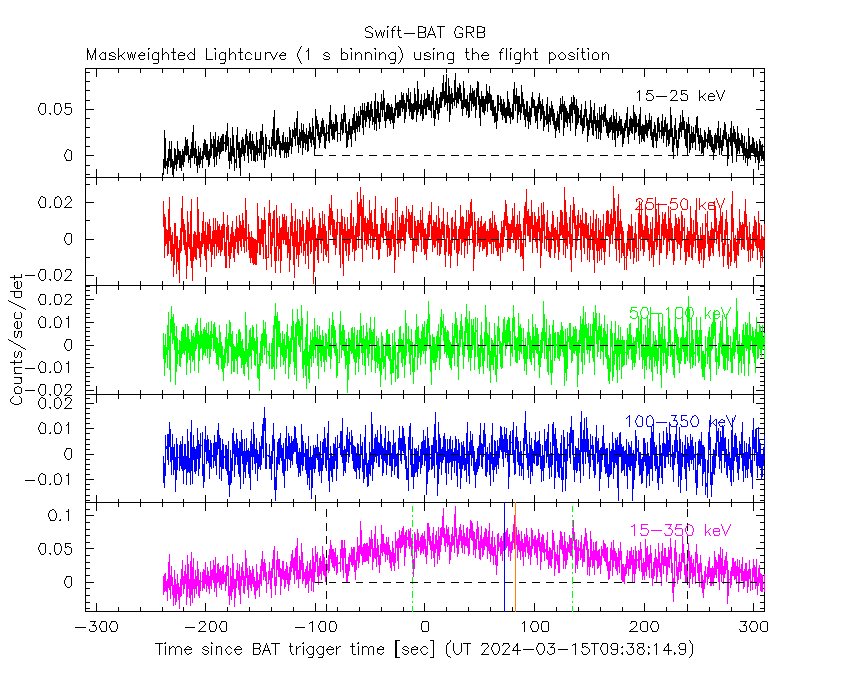
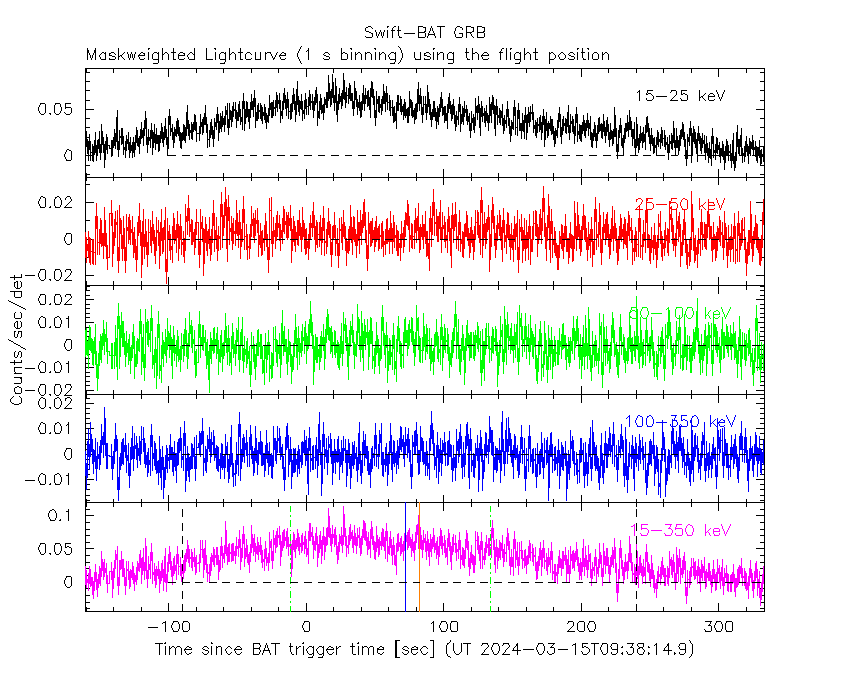
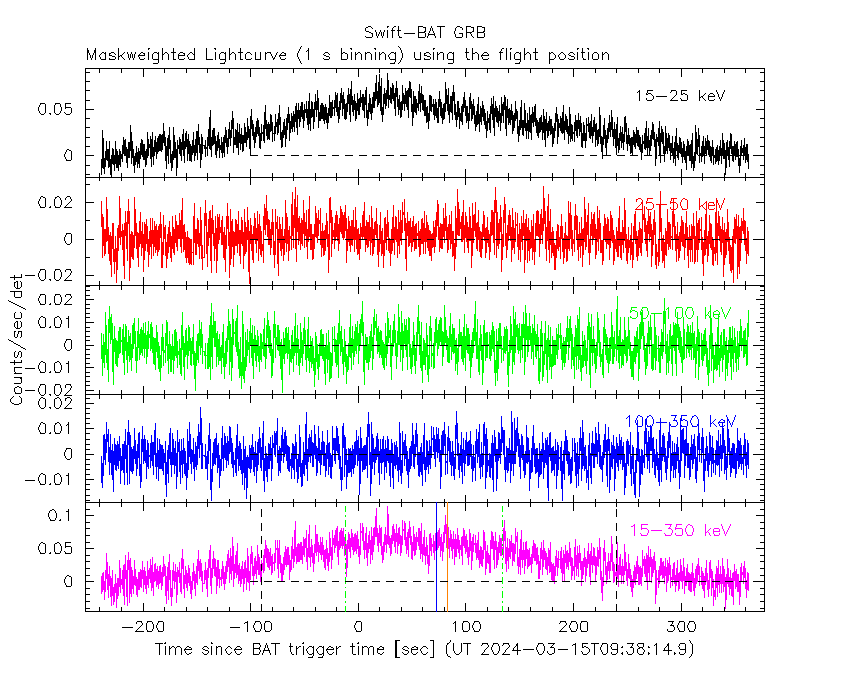
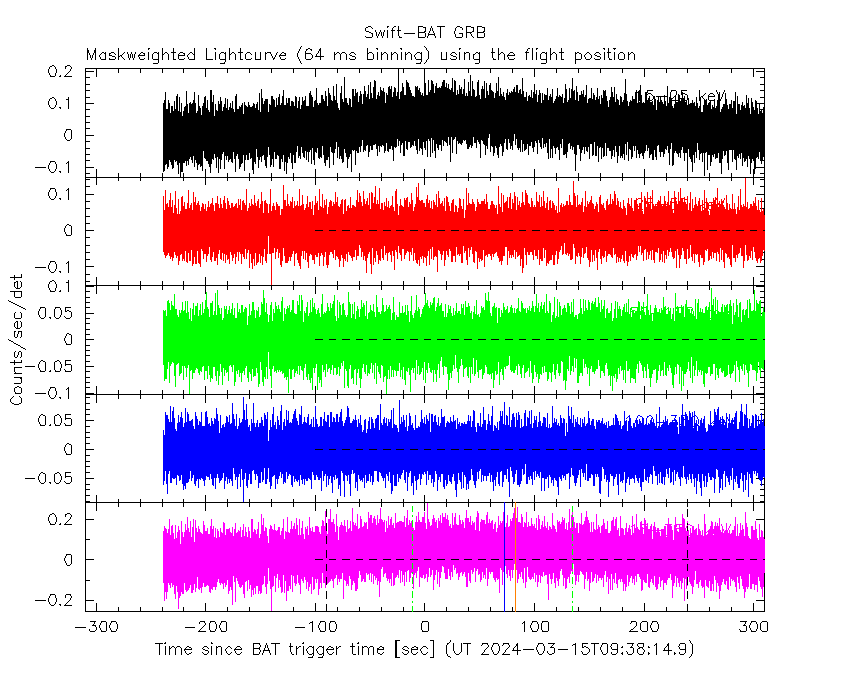
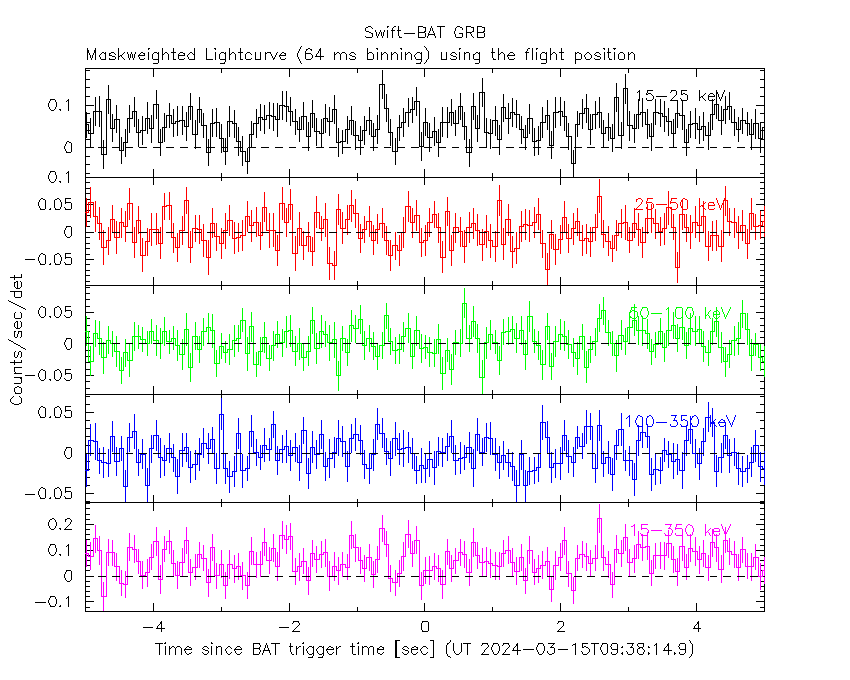
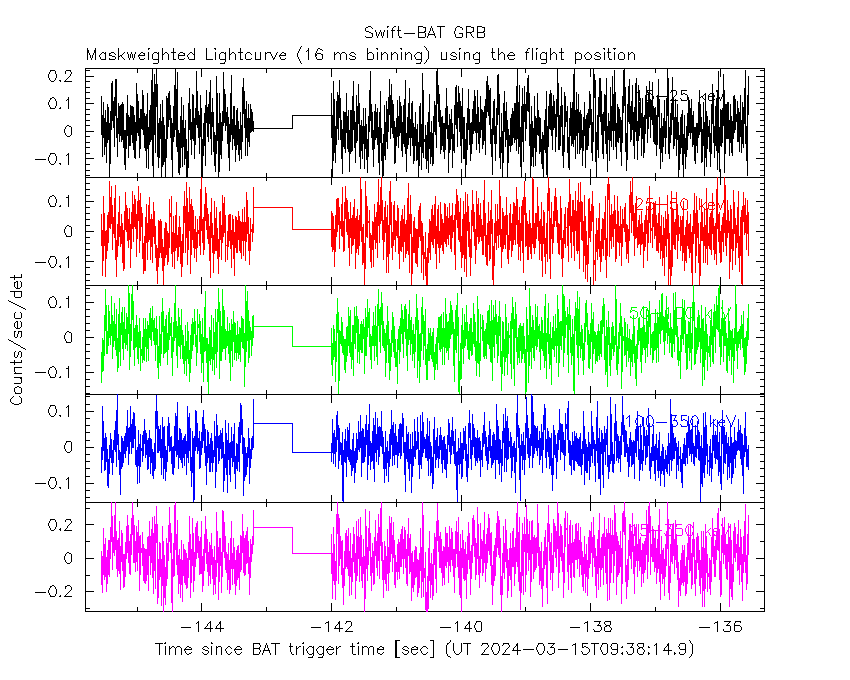
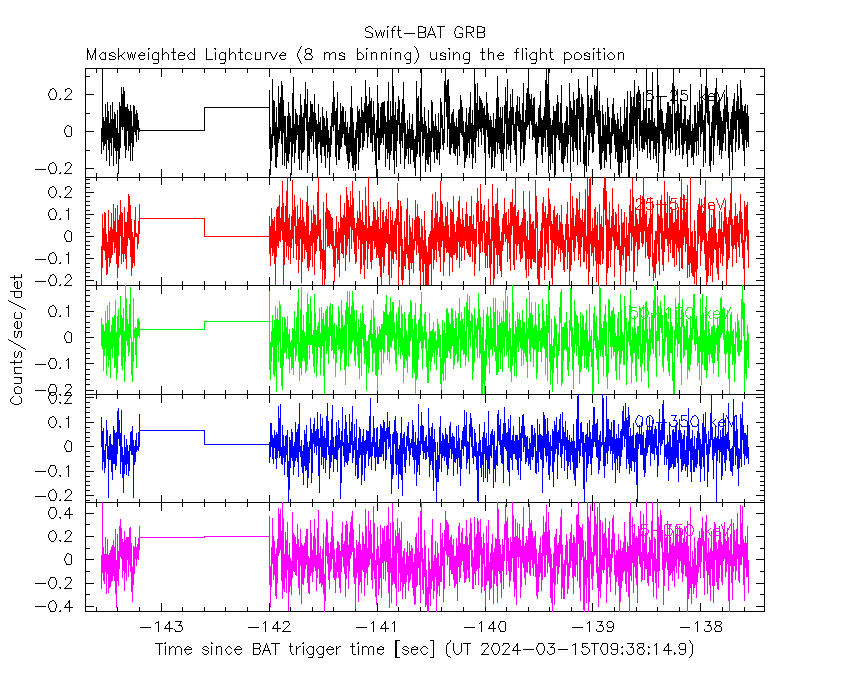
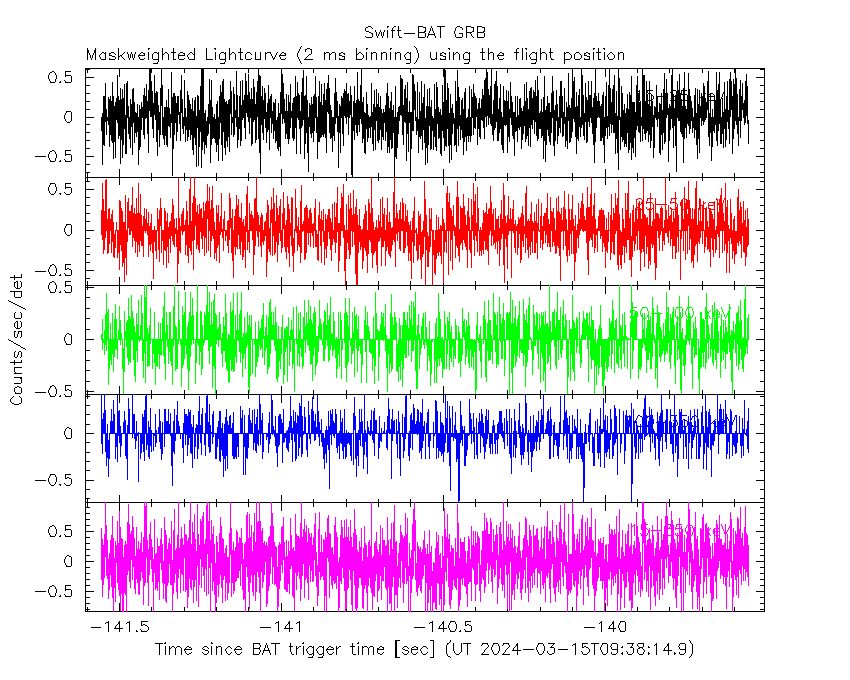
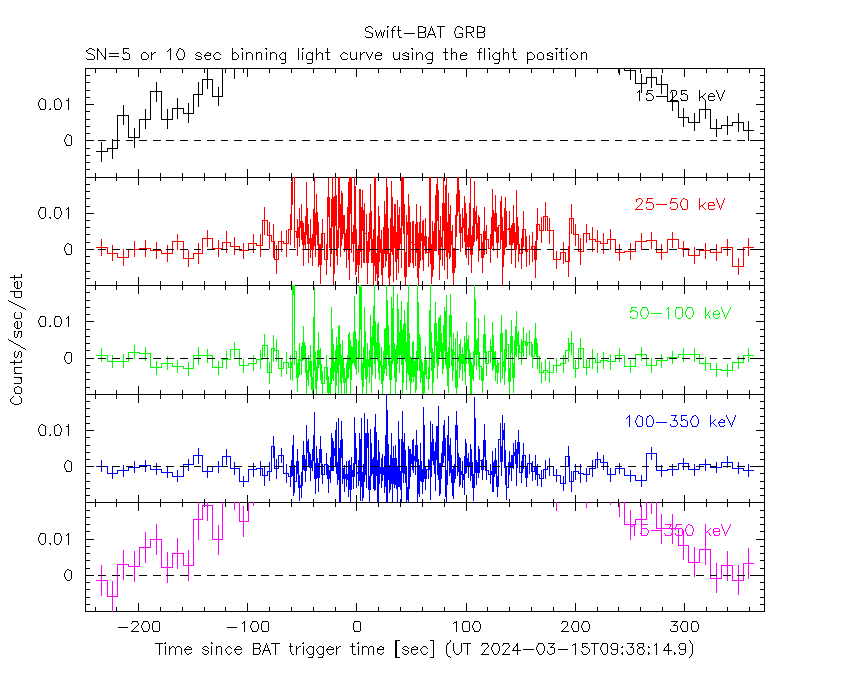
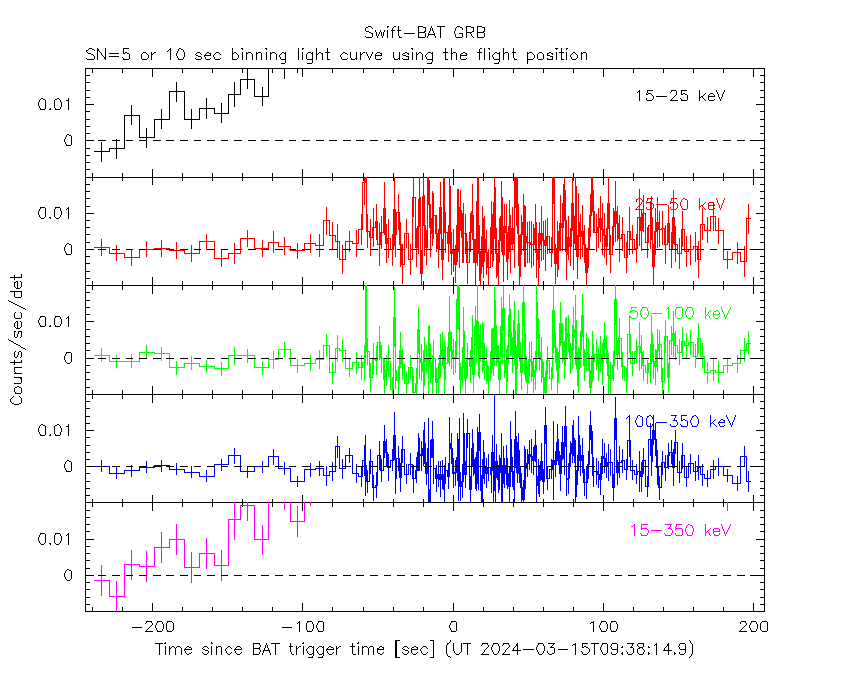
Lightcurves
Notes:
- 1) All plots contain as much data as has been downloaded to date.
- 2) The mask-weighted light curves are using the flight position.
- 3) Multiple plots of different time binning/intervals are shown to cover all scenarios of short/long GRBs, rate/image triggers, and real/false positives.
- 4) For all the mask-weighted lightcurves, the y-axis units are counts/sec/det where a det is 0.4 x 0.4 = 0.16 sq cm.
- 5) The verticle lines correspond to following: green dotted lines are T50 interval, black dotted lines are T90 interval, blue solid line(s) is a spacecraft slew start time, and orange solid line(s) is a spacecraft slew end time.
- 6) Time of each bin is in the middle of the bin.
1 s binning
From T0-310 s to T0+310 s
From T100_start - 20 s to T100_end + 30 s
Full time interval
64 ms binning
Full time interval
From T100_start to T100_end

From T0-5 sec to T0+5 sec
16 ms binning
From T100_start-5 s to T100_start+5 s
8 ms binning
From T100_start-3 s to T100_start+3 s
2 ms binning
From T100_start-1 s to T100_start+1 s
SN=5 or 10 sec. binning (whichever binning is satisfied first)
SN=5 or 10 sec. binning (T < 200 sec)
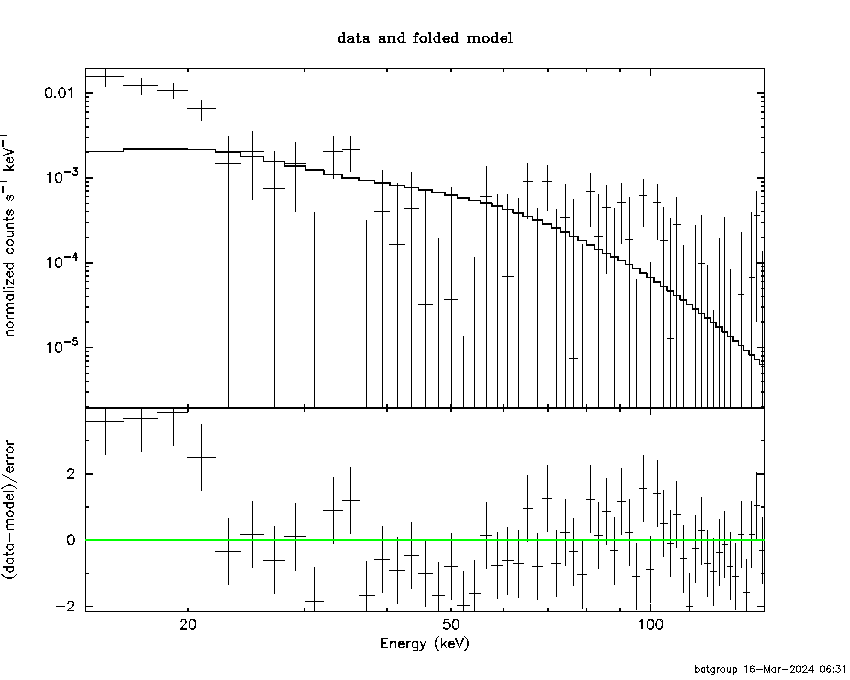
Spectra
Notes:
- 1) The fitting includes the systematic errors.
- 2) For long bursts, a spectral fit of the pre-slew DRM will introduce some errors in both a spectral shape and a normalization if the PHA file contains a lot of the slew/post-slew time interval.
- 3) For fits to more complicated models (e.g. a power-law over a cutoff power-law), the BAT team has decided to require a chi-square improvement of more than 6 for each extra dof.
- 4) For short bursts (T90<1sec), the specrtum is also fit with Blackbody, OTTB, and Double Blackbody.
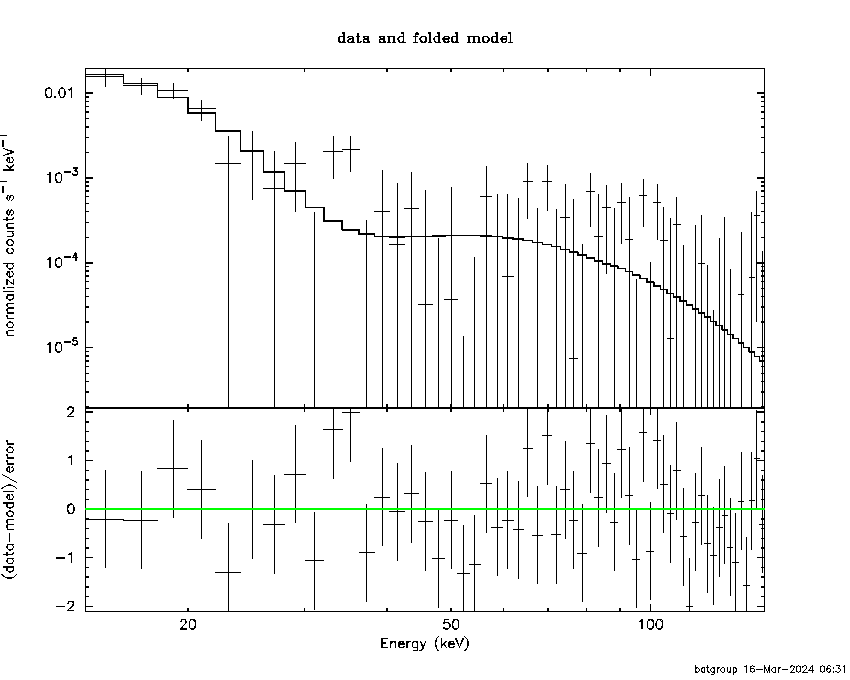
Time averaged spectrum fit using the pre-slew DRM
Power-law model

Multiple GTIs in the spectrum
tstart tstop
-140.556000 -78.900000
-78.000000 303.440000

Spectral model in power-law:
------------------------------------------------------------
Parameters  : value       lower 90%   higher 90%
Photon index: 6.49632     ( -0.288366   0.288473 )
Norm@50keV  : 6.25827E-05    ( -1.43642e-05   1.7768e-05 )
------------------------------------------------------------
#Fit statistic : Chi-Squared =          67.64 using 59 PHA bins.
# Reduced chi-squared =          1.187 for     57 degrees of freedom
# Null hypothesis probability =   1.581400e-01

Photon flux (15-150 keV)    in 443.1 sec: 0.425872 ( -0.0341837  0.0344672 ) ph/cm2/s
Energy fluence (15-150 keV)             : 5.54283e-06 ( -4.10454e-07  4.13428e-07 ) ergs/cm2
Cutoff power-law model

Multiple GTIs in the spectrum
tstart tstop
-140.556000 -78.900000
-78.000000 303.440000
Spectral model in the cutoff power-law:
------------------------------------------------------------
Parameters  : value       lower 90%   higher 90%
Photon index: 1.00000     (     )
Epeak [keV] : 50.0000      (   )
Norm@50keV  : 1.14273E-03    (     )
------------------------------------------------------------
#Fit statistic : Chi-Squared =         604.63 using 59 PHA bins.
# Reduced chi-squared =         10.797 for     56 degrees of freedom
# Null hypothesis probability =   4.813017e-93

Photon flux (15-150 keV)    in 443.1 sec: 0.401324 ( -0.041771  0.040492 ) ph/cm2/s
Energy fluence (15-150 keV)             : 5.21972e-06 ( -4.96361e-07  4.81428e-07 ) ergs/cm2
Band function
Multiple GTIs in the spectrum
tstart tstop
-140.556000 -78.900000
-78.000000 303.440000

Spectral model in the Band function:
------------------------------------------------------------
Parameters  : value       lower 90%   higher 90%
alpha       : 2.43085   ( -2.59392   1.76588 )
beta        : -10.0000    ( 9.53209   1.85672 )
Epeak [keV] : 10.5536      ( -0.558577 0.505928 )
Norm@50keV   : 1151.61    ( -73.7196   65625.1 )
------------------------------------------------------------
#Fit statistic : Chi-Squared =          47.94 using 59 PHA bins.
# Reduced chi-squared =         0.8717 for     55 degrees of freedom
# Null hypothesis probability =   7.388363e-01

Photon flux (15-150 keV)    in 443.1 sec:  (    ) ph/cm2/s
Energy fluence (15-150 keV)             : 0 ( 0  0 ) ergs/cm2
Single BB

Spectral model blackbody:
------------------------------------------------------------
Parameters  : value    Lower 90%  Upper 90%
kT [keV]    : 2.50968  (-0.1222  0.134099)
R^2/D10^2   : 194.301  (-70.2307   107.231)
(R is the radius in km and D10 is the distance to the source in units of 10 kpc)
------------------------------------------------------------
#Fit statistic : Chi-Squared =          48.25 using 59 PHA bins.
# Reduced chi-squared =         0.8464 for     57 degrees of freedom
# Null hypothesis probability =   7.889285e-01

Energy  Fluence     90% Error
[keV]   [erg/cm2]   [erg/cm2]
15- 25  4.857e-06   5.949e-07
25- 50  3.627e-07   5.980e-08
50-150  1.190e-10   6.075e-11
15-150  5.220e-06   5.583e-07
Thermal bremsstrahlung (OTTB)

XSPEC12>exit
 XSPEC: quit


Spectral model: thermal bremsstrahlung
------------------------------------------------------------
Parameters  : value         Lower 90%    Upper 90%
kT [keV]    : 4.20745       (-0.292337      0.332897)
Norm        : 187.911       (-59.1848     84.9396)
------------------------------------------------------------
 Reduced chi-squared =

Energy  Fluence     90% Error
[keV]   [erg/cm2]   [erg/cm2]
15- 25  4.971e-06   6.159e-07
25- 50  4.138e-07   6.316e-08
50-150  8.313e-10   4.260e-10
15-150  5.386e-06   5.782e-07
Double BB

XSPEC12>exit
 XSPEC: quit


Spectral model: bbodyrad<1> + bbodyrad<2>
------------------------------------------------------------
Parameters  : value         Lower 90%    Upper 90%
kT1 [keV]   : 2.51636        (-0.128301      0.128492)
R1^2/D10^2  : 190.201        (-68.7094      109.032)
kT2 [keV]   : 199.363        (-199.363      -199.363)
R2^2/D10^2  : 7.67540E-17    (-1.4548e-23   0.000323608)
------------------------------------------------------------
 Reduced chi-squared =

Energy  Fluence     90% Error
[keV]   [erg/cm2]   [erg/cm2]
15- 25  4.847e-06   7.036e-07
25- 50  3.658e-07   5.523e-08
50-150  1.232e-10   6.952e-11
15-150  5.213e-06   6.576e-07
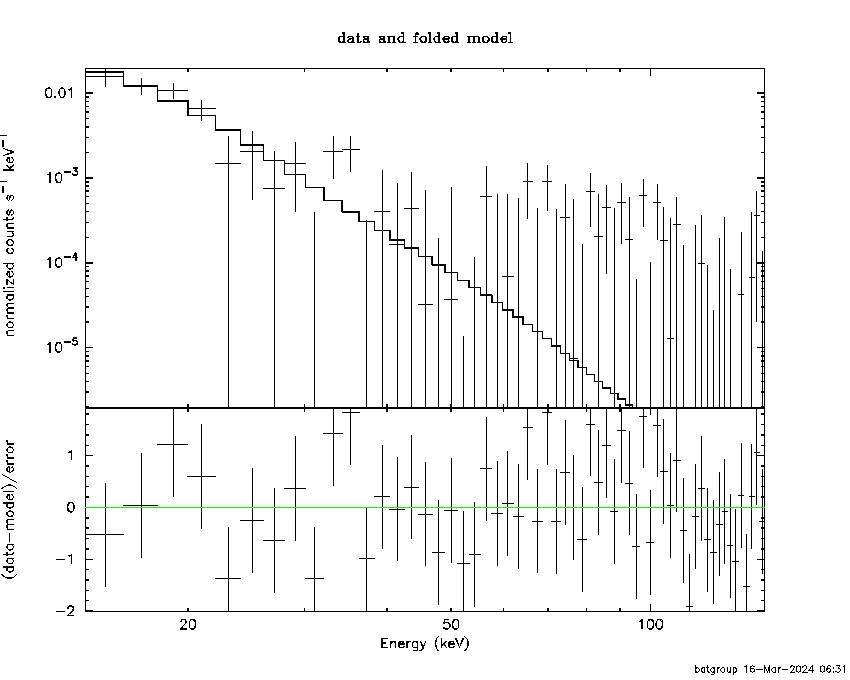
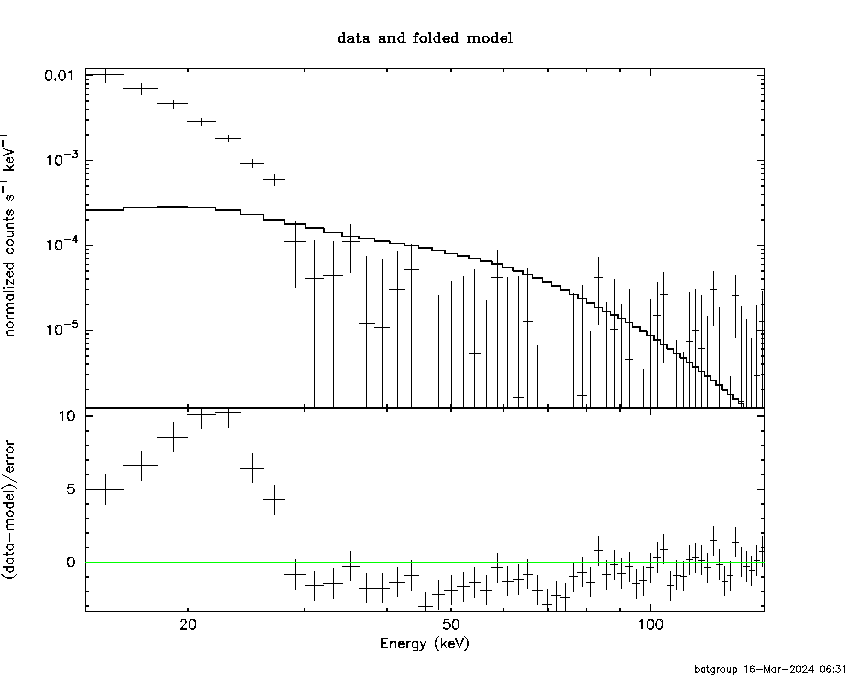
Peak spectrum fit
Power-law model

Time interval is from   26.876 sec. to   27.876 sec.

Spectral model in power-law:
------------------------------------------------------------
Parameters  : value       lower 90%   higher 90%
Photon index: 5.07842     ( -0.874431   1.04091 )
Norm@50keV  : 5.36746E-04    ( -0.000536746   0.000738227 )
------------------------------------------------------------
#Fit statistic : Chi-Squared =          48.20 using 59 PHA bins.
# Reduced chi-squared =         0.8457 for     57 degrees of freedom
# Null hypothesis probability =   7.901911e-01

Photon flux (15-150 keV)    in 1 sec: 0.892746 ( -0.177353  0.177794 ) ph/cm2/s
Energy fluence (15-150 keV)             : 2.84e-08 ( -6.40589e-09  6.83739e-09 ) ergs/cm2
Cutoff power-law model
Time interval is from   26.876 sec. to   27.876 sec.
Spectral model in the cutoff power-law:
------------------------------------------------------------
Parameters  : value       lower 90%   higher 90%
Photon index: 1.00000     (     )
Epeak [keV] : 50.0000      (   )
Norm@50keV  : 1.09500E-02    (     )
------------------------------------------------------------
#Fit statistic : Chi-Squared =          97.65 using 59 PHA bins.
# Reduced chi-squared =          1.744 for     56 degrees of freedom
# Null hypothesis probability =   4.798727e-04

Photon flux (15-150 keV)    in 1 sec: 0.891421 0.883493 (    ) ph/cm2/s
Energy fluence (15-150 keV)             : 2.73671e-08 ( -6.5063e-09  7.7407e-09 ) ergs/cm2
Band function
Time interval is from   26.876 sec. to   27.876 sec.

Spectral model in the Band function:
------------------------------------------------------------
Parameters  : value       lower 90%   higher 90%
alpha       : -8.87599   ( 8.87599   8.87599 )
beta        : -5.10664    ( -1.01706   0.898558 )
Epeak [keV] : 1.87320      ( -1.8732 -1.8732 )
Norm@50keV   : 7.07840E-02    ( -0.0714043   0.101919 )
------------------------------------------------------------
#Fit statistic : Chi-Squared =          48.21 using 59 PHA bins.
# Reduced chi-squared =         0.8765 for     55 degrees of freedom
# Null hypothesis probability =   7.297812e-01

Photon flux (15-150 keV)    in 1 sec:  (    ) ph/cm2/s
Energy fluence (15-150 keV)             : 0 ( 0  0 ) ergs/cm2
Single BB
 XSPEC: quit


Spectral model blackbody:
------------------------------------------------------------
Parameters  : value    Lower 90%  Upper 90%
kT [keV]    : 2.64439  (-0.448122  0.558359)
R^2/D10^2   : 294.552  (-294.552   827.786)
(R is the radius in km and D10 is the distance to the source in units of 10 kpc)
------------------------------------------------------------
 Reduced chi-squared =

Energy  Fluence     90% Error
[keV]   [erg/cm2]   [erg/cm2]
15- 25  2.406e-08   1.329e-08
25- 50  2.208e-09   1.380e-09
50-150  1.191e-12   1.288e-12
15-150  2.627e-08   1.495e-08
Thermal bremsstrahlung (OTTB)
XSPEC12>exit
 XSPEC: quit


Spectral model: thermal bremsstrahlung
------------------------------------------------------------
Parameters  : value         Lower 90%    Upper 90%
kT [keV]    : 5.19345       (-1.34912      2.0826)
Norm        : 178.883       (-178.883     376.868)
------------------------------------------------------------
 Reduced chi-squared =

Energy  Fluence     90% Error
[keV]   [erg/cm2]   [erg/cm2]
15- 25  2.354e-08   1.187e-08
25- 50  3.238e-09   2.016e-09
50-150  2.026e-11   2.227e-11
15-150  2.680e-08   1.480e-08
Double BB
XSPEC12>exit
 XSPEC: quit


Spectral model: bbodyrad<1> + bbodyrad<2>
------------------------------------------------------------
Parameters  : value         Lower 90%    Upper 90%
kT1 [keV]   : 2.57109        (-0.448307      0.543534)
R1^2/D10^2  : 350.197        (-348.373      399.697)
kT2 [keV]   : 25.6008        (-26.5861      -26.5861)
R2^2/D10^2  : 2.84724E-03    (-0.00273794   439.669)
------------------------------------------------------------
 Reduced chi-squared =

Energy  Fluence     90% Error
[keV]   [erg/cm2]   [erg/cm2]
15- 25  2.381e-08   1.269e-08
25- 50  3.769e-09   1.999e-09
50-150  8.898e-09   7.735e-09
15-150  3.648e-08   1.743e-08
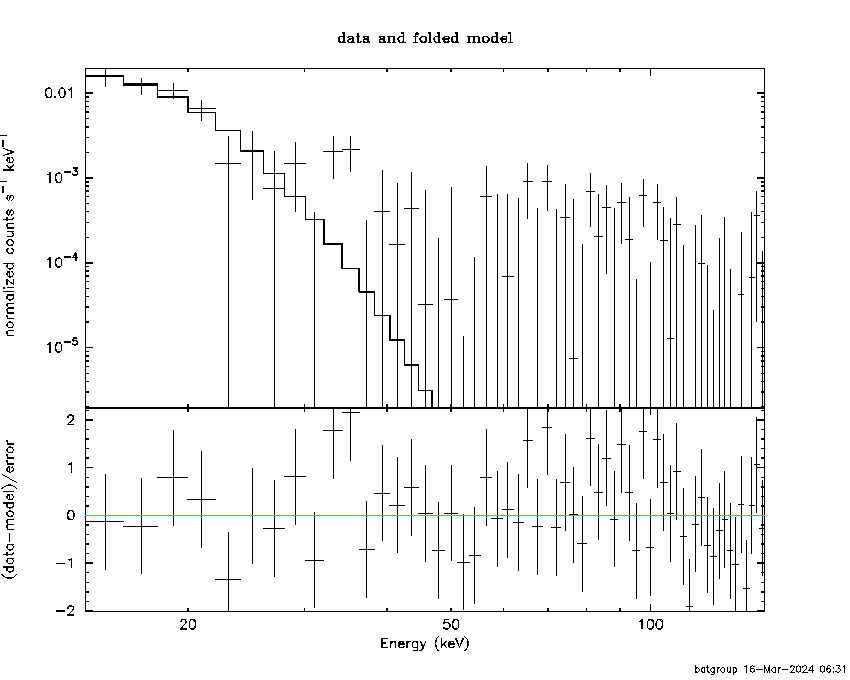
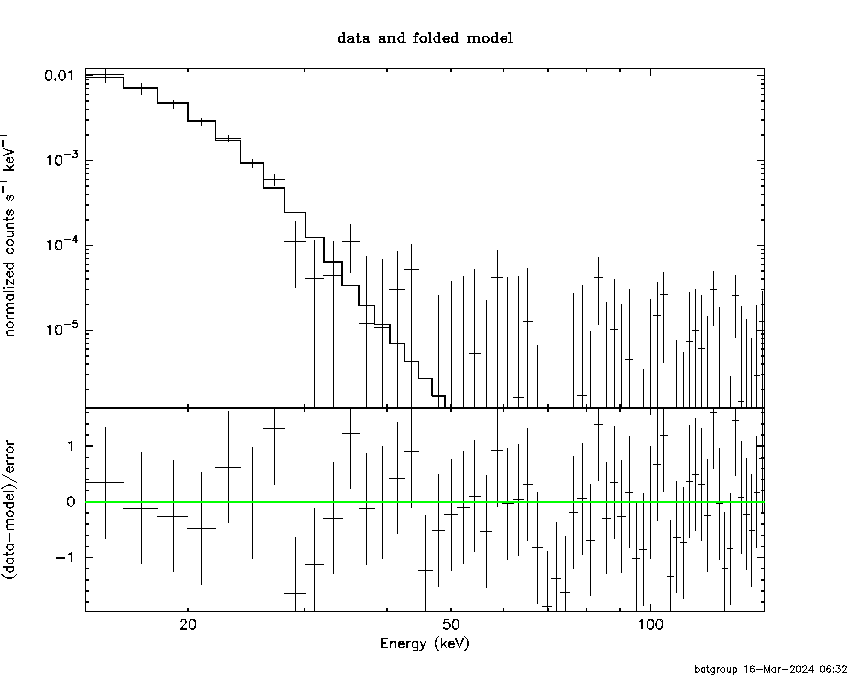
Pre-slew spectrum (Pre-slew PHA with pre-slew DRM)
Power-law model

Spectral model in power-law:
------------------------------------------------------------
Parameters  : value       lower 90%   higher 90%
Photon index: 6.50762     ( -0.322364   0.324727 )
Norm@50keV  : 7.09700E-05    ( -1.85312e-05   2.36713e-05 )
------------------------------------------------------------
#Fit statistic : Chi-Squared =          55.80 using 59 PHA bins.
# Reduced chi-squared =         0.9790 for     57 degrees of freedom
# Null hypothesis probability =   5.200408e-01

Photon flux (15-150 keV)    in 212 sec: 0.488564 ( -0.0412071  0.0414572 ) ph/cm2/s
Energy fluence (15-150 keV)             : 3.04095e-06 ( -2.38396e-07  2.3959e-07 ) ergs/cm2
Cutoff power-law model
Spectral model in the cutoff power-law:
------------------------------------------------------------
Parameters  : value       lower 90%   higher 90%
Photon index: 1.00000     (     )
Epeak [keV] : 50.0000      (   )
Norm@50keV  : 1.41248E-03    (     )
------------------------------------------------------------
#Fit statistic : Chi-Squared =         499.38 using 59 PHA bins.
# Reduced chi-squared =         8.9175 for     56 degrees of freedom
# Null hypothesis probability =   2.009309e-72

Photon flux (15-150 keV)    in 212 sec: 0.467613 ( -0.049493  0.04801 ) ph/cm2/s
Energy fluence (15-150 keV)             : 2.89836e-06 ( -2.81557e-07  2.73416e-07 ) ergs/cm2
Band function
Spectral model in the Band function:
------------------------------------------------------------
Parameters  : value       lower 90%   higher 90%
alpha       : 2.04259   ( -3.73941   -2.04031 )
beta        : -10.0000    ( 10   10 )
Epeak [keV] : 9.88835      ( -0.974335 4.03799 )
Norm@50keV   : 742.608    ( -433.85   0 )
------------------------------------------------------------
#Fit statistic : Chi-Squared =          38.39 using 59 PHA bins.
# Reduced chi-squared =         0.6981 for     55 degrees of freedom
# Null hypothesis probability =   9.566362e-01

Photon flux (15-150 keV)    in 212 sec: 0.659810 (    ) ph/cm2/s
Energy fluence (15-150 keV)             : 0 ( 0  0 ) ergs/cm2
S(25-50 keV) vs. S(50-100 keV) plot
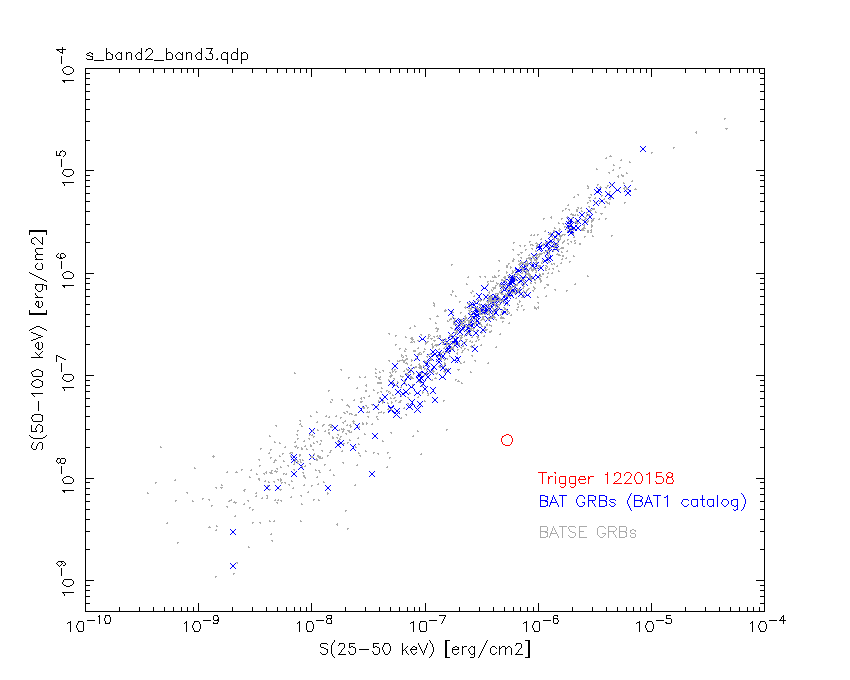
S(25-50 keV)  = 5.33e-07
S(50-100 keV) = 2.36e-08
T90 vs. Hardness ratio plot

T90                                   = 329.775999903679 sec.
Hardness ratio (energy fluence ratio) = 0.0442777
Color vs. Color plot
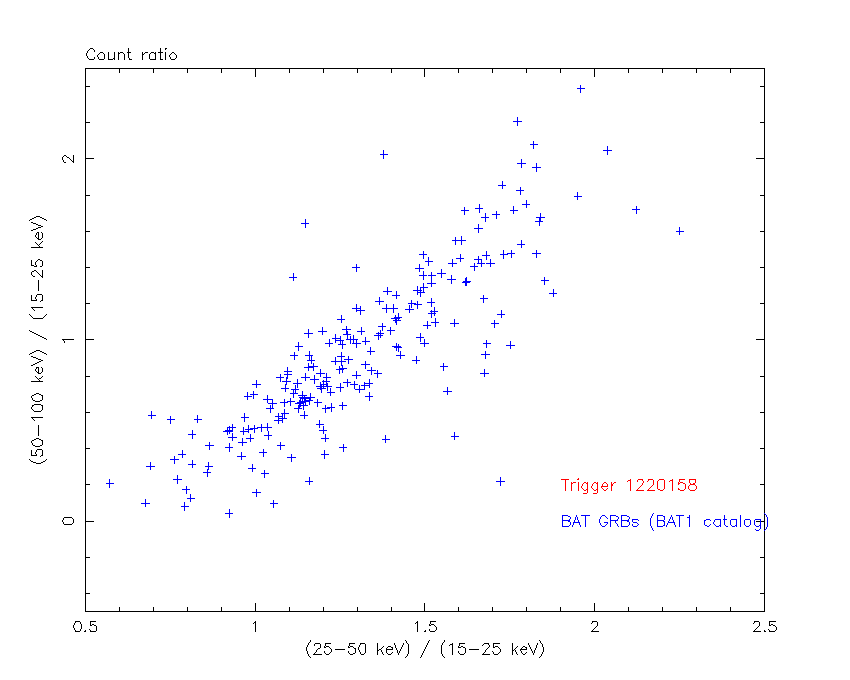
Count Ratio  (25-50 keV) / (15-25 keV) = 0.0704292
Count Ratio (50-100 keV) / (15-25 keV) = -0.00841201
Mask shadow pattern

IMX = -1.591339238720346E-04, IMY = -1.076276123236748E-02
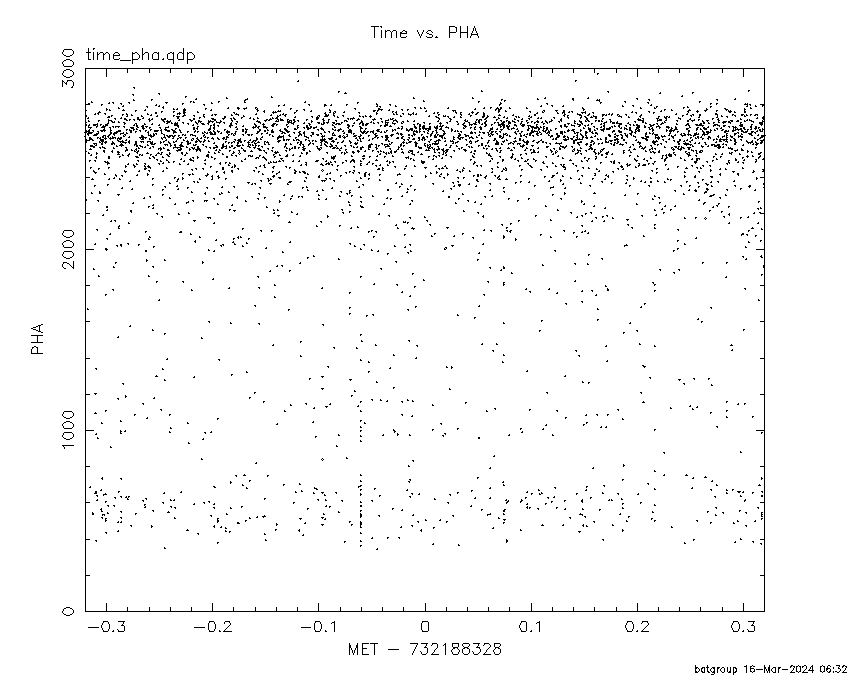
TIME vs. PHA plot around the trigger time
TIME vs. DetID plot around the trigger time
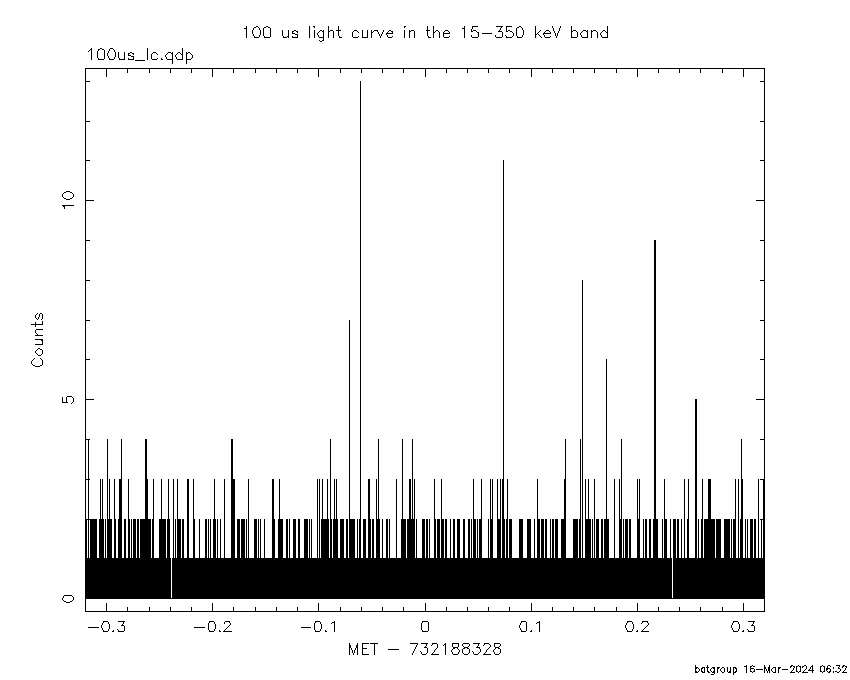
100 us light curve (15-350 keV)
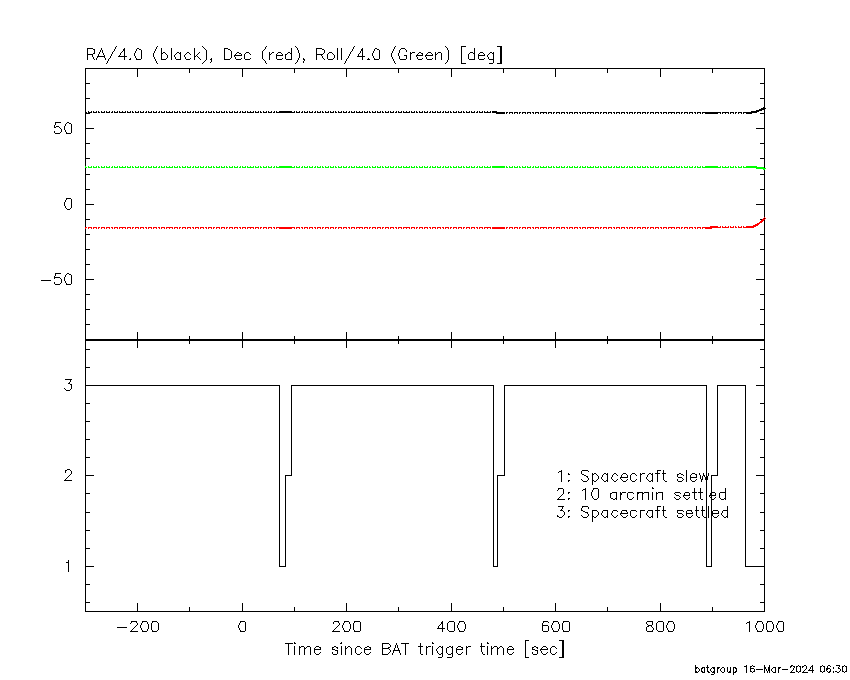
Spacecraft aspect plot
Bright source in the pre-burst/pre-slew/post-slew images
Pre-burst image of 15-350 keV band
Time interval of the image:
-239.000000 -143.200000
-142.000000 -140.556000

# RAcent  DECcent POSerr Theta    Phi  PeakCts   SNR AngSep     Name
#  [deg]    [deg]    ['] [deg]  [deg]                   [']
244.9438 -15.7869  347.1   1.1  -90.1  -0.0074  -0.0    9.0	Sco X-1
254.5830  35.4048    9.3  52.1 -176.7  -0.7464  -1.2    7.2	Her X-1
255.8692 -37.9907   12.9  24.8  -31.1  -0.2171  -0.9   10.4	4U 1700-377
256.2612 -36.4019    3.7  23.5  -33.7  -0.7330  -3.2    8.5	GX 349+2
262.9094 -24.6385    4.8  20.0  -68.2  -0.6251  -2.4    8.4	GX 1+4
264.8769 -44.3091    5.3  33.8  -35.5   0.6307   2.2   10.2	4U 1735-44
268.2261  -1.2976  460.7  28.0 -126.3   0.0073   0.0   12.6	SW J1753.5-0127
270.4327 -24.9354    9.6  26.6  -73.1  -0.3647  -1.2   11.8	GX 5-1
270.4277 -25.5999    6.9  26.8  -71.7  -0.5030  -1.7   10.9	GRS 1758-258
273.8702 -13.9026    5.8  29.1  -97.3   0.6992   2.0   11.3	GX 17+2
276.0892 -30.4530   28.2  33.0  -65.5   0.1618   0.4    9.9	H1820-303
284.8825 -25.0412    6.4  39.5  -77.3   1.3502   1.8   11.1	HT1900.1-2455
262.8129 -33.8942    7.7  25.0  -47.6   0.4087   1.5    9.5	GX 354-0
244.1952  13.6495    2.7  29.3  172.9   1.0593   4.2 ------	UNKNOWN
243.5644 -15.5911    0.4   0.2   94.1   6.8046  30.8 ------	UNKNOWN
282.1660 -33.9225    2.4  39.0  -62.8   2.3435   4.7 ------	UNKNOWN
287.5104 -33.3206    2.1  43.1  -65.5   5.5158   5.6 ------	UNKNOWN
Pre-slew background subtracted image of 15-350 keV band
Time interval of the image:
-140.556000 -78.900000
-78.000000 72.300600

# RAcent  DECcent POSerr Theta    Phi  PeakCts   SNR AngSep     Name
#  [deg]    [deg]    ['] [deg]  [deg]                   [']
245.1543 -15.5113    0.0   1.3 -103.3  -0.3869  -0.7   12.7	Sco X-1
254.5723  35.3427    9.7  52.0 -176.7   1.1549   1.2    5.6	Her X-1
255.7997 -37.9256   12.1  24.7  -31.0   0.3688   1.0   10.1	4U 1700-377
256.3489 -36.5693    9.1  23.7  -33.6  -0.4862  -1.3    9.7	GX 349+2
262.8485 -24.6743   11.6  20.0  -68.0   0.4345   1.0    9.7	GX 1+4
264.8096 -44.3609    2.7  33.8  -35.3  -2.1591  -4.3    6.1	4U 1735-44
268.4348  -1.3732   11.4  28.2 -125.9  -0.5096  -1.0    6.2	SW J1753.5-0127
270.4427 -25.1959   70.7  26.7  -72.6  -0.0862  -0.2   11.1	GX 5-1
270.1372 -25.8393    6.0  26.6  -71.0   0.9882   1.9   10.6	GRS 1758-258
274.1209 -14.1593    5.3  29.3  -96.7   1.2807   2.2   10.0	GX 17+2
275.8551 -30.2878    5.1  32.8  -65.7  -1.4554  -2.2    6.0	H1820-303
284.9450 -24.9023   90.2  39.5  -77.5  -0.1783  -0.1    5.1	HT1900.1-2455
262.8825 -33.9821   61.9  25.1  -47.6  -0.0857  -0.2   10.3	GX 354-0
218.3375  27.6492    2.5  49.8  142.2   8.9402   4.7 ------	UNKNOWN
220.5135  24.3456    2.0  46.0  142.1   7.1193   5.8 ------	UNKNOWN
224.0378  19.7842    2.8  40.4  142.7   3.0888   4.2 ------	UNKNOWN
243.1697 -15.5450    0.4   0.6   90.9  10.4640  28.4 ------	UNKNOWN
254.1806 -37.7952    1.5  24.0  -28.4   2.9234   7.7 ------	UNKNOWN
279.8443  28.3491    2.6  56.1 -149.3  10.1942   4.5 ------	UNKNOWN
281.8883  21.2466    2.5  52.5 -141.5   9.3071   4.6 ------	UNKNOWN
283.7531   9.0110    2.4  46.6 -127.1   8.2603   4.8 ------	UNKNOWN
Post-slew image of 15-350 keV band
Time interval of the image:
82.800620 363.180900

# RAcent  DECcent POSerr Theta    Phi  PeakCts   SNR AngSep     Name
#  [deg]    [deg]    ['] [deg]  [deg]                   [']
244.9875 -15.6508    4.3   1.7  -94.1  -1.4227  -2.7    0.8	Sco X-1
254.4338  35.2108    4.4  51.9 -176.4  -3.8304  -2.6    8.0	Her X-1
255.8047 -37.8793    8.7  24.9  -32.1   0.7602   1.3    8.9	4U 1700-377
256.3973 -36.5455    5.5  24.1  -34.7   1.1702   2.1    7.6	GX 349+2
263.1688 -24.8357   28.2  20.9  -68.4  -0.2374  -0.4   10.2	GX 1+4
264.5523 -44.5119    8.6  34.1  -35.6  -0.9614  -1.3    9.0	4U 1735-44
268.5140  -1.3332    0.0  28.7 -125.3  -0.9063  -1.3   11.3	SW J1753.5-0127
270.4486 -25.0225    9.9  27.2  -73.2  -0.7957  -1.2    9.6	GX 5-1
270.2583 -25.8811    7.9  27.2  -71.3  -1.0345  -1.4    8.6	GRS 1758-258
273.8517 -14.0503    7.0  29.6  -96.9   1.3153   1.6    9.0	GX 17+2
276.0898 -30.2174    4.4  33.5  -66.3   2.4272   2.6   12.4	H1820-303
285.0793 -24.9333   32.7  40.2  -77.6  -0.6520  -0.4    2.5	HT1900.1-2455
263.1241 -33.7549   36.8  25.6  -49.0  -0.2018  -0.3    8.3	GX 354-0
217.1247  26.7293    2.4  49.3  140.7  10.4574   4.8 ------	UNKNOWN
213.2459 -28.9099    3.0  30.7   51.0   2.9608   3.8 ------	UNKNOWN
243.0307 -15.5296    0.5   0.2   85.4  12.1168  24.0 ------	UNKNOWN
253.9264 -37.7490    1.5  24.1  -29.1   4.0446   7.5 ------	UNKNOWN
287.1384 -60.9548    2.1  55.2  -32.3  15.6936   5.5 ------	UNKNOWN
Plot creation:
Sat Mar 16 06:32:24 EDT 2024