Estimated redshift from machine learning (Ukwatta et al. 2016) - may take a few minute to calcaulte
Image
Pre-slew 15.0-350.0 keV image (Event data)

#   RAcent    DECcent   POSerr    Theta     Phi              Peak Cts       SNR   Name
  129.1904    73.1549   0.0071    27.1114  -111.1573         3.2113232     27.090 TRIG_01221874

Foreground time interval of the image:
 -0.696  37.512 (delta_t =  38.208 [sec])
Background time interval of the image:
-121.699  -0.696 (delta_t = 121.003 [sec])
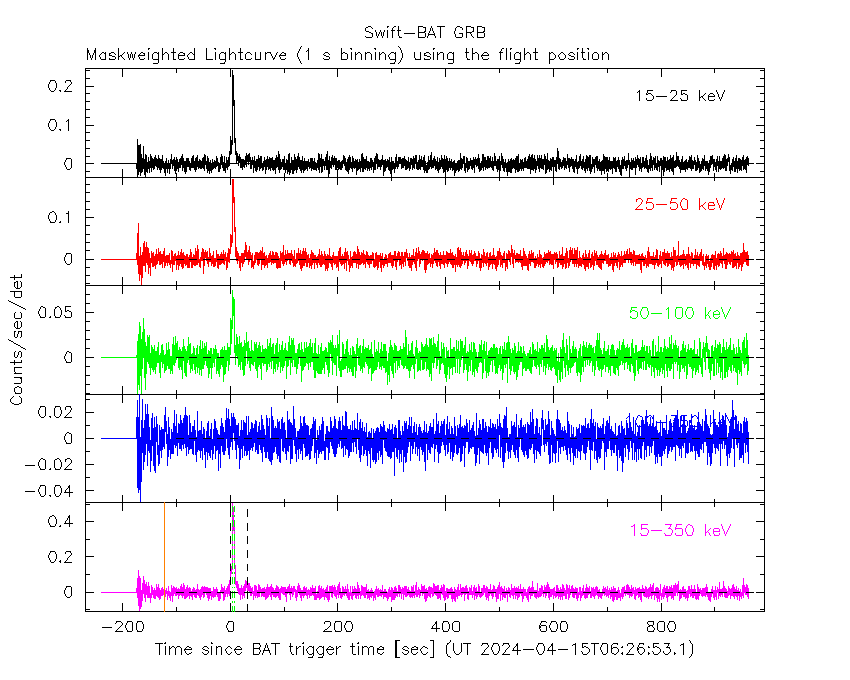
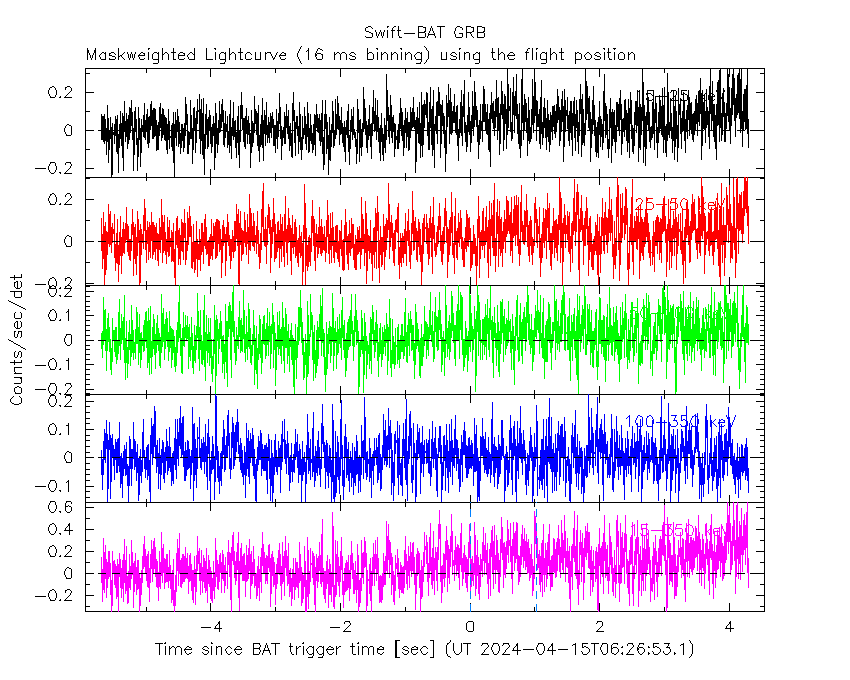
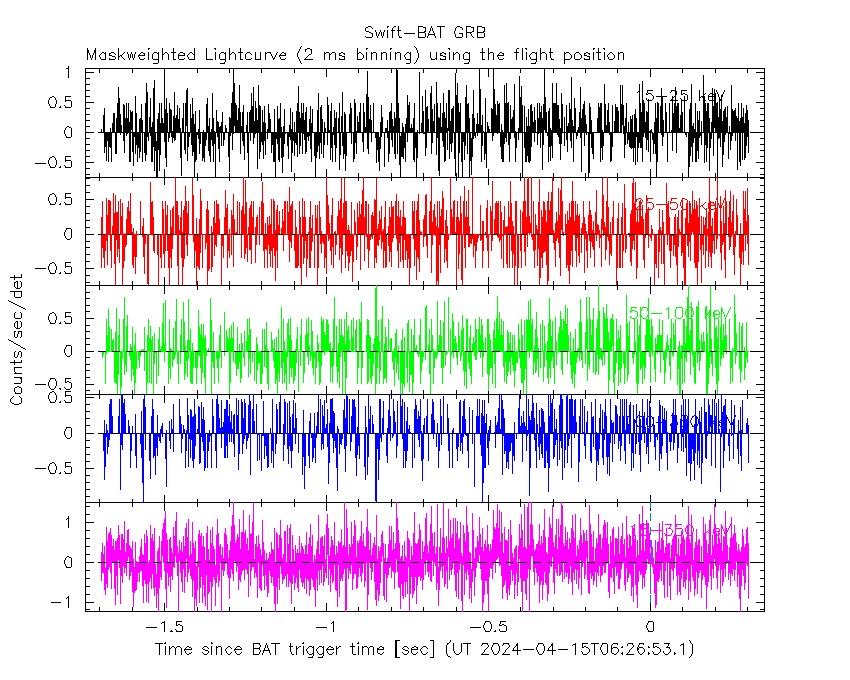
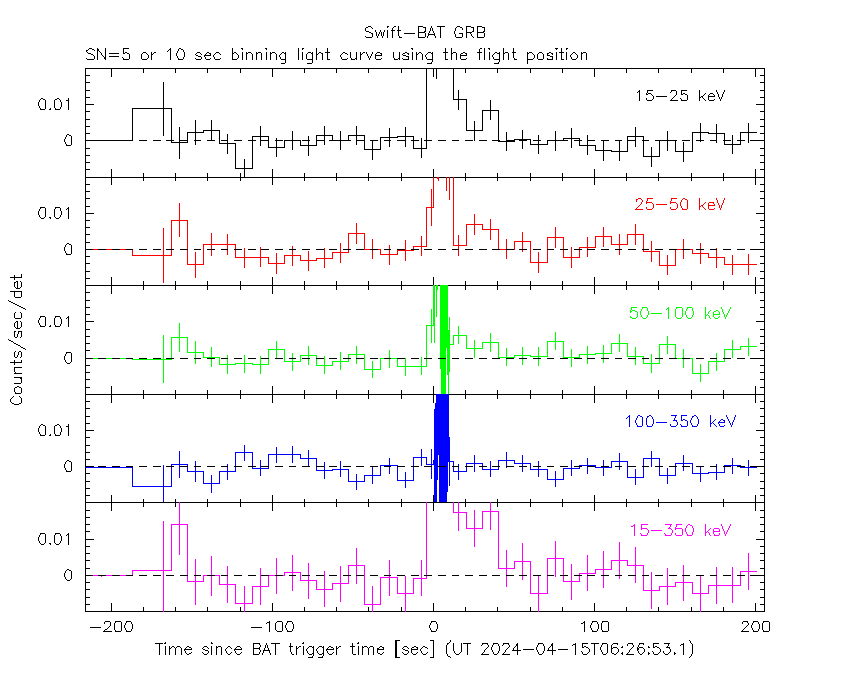
Lightcurves
Notes:
- 1) The mask-weighted light curves are using the flight position.
- 2) Multiple plots of different time binning/intervals are shown to cover all scenarios of short/long GRBs, rate/image triggers, and real/false positives.
- 3) For all the mask-weighted lightcurves, the y-axis units are counts/sec/det where a det is 0.4 x 0.4 = 0.16 sq cm.
- 4) The verticle lines correspond to following: green dotted lines are T50 interval, black dotted lines are T90 interval, blue solid line(s) is a spacecraft slew start time, and orange solid line(s) is a spacecraft slew end time.
- 5) Time of each bin is in the middle of the bin.
1 s binning
From T0-310 s to T0+310 s

From T100_start - 20 s to T100_end + 30 s

Full time interval
64 ms binning
Full time interval
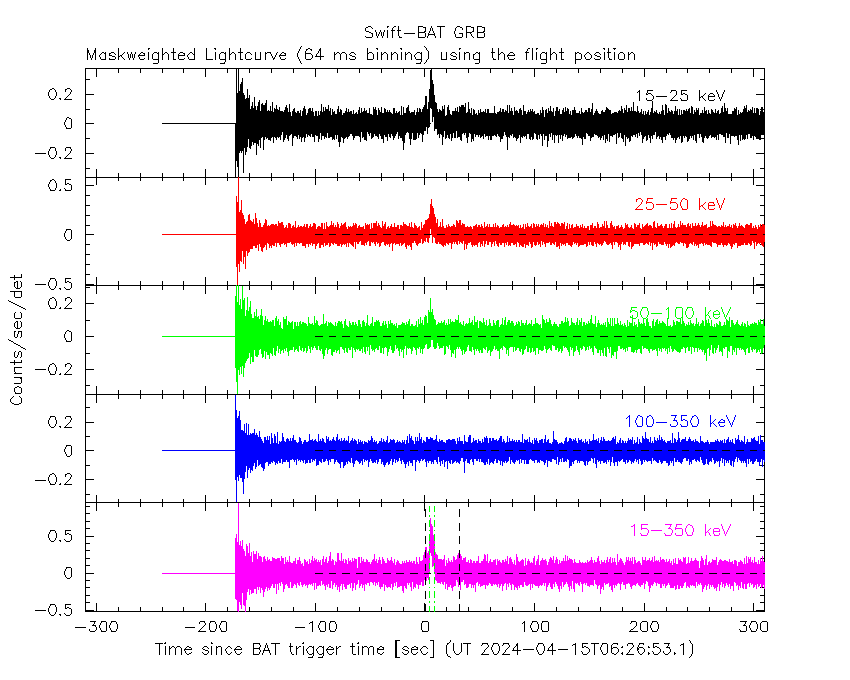
From T100_start to T100_end

From T0-5 sec to T0+5 sec

16 ms binning
From T100_start-5 s to T100_start+5 s
Blue+Cyan dotted lines: Time interval of the scaled map
From 0.000000 to 1.024000
8 ms binning
From T100_start-3 s to T100_start+3 s

Blue+Cyan dotted lines: Time interval of the scaled map
From 0.000000 to 1.024000
2 ms binning
From T100_start-1 s to T100_start+1 s
Blue+Cyan dotted lines: Time interval of the scaled map
From 0.000000 to 1.024000
SN=5 or 10 sec. binning (whichever binning is satisfied first)

SN=5 or 10 sec. binning (T < 200 sec)
Quad-rate summed light curves (from T0-300s to T0+1000s)

Spectral Evolution

Spectra
Notes:
- 1) The fitting includes the systematic errors.
- 2) When the burst includes telescope slew time periods, the fitting uses an average response file made from multiple 5-s response files through out the slew time plus single time preiod for the non-slew times, and weighted by the total counts in the corresponding time period using addrmf. An average response file is needed becuase a spectral fit using the pre-slew DRM will introduce some errors in both a spectral shape and a normalization if the PHA file contains a lot of the slew/post-slew time interval.
- 3) For fits to more complicated models (e.g. a power-law over a cutoff power-law), the BAT team has decided to require a chi-square improvement of more than 6 for each extra dof.
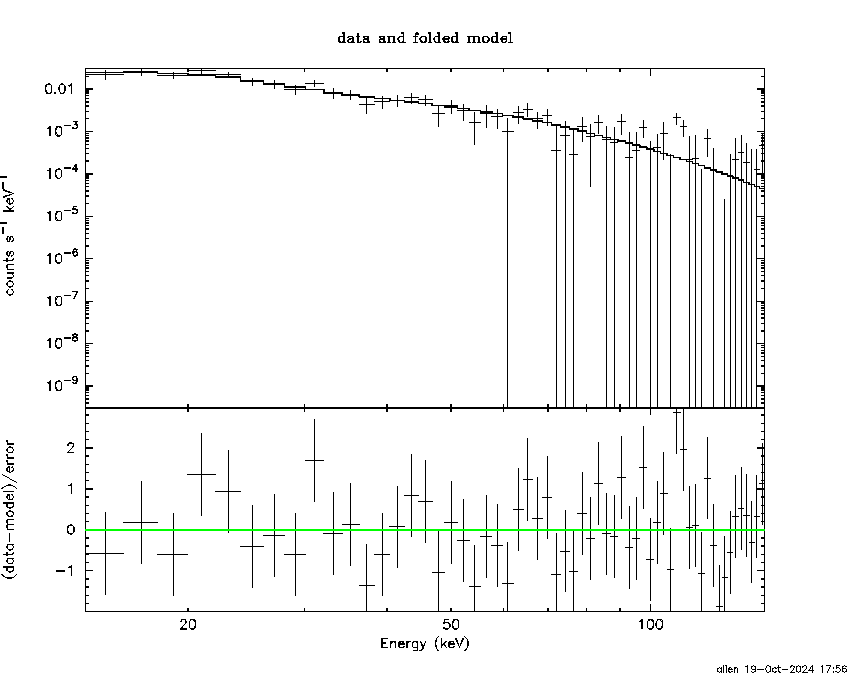
Time averaged spectrum fit using the average DRM
Power-law model
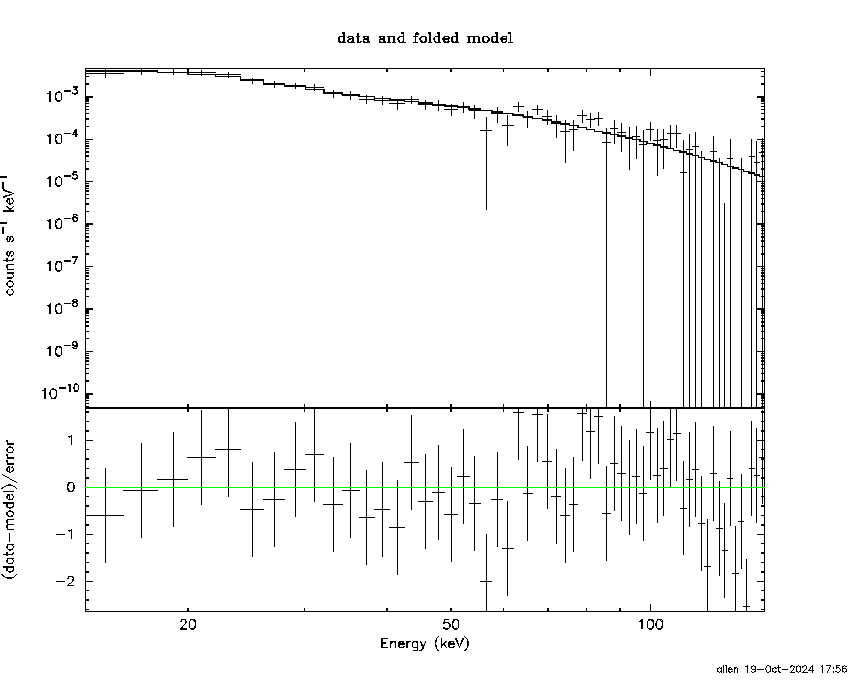
Time interval is from   -0.696 sec. to   37.512 sec.

Spectral model in power-law:
------------------------------------------------------------
Parameters  : value       lower 90%   higher 90%
Photon index: 2.28650     ( -0.133511   0.138616 )
Norm@50keV  : 4.12121E-03    ( -0.000354428   0.000348378 )
------------------------------------------------------------
#Fit statistic  : Chi-Squared                   44.47     using 59 bins.
 Reduced chi-squared = 0.780175
# Null hypothesis probability of 8.87e-01 with 57 degrees of freedom

Photon flux (15-150 keV)    in 38.21 sec: 0.714927 ( -0.044672  0.044794 ) ph/cm2/s
Energy fluence (15-150 keV)             : 1.50147e-06 ( -1.04918e-07  1.06349e-07 ) ergs/cm2
Cutoff power-law model

Time interval is from   -0.696 sec. to   37.512 sec.
Spectral model in the cutoff power-law:
------------------------------------------------------------
Parameters  : value       lower 90%   higher 90%
Photon index: 2.35632     ( -0.414652   0.378688 )
Epeak [keV] : 207.603      (   )
Norm@50keV  : 3.75480E-03    (     )
------------------------------------------------------------
#Fit statistic  : Chi-Squared                   44.30     using 59 bins.
 Reduced chi-squared = 0.791071
# Null hypothesis probability of 8.71e-01 with 56 degrees of freedom

Photon flux (15-150 keV)    in 38.21 sec: 0.715589 ( -0.089255  0.046996 ) ph/cm2/s
Energy fluence (15-150 keV)             : 1.45388e-06 ( -9.92566e-08  1.30825e-07 ) ergs/cm2
Band function

Time interval is from   -0.696 sec. to   37.512 sec.


Spectral model in the Band function:
------------------------------------------------------------
Parameters  : value       lower 90%   higher 90%
alpha       :    (     )
beta        :     (     )
Epeak [keV] :       (   )
Norm@50keV   :     (     )
------------------------------------------------------------

Photon flux (15-150 keV)    in  sec:  (    ) ph/cm2/s
Energy fluence (15-150 keV)             : 0 ( 0  0 ) ergs/cm2
Single BB
Spectral model blackbody:
------------------------------------------------------------
Parameters  : value    Lower 90%  Upper 90%
kT [keV]    : 8.20554  (  )
R^2/D10^2   : 0.649795  (   )
(R is the radius in km and D10 is the distance to the source in units of 10 kpc)
------------------------------------------------------------
#Fit statistic  : Chi-Squared                  126.94     using 59 bins.
 Reduced chi-squared =
# Null hypothesis probability of 3.06e-07 with 57 degrees of freedom

Energy  Fluence     90% Error
[keV]   [erg/cm2]   [erg/cm2]
15- 25  3.079e-07   3.506e-08
25- 50  5.628e-07   4.318e-08
50-150  1.605e-07   3.116e-08
15-150  1.031e-06   7.527e-08
Thermal bremsstrahlung (OTTB)
Spectral model: thermal bremsstrahlung
------------------------------------------------------------
Parameters  : value         Lower 90%    Upper 90%
kT [keV]    : 46.5485       (-8.03398      10.9046)
Norm        : 4.05892       (-0.503972     0.62258)
------------------------------------------------------------
#Fit statistic  : Chi-Squared                   57.17     using 59 bins.
 Reduced chi-squared =
# Null hypothesis probability of 4.69e-01 with 57 degrees of freedom

Energy  Fluence     90% Error
[keV]   [erg/cm2]   [erg/cm2]
15- 25  3.726e-07   3.082e-08
25- 50  5.213e-07   3.458e-08
50-150  4.723e-07   8.809e-08
15-150  1.366e-06   1.185e-07
Double BB

Spectral model: bbodyrad<1> + bbodyrad<2>
------------------------------------------------------------
Parameters  : value         Lower 90%    Upper 90%
kT1 [keV]   : 5.05813        (-0.627977      0.673631)
R1^2/D10^2  : 3.99480        (-1.65809      3.21228)
kT2 [keV]   : 20.7810        (-3.55102      4.83604)
R2^2/D10^2  : 1.21413E-02    (-0.00655412   0.0129853)
------------------------------------------------------------
#Fit statistic  : Chi-Squared                   40.07     using 59 bins.
 Reduced chi-squared =
# Null hypothesis probability of 9.35e-01 with 55 degrees of freedom

Energy  Fluence     90% Error
[keV]   [erg/cm2]   [erg/cm2]
15- 25  4.267e-07   7.277e-08
25- 50  4.553e-07   7.533e-08
50-150  6.355e-07   1.915e-07
15-150  1.518e-06   3.099e-07
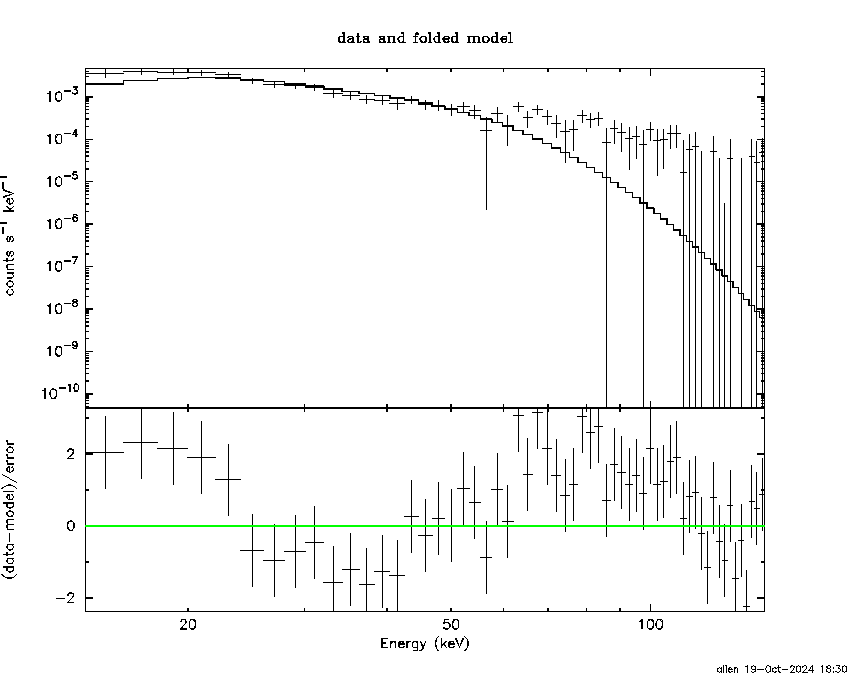
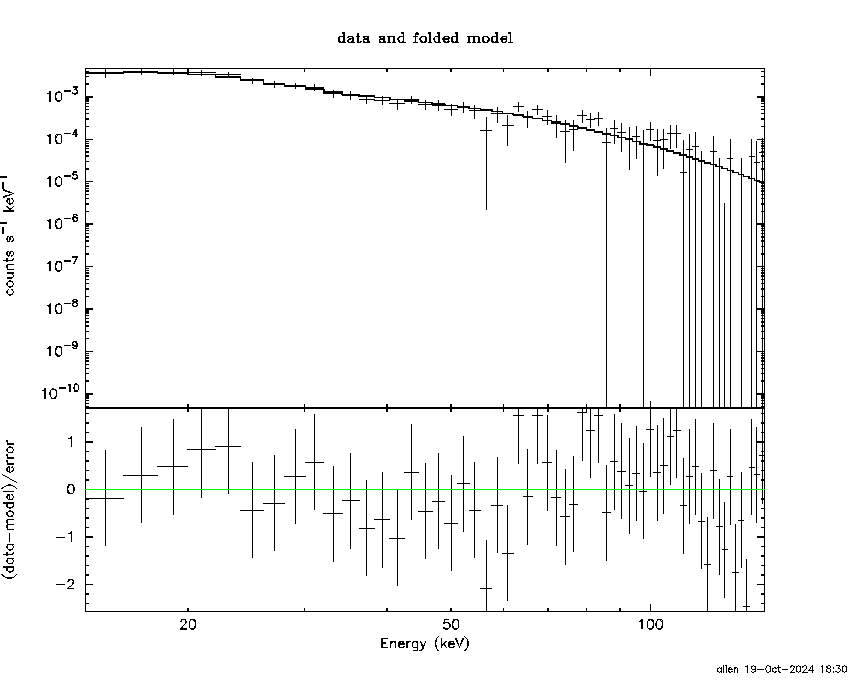
Peak spectrum fit
Power-law model

Time interval is from    5.100 sec. to    6.100 sec.

Spectral model in power-law:
------------------------------------------------------------
Parameters  : value       lower 90%   higher 90%
Photon index: 2.35019     ( -0.16069   0.168649 )
Norm@50keV  : 2.48534E-02    ( -0.00282076   0.00276736 )
------------------------------------------------------------
#Fit statistic  : Chi-Squared                   49.64     using 59 bins.
 Reduced chi-squared = 0.870877
# Null hypothesis probability of 7.45e-01 with 57 degrees of freedom

Photon flux (15-150 keV)    in 1 sec: 4.46851 ( -0.36571  0.36602 ) ph/cm2/s
Energy fluence (15-150 keV)             : 2.39889e-07 ( -2.19123e-08  2.22007e-08 ) ergs/cm2
Cutoff power-law model
Time interval is from    5.100 sec. to    6.100 sec.
Spectral model in the cutoff power-law:
------------------------------------------------------------
Parameters  : value       lower 90%   higher 90%
Photon index: 1.99197     ( -0.485845   -1.99197 )
Epeak [keV] : 0.918644      ( -0.334479 0.849885 )
Norm@50keV  : 4.01782E-02    ( -0.00657057   0.00785137 )
------------------------------------------------------------
#Fit statistic  : Chi-Squared                   50.03     using 59 bins.
 Reduced chi-squared = 0.893393
# Null hypothesis probability of 6.99e-01 with 56 degrees of freedom

Photon flux (15-150 keV)    in 1 sec: 4.39842 ( -0.35017  0.36104 ) ph/cm2/s
Energy fluence (15-150 keV)             : 2.32129e-07 ( -2.1969e-08  2.36059e-08 ) ergs/cm2
Band function

Time interval is from    5.100 sec. to    6.100 sec.


Spectral model in the Band function:
------------------------------------------------------------
Parameters  : value       lower 90%   higher 90%
alpha       :    (     )
beta        :     (     )
Epeak [keV] :       (   )
Norm@50keV   :     (     )
------------------------------------------------------------

Photon flux (15-150 keV)    in  sec:  (    ) ph/cm2/s
Energy fluence (15-150 keV)             : 0 ( 0  0 ) ergs/cm2
Single BB

Spectral model blackbody:
------------------------------------------------------------
Parameters  : value    Lower 90%  Upper 90%
kT [keV]    : 7.87259  (-0.752272  0.834425)
R^2/D10^2   : 5.04443  (-1.7292   2.6425)
(R is the radius in km and D10 is the distance to the source in units of 10 kpc)
------------------------------------------------------------
#Fit statistic  : Chi-Squared                   87.51     using 59 bins.
 Reduced chi-squared =
# Null hypothesis probability of 5.79e-03 with 57 degrees of freedom

Energy  Fluence     90% Error
[keV]   [erg/cm2]   [erg/cm2]
15- 25  5.585e-08   7.380e-09
25- 50  9.505e-08   9.835e-09
50-150  2.367e-08   6.205e-09
15-150  1.746e-07   1.880e-08
Thermal bremsstrahlung (OTTB)
Spectral model: thermal bremsstrahlung
------------------------------------------------------------
Parameters  : value         Lower 90%    Upper 90%
kT [keV]    : 40.3452       (-7.73447      10.361)
Norm        : 28.3271       (-4.58286     5.63356)
------------------------------------------------------------
#Fit statistic  : Chi-Squared                   54.08     using 59 bins.
 Reduced chi-squared =
# Null hypothesis probability of 5.85e-01 with 57 degrees of freedom

Energy  Fluence     90% Error
[keV]   [erg/cm2]   [erg/cm2]
15- 25  6.524e-08   7.570e-09
25- 50  8.614e-08   7.725e-09
50-150  6.727e-08   1.721e-08
15-150  2.186e-07   2.170e-08
Double BB

Spectral model: bbodyrad<1> + bbodyrad<2>
------------------------------------------------------------
Parameters  : value         Lower 90%    Upper 90%
kT1 [keV]   : 5.54483        (-0.972514      0.959679)
R1^2/D10^2  : 17.9464        (-8.39352      20.7879)
kT2 [keV]   : 21.6655        (-6.3442      12.0883)
R2^2/D10^2  : 5.35165E-02    (-0.0425275   0.168452)
------------------------------------------------------------
#Fit statistic  : Chi-Squared                   48.77     using 59 bins.
 Reduced chi-squared =
# Null hypothesis probability of 7.10e-01 with 55 degrees of freedom

Energy  Fluence     90% Error
[keV]   [erg/cm2]   [erg/cm2]
15- 25  6.874e-08   3.627e-08
25- 50  7.299e-08   3.731e-08
50-150  6.880e-08   3.957e-08
15-150  2.105e-07   1.021e-07
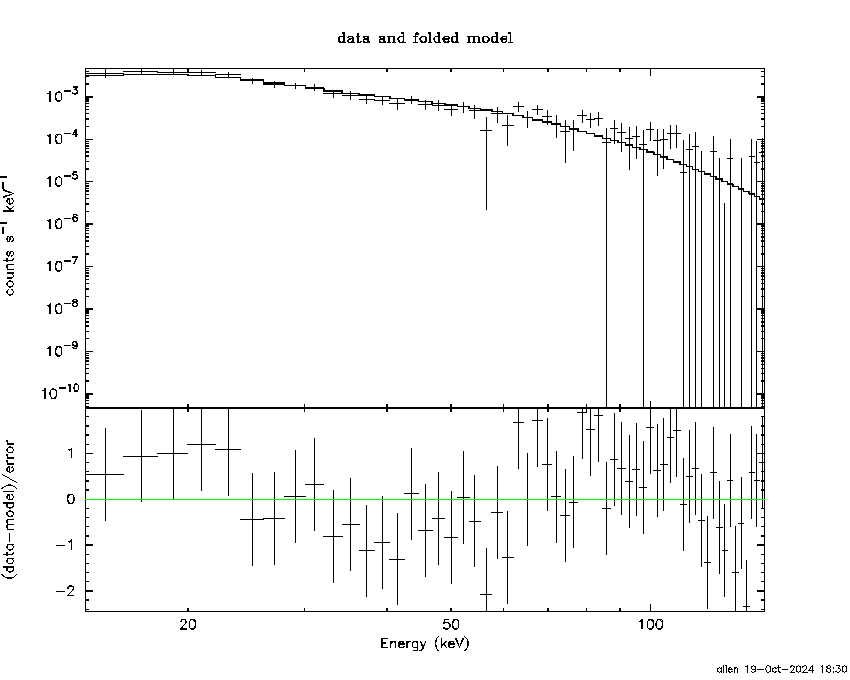
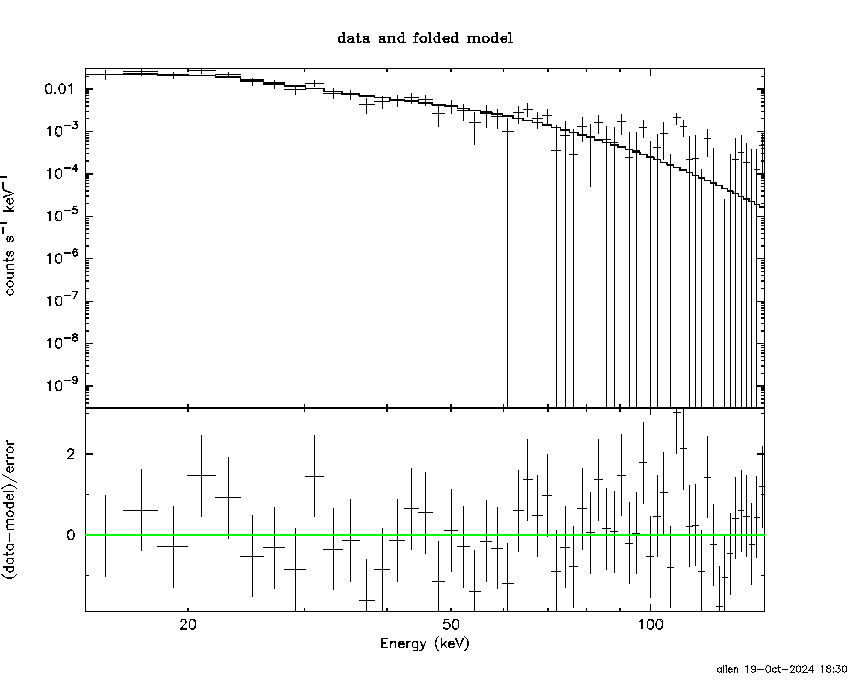
Pre-slew spectrum (Pre-slew PHA with pre-slew DRM)
Power-law model

Spectral model in power-law:
------------------------------------------------------------
Parameters  : value       lower 90%   higher 90%
Photon index: 2.28650     ( -0.133511   0.138616 )
Norm@50keV  : 4.12121E-03    ( -0.000354428   0.000348378 )
------------------------------------------------------------
#Fit statistic  : Chi-Squared                   44.47     using 59 bins.
 Reduced chi-squared =
# Null hypothesis probability of 8.87e-01 with 57 degrees of freedom

Photon flux (15-150 keV)    in 38.21 sec: 0.714848 ( -0.0446635  0.0447859 ) ph/cm2/s
Energy fluence (15-150 keV)             : 1.50114e-06 ( -1.04956e-07  1.06333e-07 ) ergs/cm2
Cutoff power-law model
Spectral model in the cutoff power-law:
------------------------------------------------------------
Parameters  : value       lower 90%   higher 90%
Photon index: 1.99345     ( -0.22168   -1.99345 )
Epeak [keV] : 1.03471      ( -0.382261 1.09881 )
Norm@50keV  : 5.89101E-03    ( -0.000764937   0.000895015 )
------------------------------------------------------------
#Fit statistic  : Chi-Squared                   46.48     using 59 bins.
 Reduced chi-squared =
# Null hypothesis probability of 8.14e-01 with 56 degrees of freedom

Photon flux (15-150 keV)    in 38.21 sec: 0.714510 (    ) ph/cm2/s
Energy fluence (15-150 keV)             : 1.49751e-06 ( -1.0865e-07  1.08394e-07 ) ergs/cm2
Band function

Spectral model in the Band function:
------------------------------------------------------------
Parameters  : value       lower 90%   higher 90%
alpha       :    (     )
beta        :     (     )
Epeak [keV] :       (   )
Norm@50keV   :     (     )
------------------------------------------------------------

Photon flux (15-150 keV)    in  sec:  (    ) ph/cm2/s
Energy fluence (15-150 keV)             : 0 ( 0  0 ) ergs/cm2
S(25-50 keV) vs. S(50-100 keV) plot
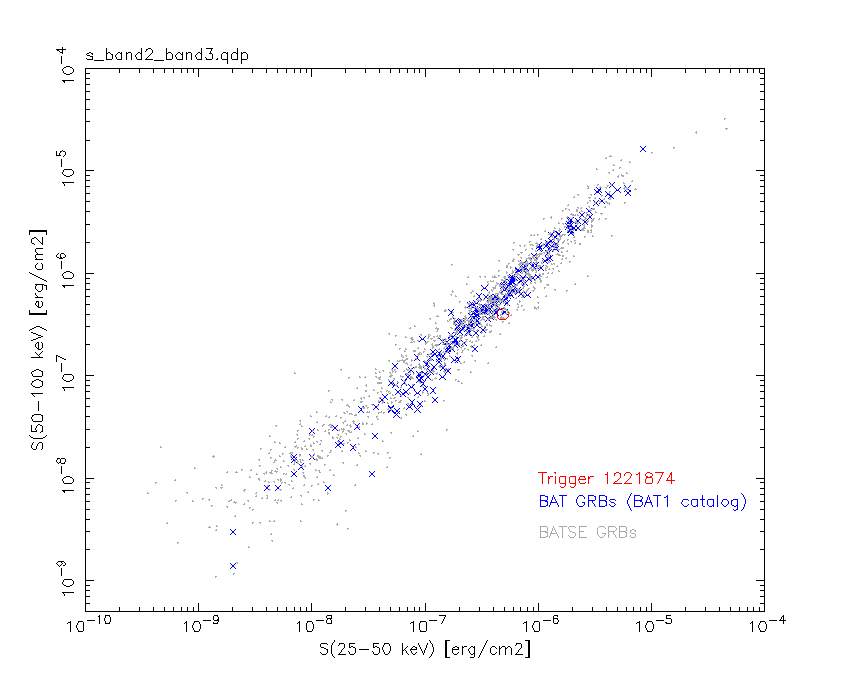
S(25-50 keV)  = 4.85e-07
S(50-100 keV) = 3.97e-07
T90 vs. Hardness ratio plot
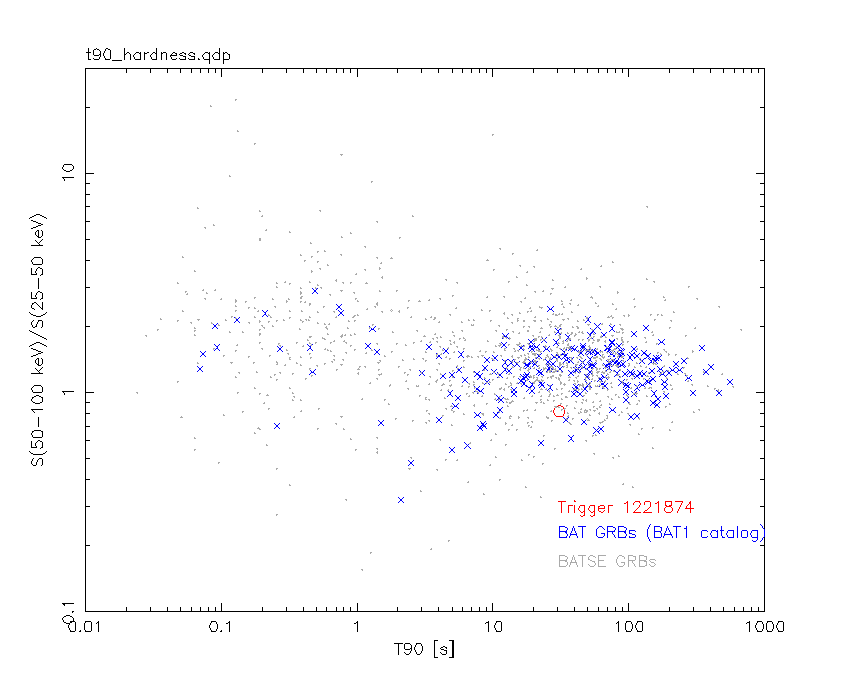
T90                                   = 30.8000000715256 sec.
Hardness ratio (energy fluence ratio) = 0.818557
Color vs. Color plot
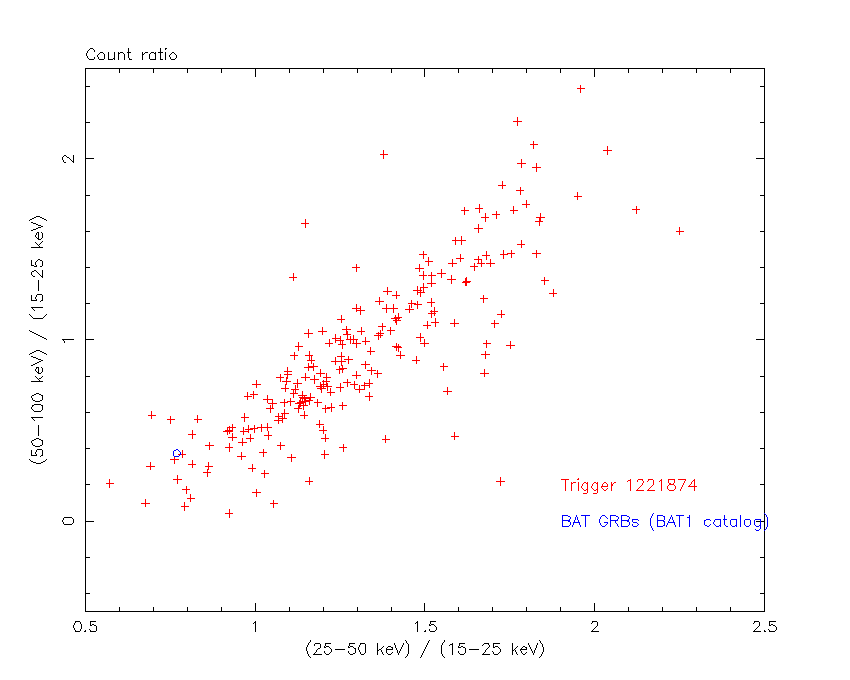
Count Ratio  (25-50 keV) / (15-25 keV) = 0.768917
Count Ratio (50-100 keV) / (15-25 keV) = 0.374855
Mask shadow pattern
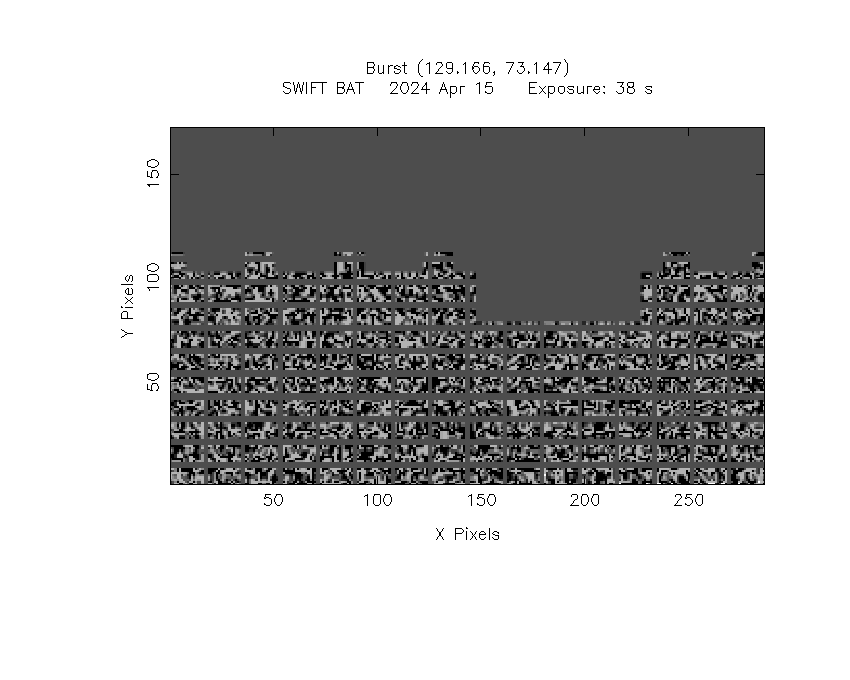
IMX = -1.847879492131420E-01, IMY = 4.774667470488252E-01
TIME vs. PHA plot around the trigger time
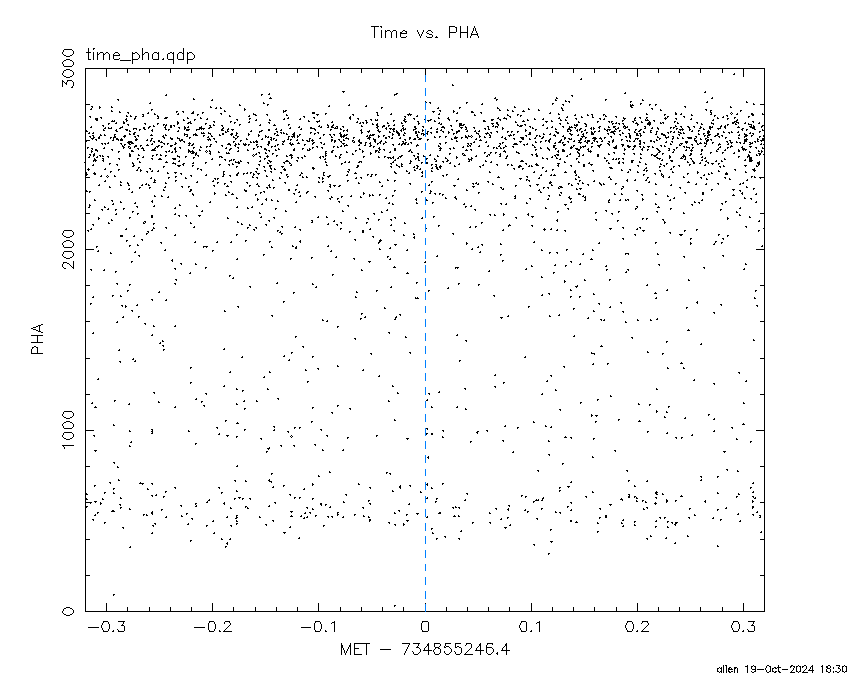
Blue+Cyan dotted lines: Time interval of the scaled map
From 0.000000 to 1.024000
TIME vs. DetID plot around the trigger time
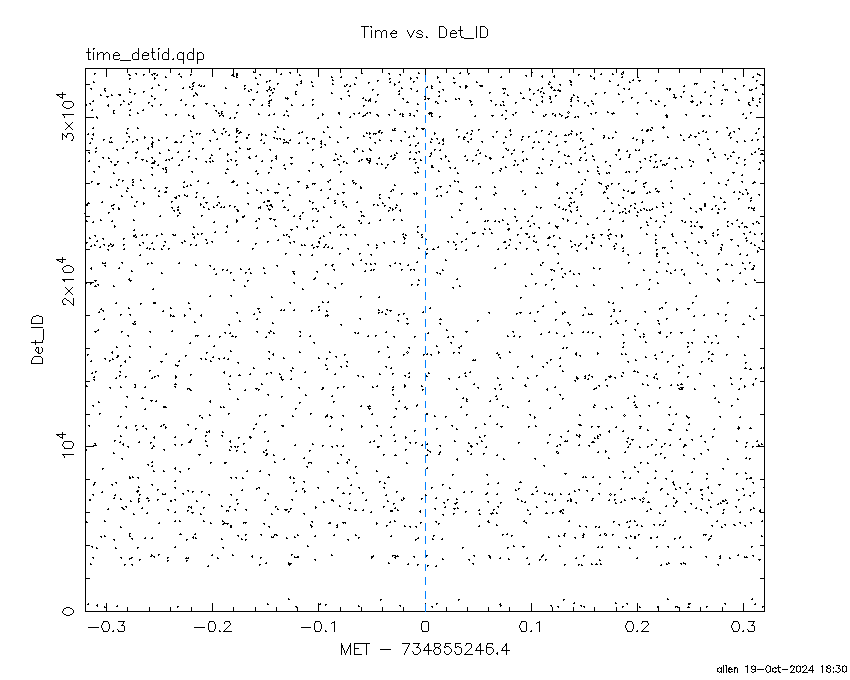
Blue+Cyan dotted lines: Time interval of the scaled map
From 0.000000 to 1.024000
100 us light curve (15-350 keV)

Blue+Cyan dotted lines: Time interval of the scaled map
From 0.000000 to 1.024000
Spacecraft aspect plot

Bright source in the pre-burst/pre-slew/post-slew images
Pre-burst image of 15-350 keV band
Time interval of the image:
-121.699400 -0.696000

# RAcent  DECcent POSerr Theta    Phi  PeakCts   SNR AngSep     Name
#  [deg]    [deg]    ['] [deg]  [deg]                   [']
254.5213  35.3615   12.3  50.3    4.4   0.4645   0.9    3.3	Her X-1
143.2516  33.9365    2.4  36.2  169.3   1.3085   4.8 ------	UNKNOWN
270.9871  37.8652    3.1  57.2   -9.9   4.2279   3.7 ------	UNKNOWN
Pre-slew background subtracted image of 15-350 keV band
Time interval of the image:
-0.696000 37.512000

# RAcent  DECcent POSerr Theta    Phi  PeakCts   SNR AngSep     Name
#  [deg]    [deg]    ['] [deg]  [deg]                   [']
254.4304  35.3786    7.2  50.2    4.5  -0.4676  -1.6    2.5	Her X-1
127.2250  19.4410    2.5  56.2  173.7   2.4191   4.5 ------	UNKNOWN
124.9071  26.9535    2.4  51.4 -178.8   1.1301   4.9 ------	UNKNOWN
252.7152  43.8262    2.4  43.3   -2.4   0.8201   4.8 ------	UNKNOWN
153.6306  68.1824    2.3  18.1 -117.8   0.4931   5.0 ------	UNKNOWN
129.1905  73.1549    0.4  27.1 -111.2   3.2112  27.1 ------	UNKNOWN
Post-slew image of 15-350 keV band
Time interval of the image:
Plot creation:
Sat Oct 19 18:30:36 EDT 2024