Estimated redshift from machine learning (Ukwatta et al. 2016) - may take a few minute to calcaulte
Image
Pre-slew 15.0-350.0 keV image (Event data)
#   RAcent    DECcent   POSerr    Theta     Phi              Peak Cts       SNR   Name
  325.8913     4.2324   0.0108    39.9619    11.8350         4.1081163     17.776 TRIG_01223072

Foreground time interval of the image:
-24.620  49.869 (delta_t =  74.489 [sec])
Background time interval of the image:
-79.931 -24.620 (delta_t =  55.311 [sec])
Lightcurves
Notes:
- 1) The mask-weighted light curves are using the flight position.
- 2) Multiple plots of different time binning/intervals are shown to cover all scenarios of short/long GRBs, rate/image triggers, and real/false positives.
- 3) For all the mask-weighted lightcurves, the y-axis units are counts/sec/det where a det is 0.4 x 0.4 = 0.16 sq cm.
- 4) The verticle lines correspond to following: green dotted lines are T50 interval, black dotted lines are T90 interval, blue solid line(s) is a spacecraft slew start time, and orange solid line(s) is a spacecraft slew end time.
- 5) Time of each bin is in the middle of the bin.
1 s binning
From T0-310 s to T0+310 s
From T100_start - 20 s to T100_end + 30 s
Full time interval

64 ms binning
Full time interval
From T100_start to T100_end

From T0-5 sec to T0+5 sec
16 ms binning
From T100_start-5 s to T100_start+5 s

Blue+Cyan dotted lines: Time interval of the scaled map
From 0.000000 to 4.096000
8 ms binning
From T100_start-3 s to T100_start+3 s
Blue+Cyan dotted lines: Time interval of the scaled map
From 0.000000 to 4.096000
2 ms binning
From T100_start-1 s to T100_start+1 s
Blue+Cyan dotted lines: Time interval of the scaled map
From 0.000000 to 4.096000
SN=5 or 10 sec. binning (whichever binning is satisfied first)

SN=5 or 10 sec. binning (T < 200 sec)

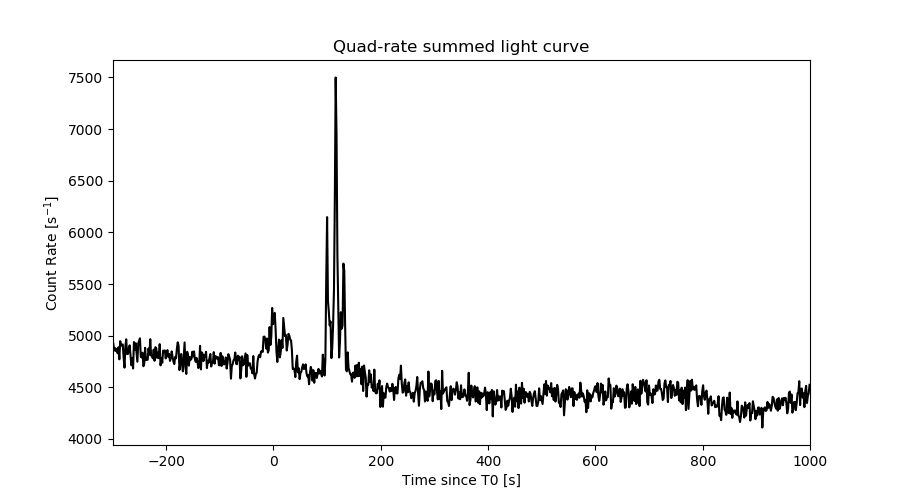
Quad-rate summed light curves (from T0-300s to T0+1000s)
Spectral Evolution

Spectra
Notes:
- 1) The fitting includes the systematic errors.
- 2) When the burst includes telescope slew time periods, the fitting uses an average response file made from multiple 5-s response files through out the slew time plus single time preiod for the non-slew times, and weighted by the total counts in the corresponding time period using addrmf. An average response file is needed becuase a spectral fit using the pre-slew DRM will introduce some errors in both a spectral shape and a normalization if the PHA file contains a lot of the slew/post-slew time interval.
- 3) For fits to more complicated models (e.g. a power-law over a cutoff power-law), the BAT team has decided to require a chi-square improvement of more than 6 for each extra dof.
Time averaged spectrum fit using the average DRM
Power-law model

Time interval is from  -24.620 sec. to  161.080 sec.

Spectral model in power-law:
------------------------------------------------------------
Parameters  : value       lower 90%   higher 90%
Photon index: 1.79909     ( -0.0857981   0.0867423 )
Norm@50keV  : 2.57317E-03    ( -0.000126587   0.00012584 )
------------------------------------------------------------
#Fit statistic  : Chi-Squared                   44.27     using 59 bins.
 Reduced chi-squared = 0.776667
# Null hypothesis probability of 8.91e-01 with 57 degrees of freedom

Photon flux (15-150 keV)    in 185.7 sec: 0.354469 ( -0.01688  0.016915 ) ph/cm2/s
Energy fluence (15-150 keV)             : 4.39979e-06 ( -2.20602e-07  2.21806e-07 ) ergs/cm2
Cutoff power-law model

Time interval is from  -24.620 sec. to  161.080 sec.
Spectral model in the cutoff power-law:
------------------------------------------------------------
Parameters  : value       lower 90%   higher 90%
Photon index: 1.63334     ( -0.343946   0.235639 )
Epeak [keV] : 104.956      ( -42.6992 -104.957 )
Norm@50keV  : 3.14206E-03    ( -0.000673442   0.00157133 )
------------------------------------------------------------
#Fit statistic  : Chi-Squared                   43.50     using 59 bins.
 Reduced chi-squared = 0.776786
# Null hypothesis probability of 8.89e-01 with 56 degrees of freedom

Photon flux (15-150 keV)    in 185.7 sec: 0.351013 ( -0.018115  0.01812 ) ph/cm2/s
Energy fluence (15-150 keV)             : 4.33283e-06 ( -2.55909e-07  2.49772e-07 ) ergs/cm2
Band function

Time interval is from  -24.620 sec. to  161.080 sec.


Spectral model in the Band function:
------------------------------------------------------------
Parameters  : value       lower 90%   higher 90%
alpha       :    (     )
beta        :     (     )
Epeak [keV] :       (   )
Norm@50keV   :     (     )
------------------------------------------------------------

Photon flux (15-150 keV)    in  sec:  (    ) ph/cm2/s
Energy fluence (15-150 keV)             : 0 ( 0  0 ) ergs/cm2
Single BB
Spectral model blackbody:
------------------------------------------------------------
Parameters  : value    Lower 90%  Upper 90%
kT [keV]    : 12.3197  (  )
R^2/D10^2   : 7.39754E-02  (   )
(R is the radius in km and D10 is the distance to the source in units of 10 kpc)
------------------------------------------------------------
#Fit statistic  : Chi-Squared                  161.90     using 59 bins.
 Reduced chi-squared =
# Null hypothesis probability of 5.46e-12 with 57 degrees of freedom

Energy  Fluence     90% Error
[keV]   [erg/cm2]   [erg/cm2]
15- 25  4.418e-07   3.965e-08
25- 50  1.433e-06   7.075e-08
50-150  1.331e-06   1.406e-07
15-150  3.206e-06   1.727e-07
Thermal bremsstrahlung (OTTB)
Spectral model: thermal bremsstrahlung
------------------------------------------------------------
Parameters  : value         Lower 90%    Upper 90%
kT [keV]    : 104.439       (-16.4568      27.9315)
Norm        : 1.53931       (-0.109947     0.104311)
------------------------------------------------------------
#Fit statistic  : Chi-Squared                   46.13     using 59 bins.
 Reduced chi-squared =
# Null hypothesis probability of 8.48e-01 with 57 degrees of freedom

Energy  Fluence     90% Error
[keV]   [erg/cm2]   [erg/cm2]
15- 25  7.471e-07   6.249e-08
25- 50  1.303e-06   7.242e-08
50-150  2.163e-06   5.841e-07
15-150  4.213e-06   6.342e-07
Double BB

Spectral model: bbodyrad<1> + bbodyrad<2>
------------------------------------------------------------
Parameters  : value         Lower 90%    Upper 90%
kT1 [keV]   : 6.63232        (-0.902133      0.979157)
R1^2/D10^2  : 0.533069        (-0.202521      0.373737)
kT2 [keV]   : 24.7936        (-3.97647      6.24439)
R2^2/D10^2  : 4.20120E-03    (-0.0023279   0.00400063)
------------------------------------------------------------
#Fit statistic  : Chi-Squared                   44.47     using 59 bins.
 Reduced chi-squared =
# Null hypothesis probability of 8.44e-01 with 55 degrees of freedom

Energy  Fluence     90% Error
[keV]   [erg/cm2]   [erg/cm2]
15- 25  7.428e-07   1.040e-07
25- 50  1.284e-06   1.494e-07
50-150  2.267e-06   5.109e-07
15-150  4.294e-06   6.091e-07
Peak spectrum fit
Power-law model

Time interval is from  116.284 sec. to  117.284 sec.

Spectral model in power-law:
------------------------------------------------------------
Parameters  : value       lower 90%   higher 90%
Photon index: 1.58624     ( -0.138439   0.14122 )
Norm@50keV  : 1.62217E-02    ( -0.00139728   0.00138554 )
------------------------------------------------------------
#Fit statistic  : Chi-Squared                   56.03     using 59 bins.
 Reduced chi-squared = 0.982982
# Null hypothesis probability of 5.11e-01 with 57 degrees of freedom

Photon flux (15-150 keV)    in 1 sec: 2.07584 ( -0.16821  0.16832 ) ph/cm2/s
Energy fluence (15-150 keV)             : 1.51988e-07 ( -1.41148e-08  1.42805e-08 ) ergs/cm2
Cutoff power-law model
Time interval is from  116.284 sec. to  117.284 sec.
Spectral model in the cutoff power-law:
------------------------------------------------------------
Parameters  : value       lower 90%   higher 90%
Photon index: 0.825574     ( -0.727336   0.617601 )
Epeak [keV] : 73.5289      ( -16.4939 103.308 )
Norm@50keV  : 4.06429E-02    ( -0.0210435   0.0559821 )
------------------------------------------------------------
#Fit statistic  : Chi-Squared                   51.50     using 59 bins.
 Reduced chi-squared = 0.919643
# Null hypothesis probability of 6.46e-01 with 56 degrees of freedom

Photon flux (15-150 keV)    in 1 sec: 2.01023 ( -0.17756  0.17654 ) ph/cm2/s
Energy fluence (15-150 keV)             : 1.42702e-07 ( -1.58784e-08  1.61234e-08 ) ergs/cm2
Band function

Time interval is from  116.284 sec. to  117.284 sec.


Spectral model in the Band function:
------------------------------------------------------------
Parameters  : value       lower 90%   higher 90%
alpha       :    (     )
beta        :     (     )
Epeak [keV] :       (   )
Norm@50keV   :     (     )
------------------------------------------------------------

Photon flux (15-150 keV)    in  sec:  (    ) ph/cm2/s
Energy fluence (15-150 keV)             : 0 ( 0  0 ) ergs/cm2
Single BB
Spectral model blackbody:
------------------------------------------------------------
Parameters  : value    Lower 90%  Upper 90%
kT [keV]    : 13.5833  (-1.22796  1.36828)
R^2/D10^2   : 0.335309  (-0.0975973   0.135045)
(R is the radius in km and D10 is the distance to the source in units of 10 kpc)
------------------------------------------------------------
#Fit statistic  : Chi-Squared                   70.76     using 59 bins.
 Reduced chi-squared =
# Null hypothesis probability of 1.04e-01 with 57 degrees of freedom

Energy  Fluence     90% Error
[keV]   [erg/cm2]   [erg/cm2]
15- 25  1.310e-08   1.825e-09
25- 50  4.725e-08   4.670e-09
50-150  5.650e-08   9.200e-09
15-150  1.169e-07   1.280e-08
Thermal bremsstrahlung (OTTB)

Spectral model: thermal bremsstrahlung
------------------------------------------------------------
Parameters  : value         Lower 90%    Upper 90%
kT [keV]    : 168.457       (-54.4216      -168.456)
Norm        : 8.55261       (-0.732192     0.816806)
------------------------------------------------------------
#Fit statistic  : Chi-Squared                   52.82     using 59 bins.
 Reduced chi-squared =
# Null hypothesis probability of 6.33e-01 with 57 degrees of freedom

Energy  Fluence     90% Error
[keV]   [erg/cm2]   [erg/cm2]
15- 25  2.173e-08   3.085e-09
25- 50  4.092e-08   1.257e-08
50-150  8.457e-08   4.175e-08
15-150  1.472e-07   5.146e-08
Double BB
Spectral model: bbodyrad<1> + bbodyrad<2>
------------------------------------------------------------
Parameters  : value         Lower 90%    Upper 90%
kT1 [keV]   : 4.71385        (-2.33692      6.54349)
R1^2/D10^2  : 6.70863        (-5.86997      194.433)
kT2 [keV]   : 17.1735        (-2.96622      51.6196)
R2^2/D10^2  : 0.127153    (-0.122871   0.140098)
------------------------------------------------------------
#Fit statistic  : Chi-Squared                   54.17     using 59 bins.
 Reduced chi-squared =
# Null hypothesis probability of 5.06e-01 with 55 degrees of freedom

Energy  Fluence     90% Error
[keV]   [erg/cm2]   [erg/cm2]
15- 25  2.043e-08   9.130e-09
25- 50  4.118e-08   1.114e-08
50-150  7.198e-08   2.140e-08
15-150  1.336e-07   3.293e-08
Pre-slew spectrum (Pre-slew PHA with pre-slew DRM)
Power-law model

Spectral model in power-law:
------------------------------------------------------------
Parameters  : value       lower 90%   higher 90%
Photon index: 1.73537     ( -0.118168   0.119843 )
Norm@50keV  : 3.21587E-03    ( -0.000236018   0.000234313 )
------------------------------------------------------------
#Fit statistic  : Chi-Squared                   45.39     using 59 bins.
 Reduced chi-squared =
# Null hypothesis probability of 8.66e-01 with 57 degrees of freedom

Photon flux (15-150 keV)    in 74.49 sec: 0.432518 ( -0.0303678  0.0304074 ) ph/cm2/s
Energy fluence (15-150 keV)             : 2.21238e-06 ( -1.67881e-07  1.68952e-07 ) ergs/cm2
Cutoff power-law model
Spectral model in the cutoff power-law:
------------------------------------------------------------
Parameters  : value       lower 90%   higher 90%
Photon index: 1.24351     ( -0.540779   0.474914 )
Epeak [keV] : 71.3529      ( -17.4694 359.702 )
Norm@50keV  : 5.91273E-03    ( -0.00257817   0.00553052 )
------------------------------------------------------------
#Fit statistic  : Chi-Squared                   42.25     using 59 bins.
 Reduced chi-squared =
# Null hypothesis probability of 9.13e-01 with 56 degrees of freedom

Photon flux (15-150 keV)    in 74.49 sec: 0.424069 ( -0.031482  0.031467 ) ph/cm2/s
Energy fluence (15-150 keV)             : 2.12445e-06 ( -1.89644e-07  1.89689e-07 ) ergs/cm2
Band function
Spectral model in the Band function:
------------------------------------------------------------
Parameters  : value       lower 90%   higher 90%
alpha       :    (     )
beta        :     (     )
Epeak [keV] :       (   )
Norm@50keV   :     (     )
------------------------------------------------------------

Photon flux (15-150 keV)    in  sec:  (    ) ph/cm2/s
Energy fluence (15-150 keV)             : 0 ( 0  0 ) ergs/cm2
S(25-50 keV) vs. S(50-100 keV) plot

S(25-50 keV)  = 1.24e-06
S(50-100 keV) = 1.42e-06
T90 vs. Hardness ratio plot

T90                                   = 144.551999926567 sec.
Hardness ratio (energy fluence ratio) = 1.14516
Color vs. Color plot
Count Ratio  (25-50 keV) / (15-25 keV) = 1.15606
Count Ratio (50-100 keV) / (15-25 keV) = 0.700622
Mask shadow pattern
IMX = 8.201534568808309E-01, IMY = -1.718620511270201E-01
TIME vs. PHA plot around the trigger time
Blue+Cyan dotted lines: Time interval of the scaled map
From 0.000000 to 4.096000
TIME vs. DetID plot around the trigger time
Blue+Cyan dotted lines: Time interval of the scaled map
From 0.000000 to 4.096000
100 us light curve (15-350 keV)

Blue+Cyan dotted lines: Time interval of the scaled map
From 0.000000 to 4.096000
Spacecraft aspect plot
Bright source in the pre-burst/pre-slew/post-slew images
Pre-burst image of 15-350 keV band
Time interval of the image:
-79.931400 -24.620000

# RAcent  DECcent POSerr Theta    Phi  PeakCts   SNR AngSep     Name
#  [deg]    [deg]    ['] [deg]  [deg]                   [']
299.5286  35.1882    1.7  35.5   78.3   1.8217   6.7    3.1	Cyg X-1
308.0528  40.8775    5.0  27.4   85.0   0.4017   2.3    5.2	Cyg X-3
326.1010  38.2495    6.0  14.3   69.0  -0.2039  -1.9    5.5	Cyg X-2
 73.5927  66.3009    2.2  53.2 -167.6   1.4418   5.2 ------	UNKNOWN
354.3809  15.1999    2.4  26.8  -39.5   0.5435   4.9 ------	UNKNOWN
Pre-slew background subtracted image of 15-350 keV band
Time interval of the image:
-24.620000 49.868600

# RAcent  DECcent POSerr Theta    Phi  PeakCts   SNR AngSep     Name
#  [deg]    [deg]    ['] [deg]  [deg]                   [']
299.8047  35.1015    0.0  35.3   78.0   0.4089   1.2   12.1	Cyg X-1
307.9345  40.8052    0.0  27.5   84.9  -0.3010  -1.3   11.9	Cyg X-3
326.1204  38.2628    4.1  14.3   69.0   0.4388   2.9    4.3	Cyg X-2
325.8914   4.2324    0.6  40.0   11.8   4.1082  17.8 ------	UNKNOWN
Post-slew image of 15-350 keV band
Time interval of the image:
136.068600 789.368600

# RAcent  DECcent POSerr Theta    Phi  PeakCts   SNR AngSep     Name
#  [deg]    [deg]    ['] [deg]  [deg]                   [']
288.6883  11.0373    6.8  37.4  113.6  -4.0901  -1.7    8.5	GRS 1915+105
299.5946  35.2141    0.7  39.4  156.2  21.7101  15.5    0.8	Cyg X-1
308.1266  40.9169    5.6  40.0  169.9   2.8280   2.0    2.3	Cyg X-3
326.1665  38.4720    8.7  34.3 -168.7  -1.2450  -1.3    9.0	Cyg X-2
307.5750 -38.1965    3.0  45.7   31.1   7.4645   3.8 ------	UNKNOWN
340.1664  62.5746    3.1  59.3 -161.5  22.6625   3.7 ------	UNKNOWN
  3.2929  38.1649    3.1  48.1 -129.1  14.4155   3.7 ------	UNKNOWN
Plot creation:
Sat Oct 19 18:28:40 EDT 2024