Special notes of this burst
Image
Pre-slew 15.0-350.0 keV image (Event data)
#   RAcent    DECcent   POSerr    Theta     Phi              Peak Cts       SNR   Name
  336.6685     8.5142   0.0037    28.3846  -173.5370         9.1260616     51.764 TRIG_01227767

Foreground time interval of the image:
-92.012 -13.852 (delta_t =  78.160 [sec])
-12.656 -12.426 (delta_t =   0.230 [sec])
-11.656 -11.546 (delta_t =   0.110 [sec])
-10.656   8.174 (delta_t =  18.830 [sec])
 21.344  24.845 (delta_t =   3.501 [sec])
Background time interval of the image:
-239.656 -92.012 (delta_t = 147.644 [sec])
Lightcurves
Notes:
- 1) The mask-weighted light curves are using the flight position.
- 2) Multiple plots of different time binning/intervals are shown to cover all scenarios of short/long GRBs, rate/image triggers, and real/false positives.
- 3) For all the mask-weighted lightcurves, the y-axis units are counts/sec/det where a det is 0.4 x 0.4 = 0.16 sq cm.
- 4) The verticle lines correspond to following: green dotted lines are T50 interval, black dotted lines are T90 interval, blue solid line(s) is a spacecraft slew start time, and orange solid line(s) is a spacecraft slew end time.
- 5) Time of each bin is in the middle of the bin.
1 s binning
From T0-310 s to T0+310 s
From T100_start - 20 s to T100_end + 30 s
Full time interval

64 ms binning
Full time interval

From T100_start to T100_end
From T0-5 sec to T0+5 sec

16 ms binning
From T100_start-5 s to T100_start+5 s

8 ms binning
From T100_start-3 s to T100_start+3 s
2 ms binning
From T100_start-1 s to T100_start+1 s

SN=5 or 10 sec. binning (whichever binning is satisfied first)
SN=5 or 10 sec. binning (T < 200 sec)

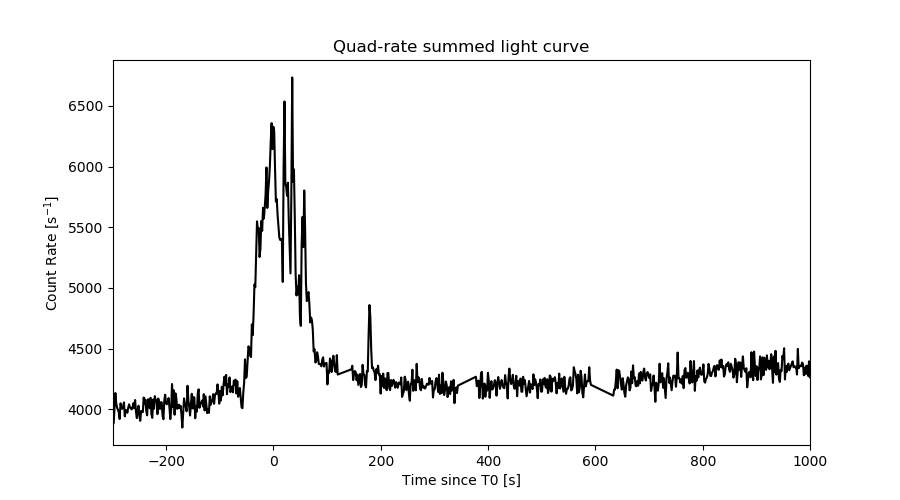
Quad-rate summed light curves (from T0-300s to T0+1000s)
Spectral Evolution

Spectra
Notes:
- 1) The fitting includes the systematic errors.
- 2) When the burst includes telescope slew time periods, the fitting uses an average response file made from multiple 5-s response files through out the slew time plus single time preiod for the non-slew times, and weighted by the total counts in the corresponding time period using addrmf. An average response file is needed becuase a spectral fit using the pre-slew DRM will introduce some errors in both a spectral shape and a normalization if the PHA file contains a lot of the slew/post-slew time interval.
- 3) For fits to more complicated models (e.g. a power-law over a cutoff power-law), the BAT team has decided to require a chi-square improvement of more than 6 for each extra dof.
Time averaged spectrum fit using the average DRM
Power-law model
Multiple GTIs in the spectrum
tstart tstop
-92.012000 -13.851700
-12.656000 -12.426000
-11.656000 -11.546000
-10.656000 8.174000
21.344000 155.994000
157.344000 157.454000
158.344000 158.584000
159.344000 159.924000
180.344000 203.704000

Spectral model in power-law:
------------------------------------------------------------
Parameters  : value       lower 90%   higher 90%
Photon index: 1.58165     ( -0.042186   0.0421925 )
Norm@50keV  : 4.39358E-03    ( -9.55954e-05   9.55953e-05 )
------------------------------------------------------------
#Fit statistic  : Chi-Squared                   42.73     using 59 bins.
 Reduced chi-squared = 0.749649
# Null hypothesis probability of 9.20e-01 with 57 degrees of freedom

Photon flux (15-150 keV)    in 256.3 sec: 0.561451 ( -0.014184  0.014242 ) ph/cm2/s
Energy fluence (15-150 keV)             : 1.05569e-05 ( -2.36259e-07  2.36214e-07 ) ergs/cm2
Cutoff power-law model

Multiple GTIs in the spectrum
tstart tstop
-92.012000 -13.851700
-12.656000 -12.426000
-11.656000 -11.546000
-10.656000 8.174000
21.344000 155.994000
157.344000 157.454000
158.344000 158.584000
159.344000 159.924000
180.344000 203.704000
Spectral model in the cutoff power-law:
------------------------------------------------------------
Parameters  : value       lower 90%   higher 90%
Photon index: 1.40316     ( -0.17447   0.167626 )
Epeak [keV] : 185.591      ( -64.74 2380.65 )
Norm@50keV  : 5.28886E-03    ( -0.000811855   0.00102247 )
------------------------------------------------------------
#Fit statistic  : Chi-Squared                   39.45     using 59 bins.
 Reduced chi-squared = 0.704464
# Null hypothesis probability of 9.54e-01 with 56 degrees of freedom

Photon flux (15-150 keV)    in 256.3 sec: 0.552947 ( -0.01607  0.01617 ) ph/cm2/s
Energy fluence (15-150 keV)             : 1.04287e-05 ( -2.65278e-07  2.64309e-07 ) ergs/cm2
Band function

Multiple GTIs in the spectrum
tstart tstop
-92.012000 -13.851700
-12.656000 -12.426000
-11.656000 -11.546000
-10.656000 8.174000
21.344000 155.994000
157.344000 157.454000
158.344000 158.584000
159.344000 159.924000
180.344000 203.704000


Spectral model in the Band function:
------------------------------------------------------------
Parameters  : value       lower 90%   higher 90%
alpha       :    (     )
beta        :     (     )
Epeak [keV] :       (   )
Norm@50keV   :     (     )
------------------------------------------------------------

Photon flux (15-150 keV)    in  sec:  (    ) ph/cm2/s
Energy fluence (15-150 keV)             : 0 ( 0  0 ) ergs/cm2
Single BB

Spectral model blackbody:
------------------------------------------------------------
Parameters  : value    Lower 90%  Upper 90%
kT [keV]    : 16.3244  (  )
R^2/D10^2   : 4.41784E-02  (   )
(R is the radius in km and D10 is the distance to the source in units of 10 kpc)
------------------------------------------------------------
#Fit statistic  : Chi-Squared                  466.77     using 59 bins.
 Reduced chi-squared =
# Null hypothesis probability of 1.15e-65 with 57 degrees of freedom

Energy  Fluence     90% Error
[keV]   [erg/cm2]   [erg/cm2]
15- 25  6.210e-07   2.947e-08
25- 50  2.658e-06   8.073e-08
50-150  4.988e-06   1.986e-07
15-150  8.267e-06   2.050e-07
Thermal bremsstrahlung (OTTB)
Spectral model: thermal bremsstrahlung
------------------------------------------------------------
Parameters  : value         Lower 90%    Upper 90%
kT [keV]    : 200.000       (-16.1176      -200)
Norm        : 2.25628       (-0.0490902     0.0490902)
------------------------------------------------------------
#Fit statistic  : Chi-Squared                   41.62     using 59 bins.
 Reduced chi-squared =
# Null hypothesis probability of 9.37e-01 with 57 degrees of freedom

Energy  Fluence     90% Error
[keV]   [erg/cm2]   [erg/cm2]
15- 25  1.441e-06   3.985e-08
25- 50  2.771e-06   7.048e-08
50-150  6.077e-06   1.538e-07
15-150  1.029e-05   2.512e-07
Double BB
Spectral model: bbodyrad<1> + bbodyrad<2>
------------------------------------------------------------
Parameters  : value         Lower 90%    Upper 90%
kT1 [keV]   : 8.21513        (-0.640255      0.662153)
R1^2/D10^2  : 0.339655        (-0.0758764      0.106487)
kT2 [keV]   : 30.2956        (-2.76697      3.59306)
R2^2/D10^2  : 3.86417E-03    (-0.00124943   0.00160783)
------------------------------------------------------------
#Fit statistic  : Chi-Squared                   46.36     using 59 bins.
 Reduced chi-squared =
# Null hypothesis probability of 7.90e-01 with 55 degrees of freedom

Energy  Fluence     90% Error
[keV]   [erg/cm2]   [erg/cm2]
15- 25  1.224e-06   9.214e-08
25- 50  2.859e-06   1.320e-07
50-150  6.222e-06   4.447e-07
15-150  1.030e-05   5.805e-07
Peak spectrum fit
Power-law model

Time interval is from   35.148 sec. to   36.148 sec.

Spectral model in power-law:
------------------------------------------------------------
Parameters  : value       lower 90%   higher 90%
Photon index: 1.43659     ( -0.130348   0.13097 )
Norm@50keV  : 2.09284E-02    ( -0.00163986   0.00163574 )
------------------------------------------------------------
#Fit statistic  : Chi-Squared                   60.62     using 59 bins.
 Reduced chi-squared = 1.06351
# Null hypothesis probability of 3.47e-01 with 57 degrees of freedom

Photon flux (15-150 keV)    in 1 sec: 2.57072 ( -0.20277  0.20296 ) ph/cm2/s
Energy fluence (15-150 keV)             : 2.00798e-07 ( -1.72372e-08  1.73444e-08 ) ergs/cm2
Cutoff power-law model
Time interval is from   35.148 sec. to   36.148 sec.
Spectral model in the cutoff power-law:
------------------------------------------------------------
Parameters  : value       lower 90%   higher 90%
Photon index: 1.22001     ( -0.554746   0.287691 )
Epeak [keV] : 182.912      ( -182.933 -182.933 )
Norm@50keV  : 2.69440E-02    ( -0.00741363   0.0237355 )
------------------------------------------------------------
#Fit statistic  : Chi-Squared                   60.09     using 59 bins.
 Reduced chi-squared = 1.07304
# Null hypothesis probability of 3.30e-01 with 56 degrees of freedom

Photon flux (15-150 keV)    in 1 sec: 2.55294 ( -0.20712  0.20704 ) ph/cm2/s
Energy fluence (15-150 keV)             : 1.98089e-07 ( -1.86363e-08  1.8437e-08 ) ergs/cm2
Band function

Time interval is from   35.148 sec. to   36.148 sec.


Spectral model in the Band function:
------------------------------------------------------------
Parameters  : value       lower 90%   higher 90%
alpha       :    (     )
beta        :     (     )
Epeak [keV] :       (   )
Norm@50keV   :     (     )
------------------------------------------------------------

Photon flux (15-150 keV)    in  sec:  (    ) ph/cm2/s
Energy fluence (15-150 keV)             : 0 ( 0  0 ) ergs/cm2
Single BB
Spectral model blackbody:
------------------------------------------------------------
Parameters  : value    Lower 90%  Upper 90%
kT [keV]    : 15.2901  (-1.49136  1.68526)
R^2/D10^2   : 0.279037  (-0.0857059   0.120619)
(R is the radius in km and D10 is the distance to the source in units of 10 kpc)
------------------------------------------------------------
#Fit statistic  : Chi-Squared                   99.34     using 59 bins.
 Reduced chi-squared =
# Null hypothesis probability of 4.40e-04 with 57 degrees of freedom

Energy  Fluence     90% Error
[keV]   [erg/cm2]   [erg/cm2]
15- 25  1.361e-08   2.065e-09
25- 50  5.504e-08   5.370e-09
50-150  8.831e-08   1.411e-08
15-150  1.570e-07   1.550e-08
Thermal bremsstrahlung (OTTB)
Spectral model: thermal bremsstrahlung
------------------------------------------------------------
Parameters  : value         Lower 90%    Upper 90%
kT [keV]    : 200.000       (-35.4724      -200)
Norm        : 10.6170       (-0.81861     0.81861)
------------------------------------------------------------
#Fit statistic  : Chi-Squared                   62.32     using 59 bins.
 Reduced chi-squared =
# Null hypothesis probability of 2.93e-01 with 57 degrees of freedom

Energy  Fluence     90% Error
[keV]   [erg/cm2]   [erg/cm2]
15- 25  2.644e-08   2.360e-09
25- 50  5.086e-08   5.640e-09
50-150  1.116e-07   3.783e-08
15-150  1.889e-07   5.128e-08
Double BB

Spectral model: bbodyrad<1> + bbodyrad<2>
------------------------------------------------------------
Parameters  : value         Lower 90%    Upper 90%
kT1 [keV]   : 8.56309        (-2.04468      2.34577)
R1^2/D10^2  : 1.44722        (-0.725943      1.71891)
kT2 [keV]   : 35.0054        (-10.9992      52.5391)
R2^2/D10^2  : 1.22581E-02    (-0.0109099   0.0285083)
------------------------------------------------------------
#Fit statistic  : Chi-Squared                   59.67     using 59 bins.
 Reduced chi-squared =
# Null hypothesis probability of 3.10e-01 with 55 degrees of freedom

Energy  Fluence     90% Error
[keV]   [erg/cm2]   [erg/cm2]
15- 25  2.222e-08   6.165e-09
25- 50  5.334e-08   1.327e-08
50-150  1.244e-07   5.799e-08
15-150  2.000e-07   7.355e-08
Pre-slew spectrum (Pre-slew PHA with pre-slew DRM)
Power-law model
Spectral model in power-law:
------------------------------------------------------------
Parameters  : value       lower 90%   higher 90%
Photon index: 1.38736     ( -0.0464571   0.0463426 )
Norm@50keV  : 6.28078E-03    ( -0.000155386   0.000155344 )
------------------------------------------------------------
#Fit statistic  : Chi-Squared                   40.67     using 59 bins.
 Reduced chi-squared =
# Null hypothesis probability of 9.50e-01 with 57 degrees of freedom

Photon flux (15-150 keV)    in 100.8 sec: 0.762717 ( -0.021116  0.0211816 ) ph/cm2/s
Energy fluence (15-150 keV)             : 6.13348e-06 ( -1.57227e-07  1.57354e-07 ) ergs/cm2
Cutoff power-law model
Spectral model in the cutoff power-law:
------------------------------------------------------------
Parameters  : value       lower 90%   higher 90%
Photon index: 1.20065     ( -0.188224   0.175004 )
Epeak [keV] : 244.667      ( -93.9355 2719.8 )
Norm@50keV  : 7.59438E-03    ( -0.00124952   0.00155321 )
------------------------------------------------------------
#Fit statistic  : Chi-Squared                   37.57     using 59 bins.
 Reduced chi-squared =
# Null hypothesis probability of 9.72e-01 with 56 degrees of freedom

Photon flux (15-150 keV)    in 100.8 sec: 0.752346 ( -0.023124  0.023221 ) ph/cm2/s
Energy fluence (15-150 keV)             : 6.07159e-06 ( -1.70342e-07  1.69445e-07 ) ergs/cm2
Band function

Spectral model in the Band function:
------------------------------------------------------------
Parameters  : value       lower 90%   higher 90%
alpha       :    (     )
beta        :     (     )
Epeak [keV] :       (   )
Norm@50keV   :     (     )
------------------------------------------------------------

Photon flux (15-150 keV)    in  sec:  (    ) ph/cm2/s
Energy fluence (15-150 keV)             : 0 ( 0  0 ) ergs/cm2
S(25-50 keV) vs. S(50-100 keV) plot

S(25-50 keV)  = 2.72e-06
S(50-100 keV) = 3.64e-06
T90 vs. Hardness ratio plot

T90                                   = 148.536000013351 sec.
Hardness ratio (energy fluence ratio) = 1.33824
Color vs. Color plot
Count Ratio  (25-50 keV) / (15-25 keV) = 1.32947
Count Ratio (50-100 keV) / (15-25 keV) = 0.9567
Mask shadow pattern
IMX = -5.369171108225050E-01, IMY = 6.082231970598598E-02
TIME vs. PHA plot around the trigger time
TIME vs. DetID plot around the trigger time
100 us light curve (15-350 keV)
Spacecraft aspect plot
Bright source in the pre-burst/pre-slew/post-slew images
Pre-burst image of 15-350 keV band
Time interval of the image:
-239.656000 -92.012000

# RAcent  DECcent POSerr Theta    Phi  PeakCts   SNR AngSep     Name
#  [deg]    [deg]    ['] [deg]  [deg]                   [']
309.7853 -32.6420    4.3  32.1   77.4   1.0743   2.7 ------	UNKNOWN
331.7526  29.0190    2.5  49.4 -173.8   2.2340   4.6 ------	UNKNOWN
349.1950  26.9756    2.1  46.7 -153.2   2.2087   5.5 ------	UNKNOWN
Pre-slew background subtracted image of 15-350 keV band
Time interval of the image:
-92.012000 -13.851700
-12.656000 -12.426000
-11.656000 -11.546000
-10.656000 8.174000
21.344000 24.844590

# RAcent  DECcent POSerr Theta    Phi  PeakCts   SNR AngSep     Name
#  [deg]    [deg]    ['] [deg]  [deg]                   [']
336.6685   8.5142    0.2  28.4 -173.5   9.1261  51.8 ------	UNKNOWN
Post-slew image of 15-350 keV band
Time interval of the image:
91.044580 155.994000
157.344000 157.454000
158.344000 158.584000
159.344000 159.924000
180.344000 232.454000
233.344000 327.594000
328.344000 647.330200
660.344000 712.104000
720.344000 758.434000
765.344000 773.984000
780.344000 799.153200
800.344000 809.964000
817.344000 822.834000
829.344000 846.004000
849.344000 863.764000
866.344000 866.814000
868.344000 882.554000
884.344000 962.416100

# RAcent  DECcent POSerr Theta    Phi  PeakCts   SNR AngSep     Name
#  [deg]    [deg]    ['] [deg]  [deg]                   [']
299.5934  35.1950    1.2  43.1  150.4  27.1416   9.5    0.4	Cyg X-1
308.0864  40.9302    3.4  41.1  163.2   6.3680   3.4    1.7	Cyg X-3
326.2560  38.5072    0.0  31.4 -179.2  -2.4647  -2.1   11.8	Cyg X-2
308.7583  -7.4394    3.8  32.1   77.5   6.1289   3.0 ------	UNKNOWN
 11.5511   8.9950    2.5  34.5  -77.0   8.3959   4.6 ------	UNKNOWN
 18.5808   8.1630    2.2  41.4  -76.2  18.9880   5.2 ------	UNKNOWN
Plot creation:
Sat Nov 16 18:13:22 EST 2024