Special notes of this burst
Image
Pre-slew 15.0-350.0 keV image (Event data)
#   RAcent    DECcent   POSerr    Theta     Phi              Peak Cts       SNR   Name
  335.3405    51.5573   0.0052    48.1586  -151.9850        16.4036322     37.075 TRIG_01231488

Foreground time interval of the image:
-37.219  16.381 (delta_t =  53.600 [sec])
Background time interval of the image:
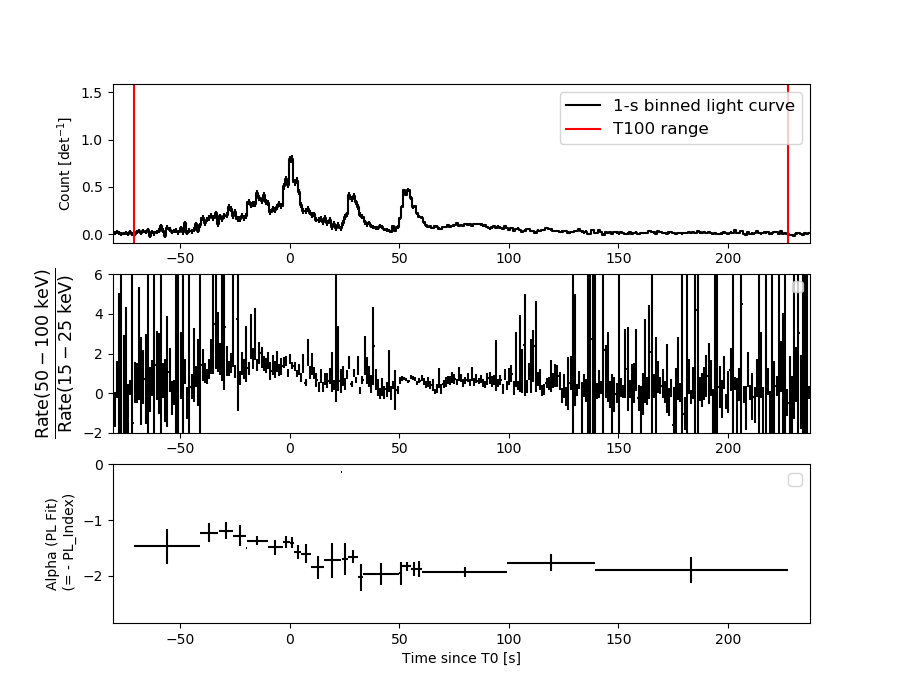
Lightcurves
Notes:
- 1) The mask-weighted light curves are using the flight position.
- 2) Multiple plots of different time binning/intervals are shown to cover all scenarios of short/long GRBs, rate/image triggers, and real/false positives.
- 3) For all the mask-weighted lightcurves, the y-axis units are counts/sec/det where a det is 0.4 x 0.4 = 0.16 sq cm.
- 4) The verticle lines correspond to following: green dotted lines are T50 interval, black dotted lines are T90 interval, blue solid line(s) is a spacecraft slew start time, and orange solid line(s) is a spacecraft slew end time.
- 5) Time of each bin is in the middle of the bin.
1 s binning
From T0-310 s to T0+310 s

From T100_start - 20 s to T100_end + 30 s
Full time interval
64 ms binning
Full time interval
From T100_start to T100_end

From T0-5 sec to T0+5 sec

16 ms binning
From T100_start-5 s to T100_start+5 s
Blue+Cyan dotted lines: Time interval of the scaled map
From 0.000000 to 1.024000
8 ms binning
From T100_start-3 s to T100_start+3 s
Blue+Cyan dotted lines: Time interval of the scaled map
From 0.000000 to 1.024000
2 ms binning
From T100_start-1 s to T100_start+1 s
Blue+Cyan dotted lines: Time interval of the scaled map
From 0.000000 to 1.024000
SN=5 or 10 sec. binning (whichever binning is satisfied first)

SN=5 or 10 sec. binning (T < 200 sec)

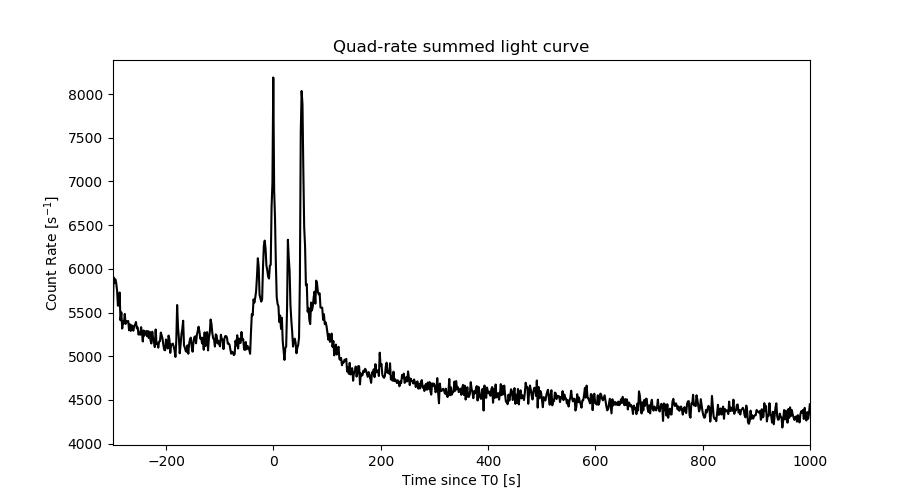
Quad-rate summed light curves (from T0-300s to T0+1000s)
Spectral Evolution
Spectra
Notes:
- 1) The fitting includes the systematic errors.
- 2) When the burst includes telescope slew time periods, the fitting uses an average response file made from multiple 5-s response files through out the slew time plus single time preiod for the non-slew times, and weighted by the total counts in the corresponding time period using addrmf. An average response file is needed becuase a spectral fit using the pre-slew DRM will introduce some errors in both a spectral shape and a normalization if the PHA file contains a lot of the slew/post-slew time interval.
- 3) For fits to more complicated models (e.g. a power-law over a cutoff power-law), the BAT team has decided to require a chi-square improvement of more than 6 for each extra dof.
Time averaged spectrum fit using the average DRM
Power-law model

Time interval is from  -70.916 sec. to  227.452 sec.

Spectral model in power-law:
------------------------------------------------------------
Parameters  : value       lower 90%   higher 90%
Photon index: 1.60396     ( -0.0439333   0.0440338 )
Norm@50keV  : 7.38710E-03    ( -0.000164388   0.000164387 )
------------------------------------------------------------
#Fit statistic  : Chi-Squared                   61.25     using 59 bins.
 Reduced chi-squared = 1.07456
# Null hypothesis probability of 3.26e-01 with 57 degrees of freedom

Photon flux (15-150 keV)    in 298.4 sec: 0.950477 ( -0.024867  0.024981 ) ph/cm2/s
Energy fluence (15-150 keV)             : 2.06081e-05 ( -4.70478e-07  4.70326e-07 ) ergs/cm2
Cutoff power-law model

Time interval is from  -70.916 sec. to  227.452 sec.
Spectral model in the cutoff power-law:
------------------------------------------------------------
Parameters  : value       lower 90%   higher 90%
Photon index: 1.60168     ( -0.139923   0.0443068 )
Epeak [keV] : 9998.06      ( -9998.47 -9998.47 )
Norm@50keV  : 7.40469E-03    ( -0.000164768   0.001102 )
------------------------------------------------------------
#Fit statistic  : Chi-Squared                   61.26     using 59 bins.
 Reduced chi-squared = 1.09393
# Null hypothesis probability of 2.93e-01 with 56 degrees of freedom

Photon flux (15-150 keV)    in 298.4 sec: 0.953303 ( -0.038457  0.030165 ) ph/cm2/s
Energy fluence (15-150 keV)             : 2.06518e-05 ( -6.6525e-07  3.97024e-07 ) ergs/cm2
Band function

Time interval is from  -70.916 sec. to  227.452 sec.


Spectral model in the Band function:
------------------------------------------------------------
Parameters  : value       lower 90%   higher 90%
alpha       :    (     )
beta        :     (     )
Epeak [keV] :       (   )
Norm@50keV   :     (     )
------------------------------------------------------------

Photon flux (15-150 keV)    in  sec:  (    ) ph/cm2/s
Energy fluence (15-150 keV)             : 0 ( 0  0 ) ergs/cm2
Single BB
Spectral model blackbody:
------------------------------------------------------------
Parameters  : value    Lower 90%  Upper 90%
kT [keV]    : 16.5199  (  )
R^2/D10^2   : 7.06463E-02  (   )
(R is the radius in km and D10 is the distance to the source in units of 10 kpc)
------------------------------------------------------------
#Fit statistic  : Chi-Squared                  540.52     using 59 bins.
 Reduced chi-squared =
# Null hypothesis probability of 6.14e-80 with 57 degrees of freedom

Energy  Fluence     90% Error
[keV]   [erg/cm2]   [erg/cm2]
15- 25  1.181e-06   5.550e-08
25- 50  5.103e-06   1.671e-07
50-150  9.849e-06   3.596e-07
15-150  1.613e-05   3.969e-07
Thermal bremsstrahlung (OTTB)
Spectral model: thermal bremsstrahlung
------------------------------------------------------------
Parameters  : value         Lower 90%    Upper 90%
kT [keV]    : 200.000       (-18.454      -200)
Norm        : 3.78884       (-0.0844122     0.0844123)
------------------------------------------------------------
#Fit statistic  : Chi-Squared                   73.61     using 59 bins.
 Reduced chi-squared =
# Null hypothesis probability of 6.85e-02 with 57 degrees of freedom

Energy  Fluence     90% Error
[keV]   [erg/cm2]   [erg/cm2]
15- 25  2.816e-06   7.281e-08
25- 50  5.417e-06   1.343e-07
50-150  1.188e-05   3.118e-07
15-150  2.012e-05   5.431e-07
Double BB
Spectral model: bbodyrad<1> + bbodyrad<2>
------------------------------------------------------------
Parameters  : value         Lower 90%    Upper 90%
kT1 [keV]   : 7.61695        (-0.64989      0.693537)
R1^2/D10^2  : 0.767923        (-0.198451      0.290561)
kT2 [keV]   : 29.8377        (-2.69531      3.50558)
R2^2/D10^2  : 7.03015E-03    (-0.00224213   0.0028529)
------------------------------------------------------------
#Fit statistic  : Chi-Squared                   84.61     using 59 bins.
 Reduced chi-squared =
# Null hypothesis probability of 6.31e-03 with 55 degrees of freedom

Energy  Fluence     90% Error
[keV]   [erg/cm2]   [erg/cm2]
15- 25  2.605e-06   2.077e-07
25- 50  5.514e-06   2.298e-07
50-150  1.220e-05   7.385e-07
15-150  2.032e-05   8.475e-07
Peak spectrum fit
Power-law model

Time interval is from    0.168 sec. to    1.168 sec.

Spectral model in power-law:
------------------------------------------------------------
Parameters  : value       lower 90%   higher 90%
Photon index: 1.42166     ( -0.128547   0.128931 )
Norm@50keV  : 6.31156E-02    ( -0.00494287   0.00493576 )
------------------------------------------------------------
#Fit statistic  : Chi-Squared                   58.18     using 59 bins.
 Reduced chi-squared = 1.0207
# Null hypothesis probability of 4.32e-01 with 57 degrees of freedom

Photon flux (15-150 keV)    in 1 sec: 7.72510 ( -0.62524  0.62614 ) ph/cm2/s
Energy fluence (15-150 keV)             : 6.07309e-07 ( -5.11871e-08  5.13945e-08 ) ergs/cm2
Cutoff power-law model

Time interval is from    0.168 sec. to    1.168 sec.
Spectral model in the cutoff power-law:
------------------------------------------------------------
Parameters  : value       lower 90%   higher 90%
Photon index: 1.10546     ( -0.534364   0.379958 )
Epeak [keV] : 150.699      ( -64.5153 -150.7 )
Norm@50keV  : 8.99989E-02    ( -0.0301849   0.0710592 )
------------------------------------------------------------
#Fit statistic  : Chi-Squared                   56.92     using 59 bins.
 Reduced chi-squared = 1.01643
# Null hypothesis probability of 4.41e-01 with 56 degrees of freedom

Photon flux (15-150 keV)    in 1 sec: 7.65274 ( -0.63516  0.63564 ) ph/cm2/s
Energy fluence (15-150 keV)             : 5.99639e-07 ( -5.35292e-08  5.31007e-08 ) ergs/cm2
Band function

Time interval is from    0.168 sec. to    1.168 sec.


Spectral model in the Band function:
------------------------------------------------------------
Parameters  : value       lower 90%   higher 90%
alpha       :    (     )
beta        :     (     )
Epeak [keV] :       (   )
Norm@50keV   :     (     )
------------------------------------------------------------

Photon flux (15-150 keV)    in  sec:  (    ) ph/cm2/s
Energy fluence (15-150 keV)             : 0 ( 0  0 ) ergs/cm2
Single BB
Spectral model blackbody:
------------------------------------------------------------
Parameters  : value    Lower 90%  Upper 90%
kT [keV]    : 16.4408  (-1.63435  1.84062)
R^2/D10^2   : 0.659313  (-0.203669   0.289626)
(R is the radius in km and D10 is the distance to the source in units of 10 kpc)
------------------------------------------------------------
#Fit statistic  : Chi-Squared                   95.58     using 59 bins.
 Reduced chi-squared =
# Null hypothesis probability of 1.04e-03 with 57 degrees of freedom

Energy  Fluence     90% Error
[keV]   [erg/cm2]   [erg/cm2]
15- 25  3.661e-08   5.310e-09
25- 50  1.576e-07   1.695e-08
50-150  3.008e-07   4.560e-08
15-150  4.951e-07   4.750e-08
Thermal bremsstrahlung (OTTB)
Spectral model: thermal bremsstrahlung
------------------------------------------------------------
Parameters  : value         Lower 90%    Upper 90%
kT [keV]    : 200.000       (-30.8008      -200)
Norm        : 32.1507       (-2.50861     2.50861)
------------------------------------------------------------
#Fit statistic  : Chi-Squared                   60.34     using 59 bins.
 Reduced chi-squared =
# Null hypothesis probability of 3.56e-01 with 57 degrees of freedom

Energy  Fluence     90% Error
[keV]   [erg/cm2]   [erg/cm2]
15- 25  8.008e-08   7.800e-09
25- 50  1.540e-07   2.270e-08
50-150  3.378e-07   1.234e-07
15-150  5.719e-07   9.260e-08
Double BB
Spectral model: bbodyrad<1> + bbodyrad<2>
------------------------------------------------------------
Parameters  : value         Lower 90%    Upper 90%
kT1 [keV]   : 8.15788        (-2.02742      2.38746)
R1^2/D10^2  : 4.78660        (-2.57167      7.05535)
kT2 [keV]   : 31.3443        (-7.70901      20.0223)
R2^2/D10^2  : 5.49466E-02    (-0.043444   0.0579648)
------------------------------------------------------------
#Fit statistic  : Chi-Squared                   56.36     using 59 bins.
 Reduced chi-squared =
# Null hypothesis probability of 4.24e-01 with 55 degrees of freedom

Energy  Fluence     90% Error
[keV]   [erg/cm2]   [erg/cm2]
15- 25  6.664e-08   2.317e-08
25- 50  1.573e-07   4.085e-08
50-150  3.811e-07   1.812e-07
15-150  6.051e-07   2.171e-07
Pre-slew spectrum (Pre-slew PHA with pre-slew DRM)
Power-law model

Spectral model in power-law:
------------------------------------------------------------
Parameters  : value       lower 90%   higher 90%
Photon index: 1.42955     ( -0.0499788   0.0499026 )
Norm@50keV  : 2.19831E-02    ( -0.000592903   0.000592631 )
------------------------------------------------------------
#Fit statistic  : Chi-Squared                   60.02     using 59 bins.
 Reduced chi-squared =
# Null hypothesis probability of 3.67e-01 with 57 degrees of freedom

Photon flux (15-150 keV)    in 53.6 sec: 2.69564 ( -0.0822291  0.0826486 ) ph/cm2/s
Energy fluence (15-150 keV)             : 1.13189e-05 ( -3.13526e-07  3.13721e-07 ) ergs/cm2
Cutoff power-law model

Spectral model in the cutoff power-law:
------------------------------------------------------------
Parameters  : value       lower 90%   higher 90%
Photon index: 1.42779     ( -0.270677   0.0486277 )
Epeak [keV] : 9342.79      ( -9079.3 -9079.3 )
Norm@50keV  : 2.20673E-02    ( -0.000597487   0.00674286 )
------------------------------------------------------------
#Fit statistic  : Chi-Squared                   59.99     using 59 bins.
 Reduced chi-squared =
# Null hypothesis probability of 3.33e-01 with 56 degrees of freedom

Photon flux (15-150 keV)    in 53.6 sec: 2.68337 ( -0.08949  0.045 ) ph/cm2/s
Energy fluence (15-150 keV)             : 1.12911e-05 ( -3.30819e-07  3.29426e-07 ) ergs/cm2
Band function

Spectral model in the Band function:
------------------------------------------------------------
Parameters  : value       lower 90%   higher 90%
alpha       :    (     )
beta        :     (     )
Epeak [keV] :       (   )
Norm@50keV   :     (     )
------------------------------------------------------------

Photon flux (15-150 keV)    in  sec:  (    ) ph/cm2/s
Energy fluence (15-150 keV)             : 0 ( 0  0 ) ergs/cm2
S(25-50 keV) vs. S(50-100 keV) plot
S(25-50 keV)  = 5.34e-06
S(50-100 keV) = 7.04e-06
T90 vs. Hardness ratio plot

T90                                   = 158.971999883652 sec.
Hardness ratio (energy fluence ratio) = 1.31835
Color vs. Color plot
Count Ratio  (25-50 keV) / (15-25 keV) = 1.30406
Count Ratio (50-100 keV) / (15-25 keV) = 1.00512
Mask shadow pattern
IMX = -9.859501710022455E-01, IMY = 5.245699676983058E-01
TIME vs. PHA plot around the trigger time
Blue+Cyan dotted lines: Time interval of the scaled map
From 0.000000 to 1.024000
TIME vs. DetID plot around the trigger time
Blue+Cyan dotted lines: Time interval of the scaled map
From 0.000000 to 1.024000
100 us light curve (15-350 keV)
Blue+Cyan dotted lines: Time interval of the scaled map
From 0.000000 to 1.024000
Spacecraft aspect plot

Bright source in the pre-burst/pre-slew/post-slew images
Pre-burst image of 15-350 keV band
Time interval of the image:
Pre-slew background subtracted image of 15-350 keV band
Time interval of the image:
-37.219410 16.380600

# RAcent  DECcent POSerr Theta    Phi  PeakCts   SNR AngSep     Name
#  [deg]    [deg]    ['] [deg]  [deg]                   [']
288.8613  11.1571    0.0  42.5  127.2   0.3992   0.8   13.2	GRS 1915+105
299.6300  35.1838    3.1  43.0  165.8   1.3180   3.8    2.2	Cyg X-1
308.2321  41.0091    6.4  42.7  178.9   0.5603   1.8    6.5	Cyg X-3
326.1144  38.2094   45.1  35.0 -162.4  -0.0518  -0.3    7.3	Cyg X-2
346.8636 -47.3994    3.1  52.8   11.1   1.7508   3.8 ------	UNKNOWN
  0.8108 -35.6424    2.5  48.0   -8.3   1.2137   4.6 ------	UNKNOWN
 13.6209 -33.2493    4.6  54.4  -19.5   1.0496   2.5 ------	UNKNOWN
344.2351  36.1665    2.4  34.8 -136.8   1.2162   4.8 ------	UNKNOWN
335.3405  51.5573    0.3  48.2 -152.0  16.4024  37.1 ------	UNKNOWN
Post-slew image of 15-350 keV band
Time interval of the image:
107.180670 962.780600

# RAcent  DECcent POSerr Theta    Phi  PeakCts   SNR AngSep     Name
#  [deg]    [deg]    ['] [deg]  [deg]                   [']
299.5610  35.2195    1.1  30.3   86.4  14.2034  10.3    1.8	Cyg X-1
308.2004  40.9485   17.5  21.4   85.9  -0.6062  -0.7    4.1	Cyg X-3
325.9234  38.4061    0.0  14.7   45.3   1.1638   1.8   12.7	Cyg X-2
304.4402  43.0770    2.9  22.4   94.9   3.7764   4.0 ------	UNKNOWN
335.1454  29.4769    2.1  22.1   15.4   3.7741   5.5 ------	UNKNOWN
286.7340  74.9237    2.5  30.3  172.2   3.7026   4.6 ------	UNKNOWN
324.9970  64.6742    2.6  14.2  176.6   2.9484   4.5 ------	UNKNOWN
335.5604  51.5770    2.3   0.1  -84.5   3.6057   4.9 ------	UNKNOWN
286.6107  88.4444    2.1  37.4 -167.0   4.7705   5.4 ------	UNKNOWN
  2.8309  73.5890    2.7  24.9 -147.0   3.0187   4.2 ------	UNKNOWN
142.3827  70.9059    2.2  57.2 -160.1  16.7461   5.3 ------	UNKNOWN
 60.9783  61.3360    2.3  44.8 -122.3  15.3820   5.0 ------	UNKNOWN
 28.8494  33.5595    2.2  42.2  -71.3  14.3838   5.1 ------	UNKNOWN
Plot creation:
Sat Nov 16 12:25:31 EST 2024