Estimated redshift from machine learning (Ukwatta et al. 2016) - may take a few minutes to calcaulte
Image
Pre-slew 15-350 keV image (Event data; bkg subtracted)

#   RAcent  DECcent POSerr  Theta    Phi     Peak Cts     SNR  Name
   12.1669 -19.7605 0.0838   41.3   -3.0       0.0371     2.3  TRIG_01235109
------------------------------------------

Foreground time interval of the image:
  0.000   1.024 (delta_t =   1.024 [sec])
Background time interval of the image:
-138.879 -133.250 (delta_t =   5.629 [sec])
-132.480 -122.140 (delta_t =  10.340 [sec])
-121.480  -4.480 (delta_t = 117.000 [sec])
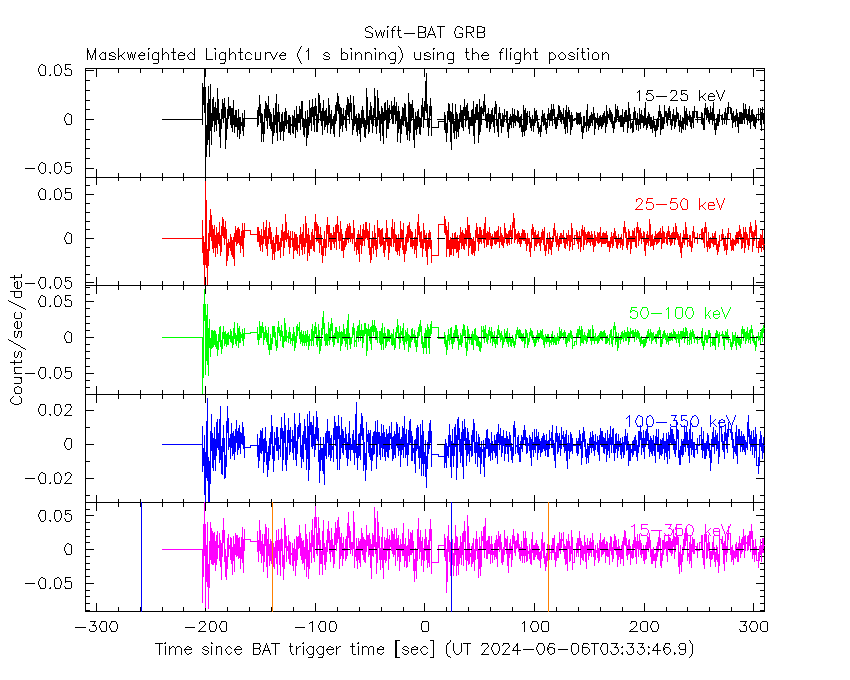
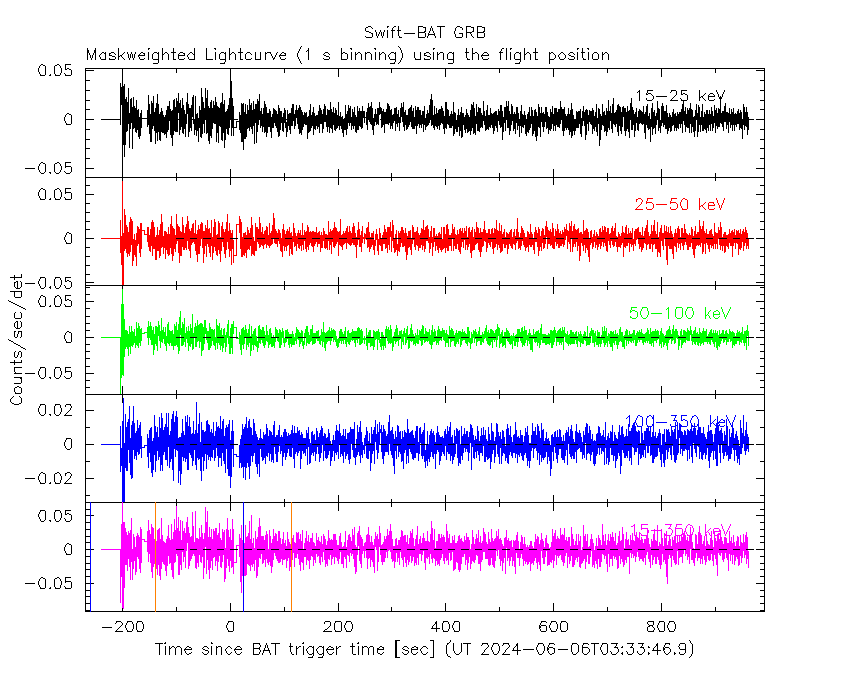
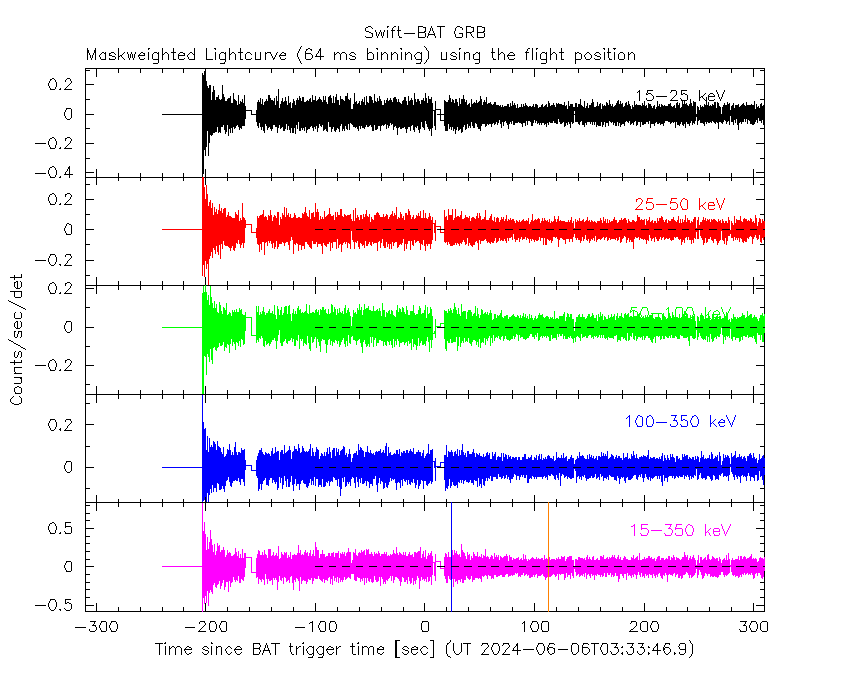
Lightcurves
Notes:
- 1) All plots contain as much data as has been downloaded to date.
- 2) The mask-weighted light curves are using the flight position.
- 3) Multiple plots of different time binning/intervals are shown to cover all scenarios of short/long GRBs, rate/image triggers, and real/false positives.
- 4) For all the mask-weighted lightcurves, the y-axis units are counts/sec/det where a det is 0.4 x 0.4 = 0.16 sq cm.
- 5) The verticle lines correspond to following: green dotted lines are T50 interval, black dotted lines are T90 interval, blue solid line(s) is a spacecraft slew start time, and orange solid line(s) is a spacecraft slew end time.
- 6) Time of each bin is in the middle of the bin.
1 s binning
From T0-310 s to T0+310 s
From T100_start - 20 s to T100_end + 30 s
Full time interval
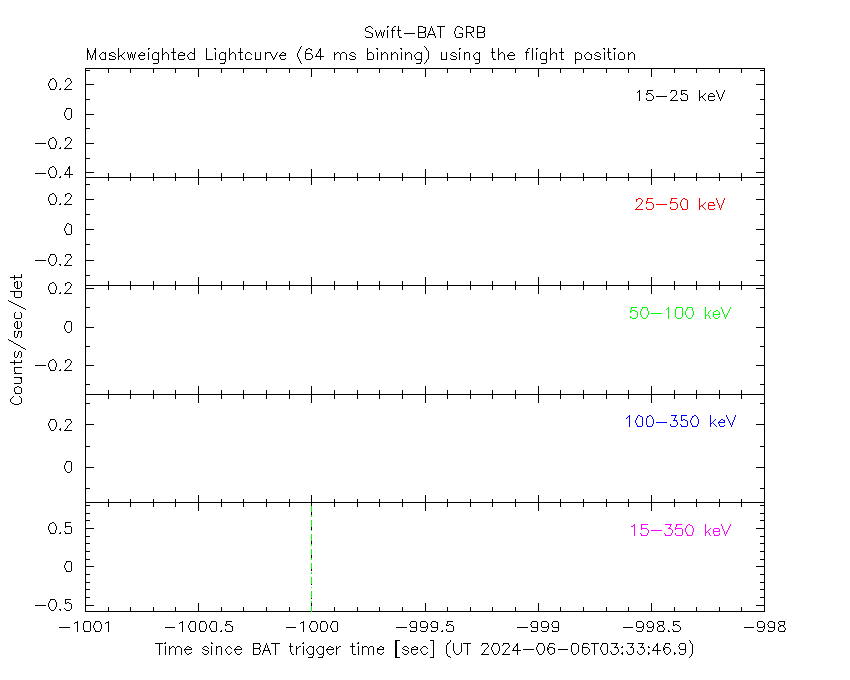
64 ms binning
Full time interval
From T100_start to T100_end
From T0-5 sec to T0+5 sec

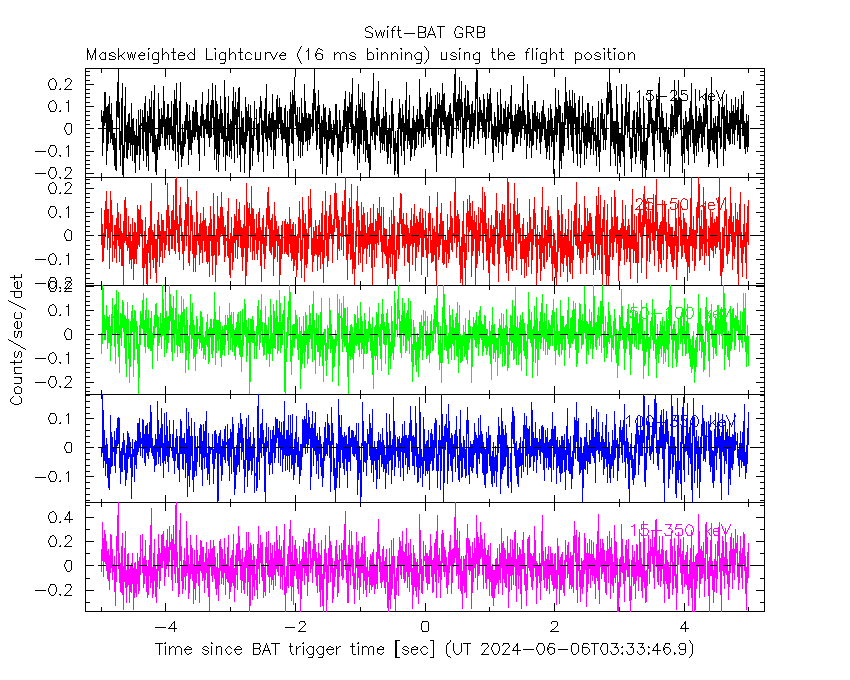
16 ms binning
From T100_start-5 s to T100_start+5 s
8 ms binning
From T100_start-3 s to T100_start+3 s

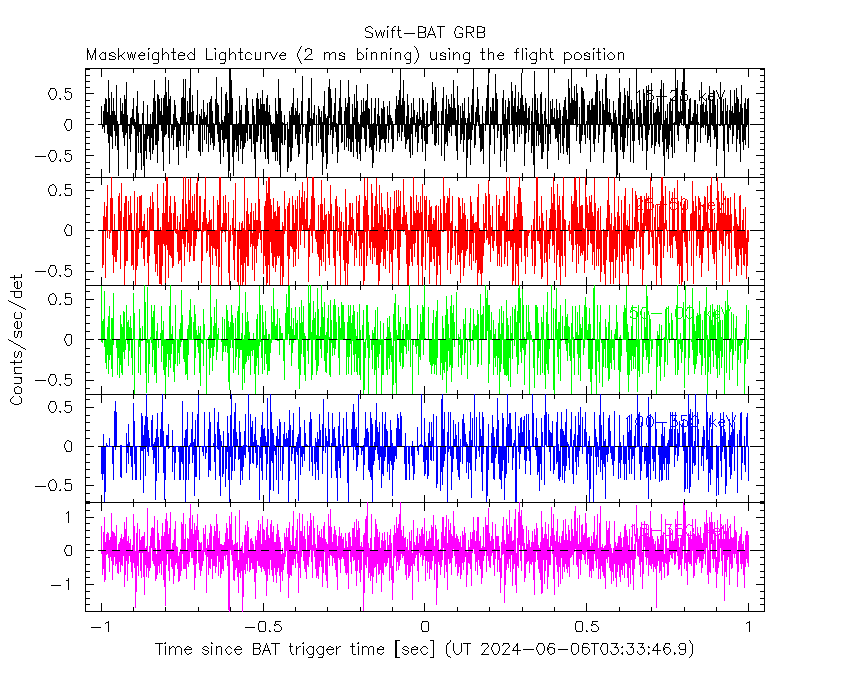
2 ms binning
From T100_start-1 s to T100_start+1 s
SN=5 or 10 sec. binning (whichever binning is satisfied first)
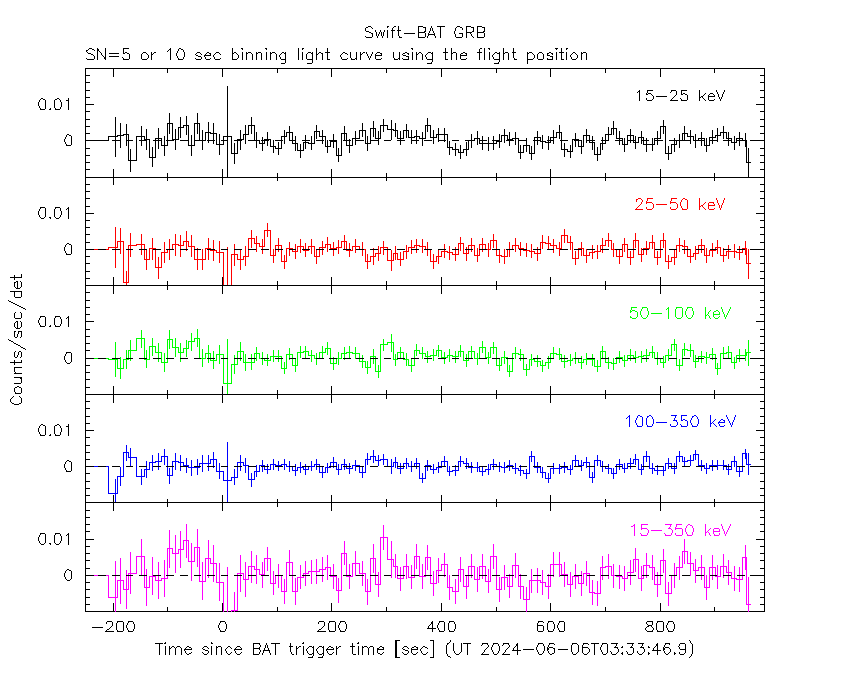
SN=5 or 10 sec. binning (T < 200 sec)

Spectra
Notes:
- 1) The fitting includes the systematic errors.
- 2) For long bursts, a spectral fit of the pre-slew DRM will introduce some errors in both a spectral shape and a normalization if the PHA file contains a lot of the slew/post-slew time interval.
- 3) For fits to more complicated models (e.g. a power-law over a cutoff power-law), the BAT team has decided to require a chi-square improvement of more than 6 for each extra dof.
- 4) For short bursts (T90<1sec), the specrtum is also fit with Blackbody, OTTB, and Double Blackbody.
Time averaged spectrum fit using the pre-slew DRM
Power-law model
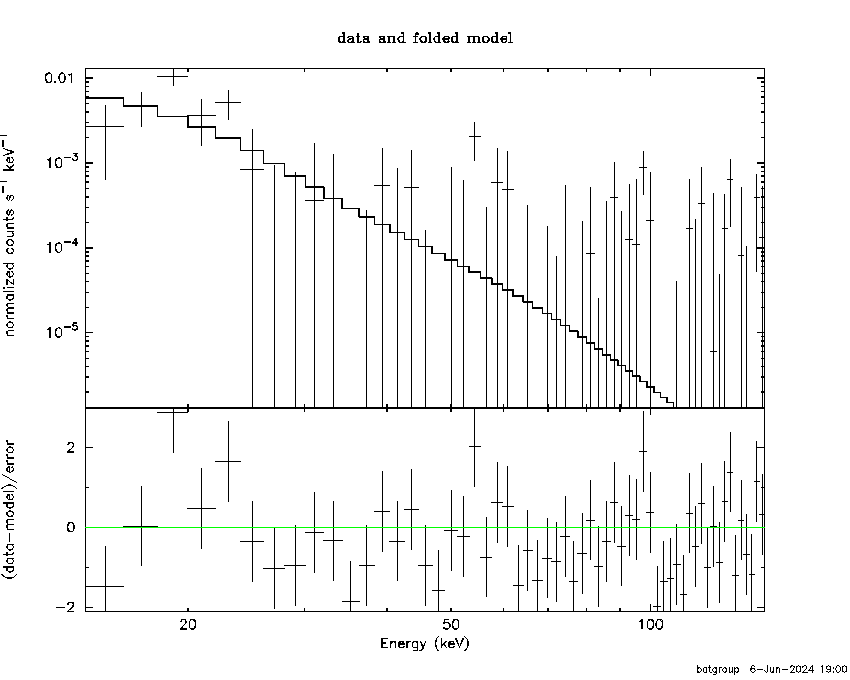
Time interval is from    0.000 sec. to    1.024 sec.

Spectral model in power-law:
------------------------------------------------------------
Parameters  : value       lower 90%   higher 90%
Photon index: 4.47517     ( -1.0137   1.533 )
Norm@50keV  : 5.36717E-04    ( -0.000549036   0.000993015 )
------------------------------------------------------------
#Fit statistic : Chi-Squared =          63.40 using 59 PHA bins.
# Reduced chi-squared =          1.112 for     57 degrees of freedom
# Null hypothesis probability =   2.610693e-01

Photon flux (15-150 keV)    in 1.024 sec: 0.509628 ( -0.202146  0.208354 ) ph/cm2/s
Energy fluence (15-150 keV)             : 1.76599e-08 ( -3.66211e-09  8.97238e-09 ) ergs/cm2
Cutoff power-law model
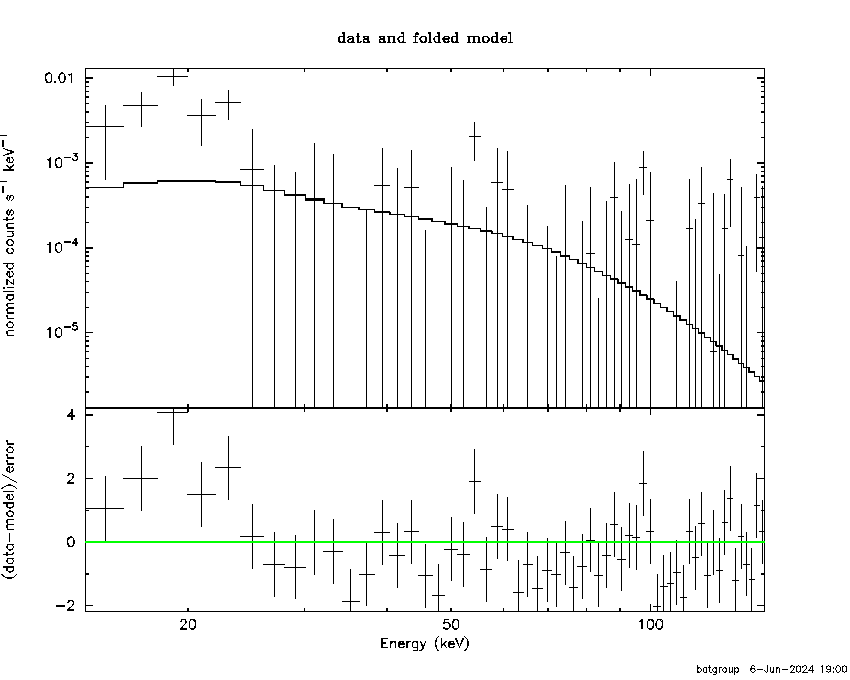
Time interval is from    0.000 sec. to    1.024 sec.
Spectral model in the cutoff power-law:
------------------------------------------------------------
Parameters  : value       lower 90%   higher 90%
Photon index: 1.00000     (     )
Epeak [keV] : 50.0000      (   )
Norm@50keV  : 3.76122E-03    (     )
------------------------------------------------------------
#Fit statistic : Chi-Squared =          81.13 using 59 PHA bins.
# Reduced chi-squared =          1.449 for     56 degrees of freedom
# Null hypothesis probability =   1.570175e-02

Photon flux (15-150 keV)    in 1.024 sec: 0.622793 0.626070 (    ) ph/cm2/s
Energy fluence (15-150 keV)             : 3.78805e-16 ( 0  0 ) ergs/cm2
Band function

Time interval is from    0.000 sec. to    1.024 sec.

Spectral model in the Band function:
------------------------------------------------------------
Parameters  : value       lower 90%   higher 90%
alpha       : 5.00000   ( -6.85529   -5 )
beta        : -10.0000    ( 10   10 )
Epeak [keV] : 15.8745      ( -2.86061 2.91793 )
Norm@50keV   : 3.28052E+04    ( -10741.8   147361 )
------------------------------------------------------------
#Fit statistic : Chi-Squared =          57.50 using 59 PHA bins.
# Reduced chi-squared =          1.046 for     55 degrees of freedom
# Null hypothesis probability =   3.826348e-01

Photon flux (15-150 keV)    in 1.024 sec: 0.608272 ( 6.39173  -0.201162 ) ph/cm2/s
Energy fluence (15-150 keV)             : 0 ( 0  0 ) ergs/cm2
Single BB

Spectral model blackbody:
------------------------------------------------------------
Parameters  : value    Lower 90%  Upper 90%
kT [keV]    : 3.31928  (-0.777453  0.951512)
R^2/D10^2   : 44.3872  (-44.0036   161.982)
(R is the radius in km and D10 is the distance to the source in units of 10 kpc)
------------------------------------------------------------
#Fit statistic : Chi-Squared =          58.92 using 59 PHA bins.
# Reduced chi-squared =          1.034 for     57 degrees of freedom
# Null hypothesis probability =   4.049533e-01

Energy  Fluence     90% Error
[keV]   [erg/cm2]   [erg/cm2]
15- 25  1.551e-08   9.108e-09
25- 50  3.175e-09   2.146e-09
50-150  1.116e-11   1.378e-11
15-150  1.869e-08   1.119e-08
Thermal bremsstrahlung (OTTB)

XSPEC12>exit
 XSPEC: quit


Spectral model: thermal bremsstrahlung
------------------------------------------------------------
Parameters  : value         Lower 90%    Upper 90%
kT [keV]    : 7.11935       (-2.62696      4.80316)
Norm        : 42.2839       (-42.2977     120.639)
------------------------------------------------------------
 Reduced chi-squared =

Energy  Fluence     90% Error
[keV]   [erg/cm2]   [erg/cm2]
15- 25  1.426e-08   8.448e-09
25- 50  3.647e-09   2.537e-09
50-150  8.594e-11   9.564e-11
15-150  1.799e-08   1.077e-08
Double BB

XSPEC12>exit
 XSPEC: quit


Spectral model: bbodyrad<1> + bbodyrad<2>
------------------------------------------------------------
Parameters  : value         Lower 90%    Upper 90%
kT1 [keV]   : 1.03956E-04        (-0.000103956      -0.000103956)
R1^2/D10^2  : 7504.54        (-7505.96      -7505.96)
kT2 [keV]   : 3.33612        (-0.767956      0.960291)
R2^2/D10^2  : 43.2146    (-43.5168   162.952)
------------------------------------------------------------
 Reduced chi-squared =

Energy  Fluence     90% Error
[keV]   [erg/cm2]   [erg/cm2]
15- 25  1.537e-08   1.330e-02
25- 50  4.428e-09   1.098e-01
50-150  3.318e-11   2.635e+00
15-150  1.983e-08   3.220e+00
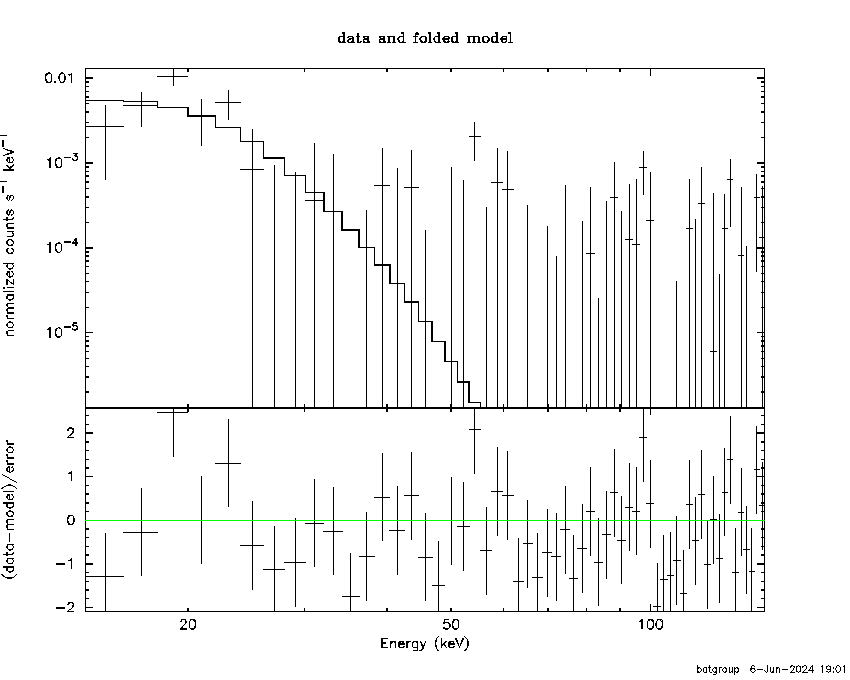
Peak spectrum fit
Power-law model

Time interval is from    0.000 sec. to    1.024 sec.

Spectral model in power-law:
------------------------------------------------------------
Parameters  : value       lower 90%   higher 90%
Photon index: 4.47517     ( -1.0137   1.533 )
Norm@50keV  : 5.36717E-04    ( -0.000549036   0.000993015 )
------------------------------------------------------------
#Fit statistic : Chi-Squared =          63.40 using 59 PHA bins.
# Reduced chi-squared =          1.112 for     57 degrees of freedom
# Null hypothesis probability =   2.610693e-01

Photon flux (15-150 keV)    in 1.024 sec: 0.509628 ( -0.202146  0.208354 ) ph/cm2/s
Energy fluence (15-150 keV)             : 1.76599e-08 ( -3.66211e-09  8.97238e-09 ) ergs/cm2
Cutoff power-law model

Time interval is from    0.000 sec. to    1.024 sec.
Spectral model in the cutoff power-law:
------------------------------------------------------------
Parameters  : value       lower 90%   higher 90%
Photon index: 1.00000     (     )
Epeak [keV] : 50.0000      (   )
Norm@50keV  : 3.76122E-03    (     )
------------------------------------------------------------
#Fit statistic : Chi-Squared =          81.13 using 59 PHA bins.
# Reduced chi-squared =          1.449 for     56 degrees of freedom
# Null hypothesis probability =   1.570175e-02

Photon flux (15-150 keV)    in 1.024 sec: 0.622793 0.626070 (    ) ph/cm2/s
Energy fluence (15-150 keV)             : 3.78805e-16 ( 0  0 ) ergs/cm2
Band function

Time interval is from    0.000 sec. to    1.024 sec.

Spectral model in the Band function:
------------------------------------------------------------
Parameters  : value       lower 90%   higher 90%
alpha       : 5.00000   ( -6.85529   -5 )
beta        : -10.0000    ( 10   10 )
Epeak [keV] : 15.8745      ( -2.86061 2.91793 )
Norm@50keV   : 3.28052E+04    ( -10741.8   147361 )
------------------------------------------------------------
#Fit statistic : Chi-Squared =          57.50 using 59 PHA bins.
# Reduced chi-squared =          1.046 for     55 degrees of freedom
# Null hypothesis probability =   3.826348e-01

Photon flux (15-150 keV)    in 1.024 sec: 0.608272 ( 6.39173  -0.201162 ) ph/cm2/s
Energy fluence (15-150 keV)             : 0 ( 0  0 ) ergs/cm2
Single BB
 XSPEC: quit


Spectral model blackbody:
------------------------------------------------------------
Parameters  : value    Lower 90%  Upper 90%
kT [keV]    : 3.31928  (-0.777453  0.951512)
R^2/D10^2   : 44.3872  (-44.0036   161.982)
(R is the radius in km and D10 is the distance to the source in units of 10 kpc)
------------------------------------------------------------
 Reduced chi-squared =

Energy  Fluence     90% Error
[keV]   [erg/cm2]   [erg/cm2]
15- 25  1.551e-08   9.206e-09
25- 50  3.175e-09   2.245e-09
50-150  1.116e-11   1.490e-11
15-150  1.869e-08   1.140e-08
Thermal bremsstrahlung (OTTB)

XSPEC12>exit
 XSPEC: quit


Spectral model: thermal bremsstrahlung
------------------------------------------------------------
Parameters  : value         Lower 90%    Upper 90%
kT [keV]    : 7.11935       (-2.62696      4.80316)
Norm        : 42.2839       (-42.2977     120.639)
------------------------------------------------------------
 Reduced chi-squared =

Energy  Fluence     90% Error
[keV]   [erg/cm2]   [erg/cm2]
15- 25  1.426e-08   8.172e-09
25- 50  3.647e-09   2.489e-09
50-150  8.594e-11   1.057e-10
15-150  1.799e-08   1.144e-08
Double BB

XSPEC12>exit
 XSPEC: quit


Spectral model: bbodyrad<1> + bbodyrad<2>
------------------------------------------------------------
Parameters  : value         Lower 90%    Upper 90%
kT1 [keV]   : 1.03956E-04        (-0.000103956      -0.000103956)
R1^2/D10^2  : 7504.54        (-7505.96      -7505.96)
kT2 [keV]   : 3.33612        (-0.767956      0.960291)
R2^2/D10^2  : 43.2146    (-43.5168   162.952)
------------------------------------------------------------
 Reduced chi-squared =

Energy  Fluence     90% Error
[keV]   [erg/cm2]   [erg/cm2]
15- 25  1.537e-08   1.375e-02
25- 50  4.428e-09   1.062e-01
50-150  3.318e-11   2.864e+00
15-150  1.983e-08   2.926e+00
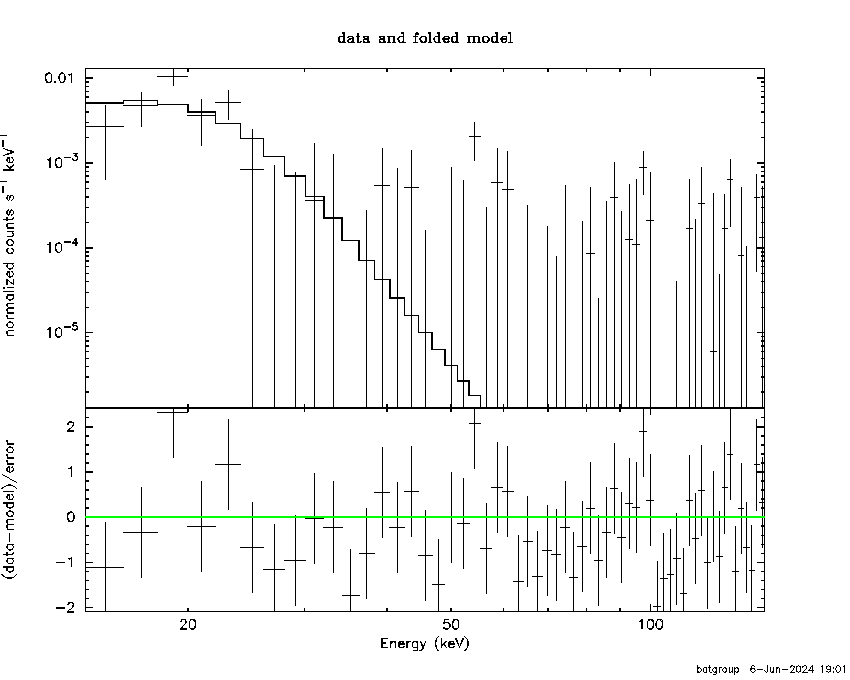
Pre-slew spectrum (Pre-slew PHA with pre-slew DRM)
Power-law model

Spectral model in power-law:
------------------------------------------------------------
Parameters  : value       lower 90%   higher 90%
Photon index: 4.47517     ( -1.0137   1.533 )
Norm@50keV  : 5.36717E-04    ( -0.000549036   0.000993015 )
------------------------------------------------------------
#Fit statistic : Chi-Squared =          63.40 using 59 PHA bins.
# Reduced chi-squared =          1.112 for     57 degrees of freedom
# Null hypothesis probability =   2.610693e-01

Photon flux (15-150 keV)    in 1.024 sec: 0.509628 ( -0.202146  0.208354 ) ph/cm2/s
Energy fluence (15-150 keV)             : 1.76599e-08 ( -3.66211e-09  8.97238e-09 ) ergs/cm2
Cutoff power-law model

Spectral model in the cutoff power-law:
------------------------------------------------------------
Parameters  : value       lower 90%   higher 90%
Photon index: 1.00000     (     )
Epeak [keV] : 50.0000      (   )
Norm@50keV  : 3.76122E-03    (     )
------------------------------------------------------------
#Fit statistic : Chi-Squared =          81.13 using 59 PHA bins.
# Reduced chi-squared =          1.449 for     56 degrees of freedom
# Null hypothesis probability =   1.570175e-02

Photon flux (15-150 keV)    in 1.024 sec: 0.622793 0.626070 (    ) ph/cm2/s
Energy fluence (15-150 keV)             : 3.78805e-16 ( 0  0 ) ergs/cm2
Band function
Spectral model in the Band function:
------------------------------------------------------------
Parameters  : value       lower 90%   higher 90%
alpha       : 5.00000   ( -6.85529   -5 )
beta        : -10.0000    ( 10   10 )
Epeak [keV] : 15.8745      ( -2.86061 2.91793 )
Norm@50keV   : 3.28052E+04    ( -10741.8   147361 )
------------------------------------------------------------
#Fit statistic : Chi-Squared =          57.50 using 59 PHA bins.
# Reduced chi-squared =          1.046 for     55 degrees of freedom
# Null hypothesis probability =   3.826348e-01

Photon flux (15-150 keV)    in 1.024 sec: 0.608272 ( 6.39173  -0.201162 ) ph/cm2/s
Energy fluence (15-150 keV)             : 0 ( 0  0 ) ergs/cm2
S(25-50 keV) vs. S(50-100 keV) plot
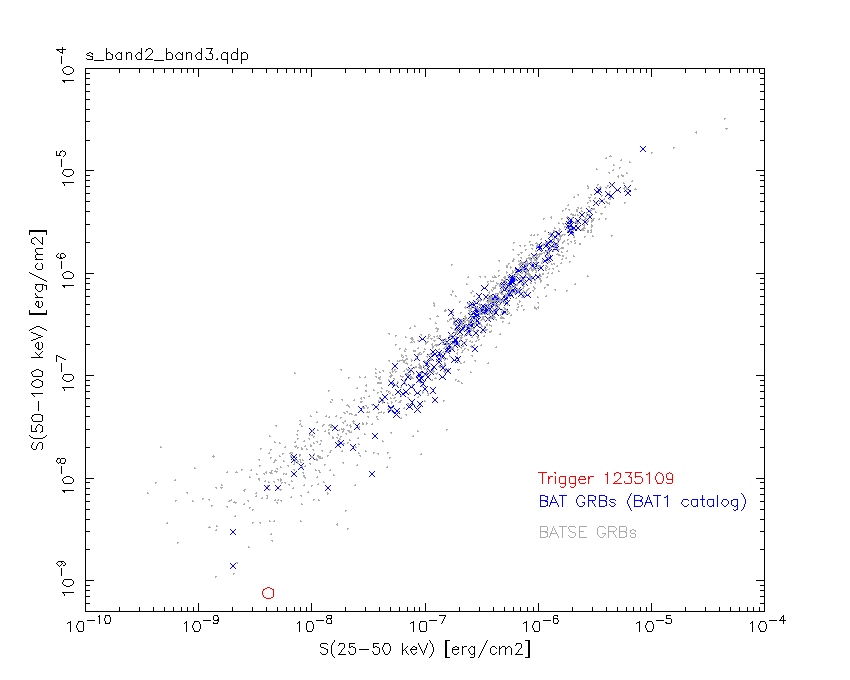
S(25-50 keV)  = 4.13e-09
S(50-100 keV) = 7.59e-10
T90 vs. Hardness ratio plot

T90                                   = 1.0239999294281 sec.
Hardness ratio (energy fluence ratio) = 0.183777
Color vs. Color plot
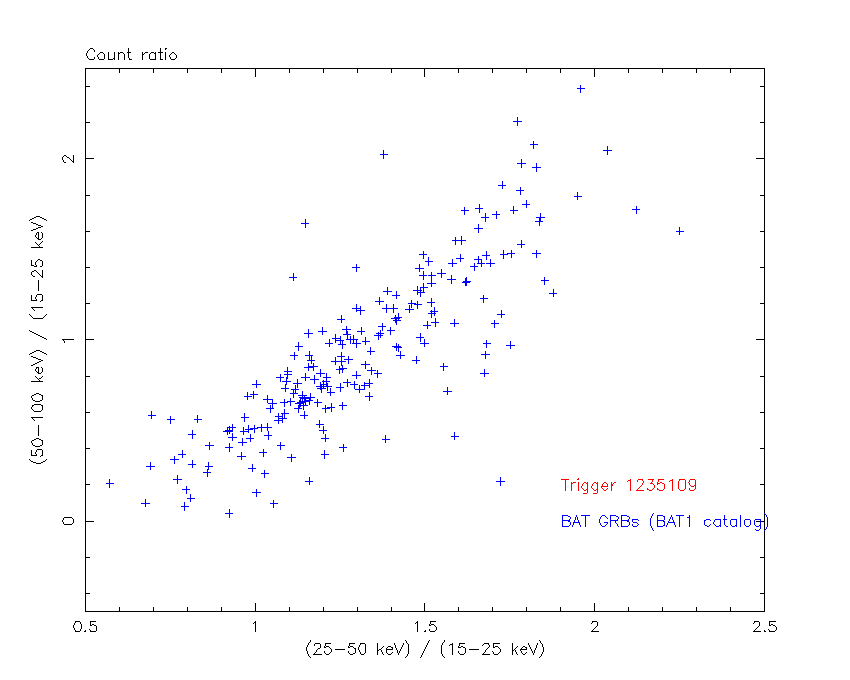
Count Ratio  (25-50 keV) / (15-25 keV) = -0.148566
Count Ratio (50-100 keV) / (15-25 keV) = -0.120859
Mask shadow pattern
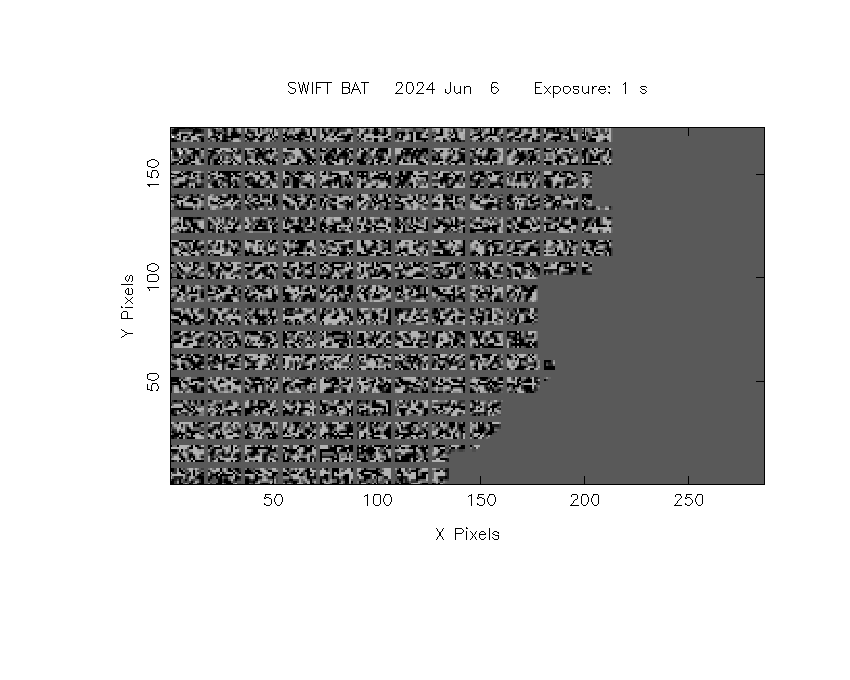
IMX = 8.759555915424727E-01, IMY = 4.615584049207516E-02
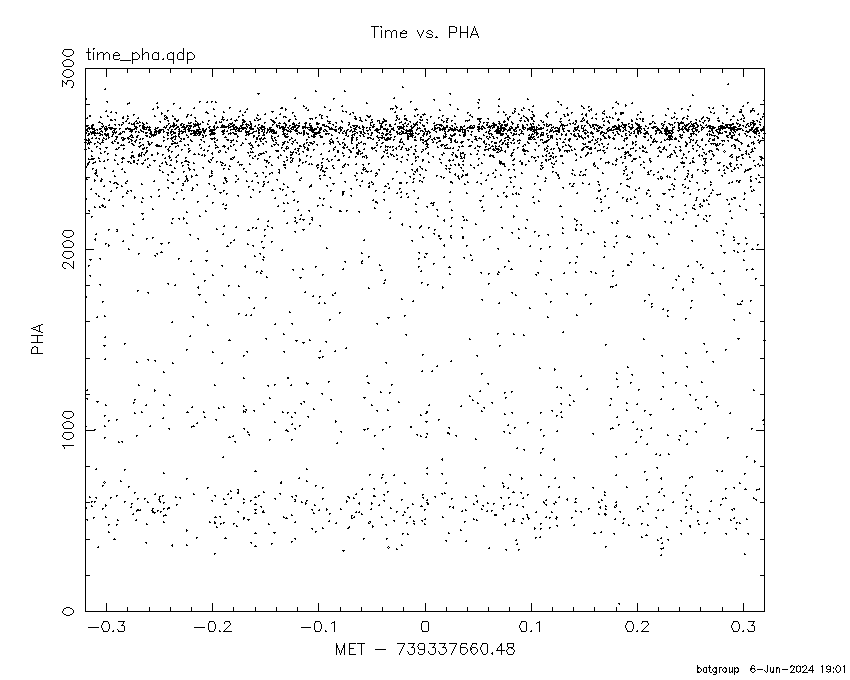
TIME vs. PHA plot around the trigger time
TIME vs. DetID plot around the trigger time
100 us light curve (15-350 keV)

Spacecraft aspect plot

Bright source in the pre-burst/pre-slew/post-slew images
Pre-burst image of 15-350 keV band
Time interval of the image:
-138.879420 -133.250000
-132.480000 -122.140000
-121.480000 -4.480000

# RAcent  DECcent POSerr Theta    Phi  PeakCts   SNR AngSep     Name
#  [deg]    [deg]    ['] [deg]  [deg]                   [']
326.1496  38.3660   10.9  35.6  140.6   0.4323   1.1    2.9	Cyg X-2
 27.7935 -29.5210    2.1  55.7  -15.6   3.1329   5.4 ------	UNKNOWN
 44.8543  17.1409    2.6  41.0  -81.1   3.2826   4.5 ------	UNKNOWN
 43.9208   2.6259    3.2  44.8  -60.4   3.2922   3.6 ------	UNKNOWN
Pre-slew background subtracted image of 15-350 keV band
Time interval of the image:
0.000000 1.024000

# RAcent  DECcent POSerr Theta    Phi  PeakCts   SNR AngSep     Name
#  [deg]    [deg]    ['] [deg]  [deg]                   [']
326.3877  38.2716    0.0  35.4  140.6  -0.0551  -2.9   10.6	Cyg X-2
  1.2251  -8.0126    2.0  28.2   13.0   0.0675   5.7  486.3	UNKNOWN
Post-slew image of 15-350 keV band
Time interval of the image:
112.820600 135.750000
137.520000 247.160000
248.520000 249.840000
251.520000 270.310000
271.520000 278.180000
279.520000 302.550000
303.520000 304.390000
305.520000 309.870000
310.520000 962.551700

# RAcent  DECcent POSerr Theta    Phi  PeakCts   SNR AngSep     Name
#  [deg]    [deg]    ['] [deg]  [deg]                   [']
  1.4667 -60.0985    2.7  41.0   40.0   9.2213   4.3 ------	UNKNOWN
349.4647 -28.3804    2.8  22.4   94.9   5.8359   4.2 ------	UNKNOWN
 49.3488  -0.8199    2.7  41.1  -81.0  14.6581   4.3 ------	UNKNOWN
 45.2030   4.8512    2.5  40.8  -91.7  18.9687   4.6 ------	UNKNOWN
 27.6450  25.9167    3.2  48.1 -129.2  17.3998   3.6 ------	UNKNOWN
Plot creation:
Thu Jun  6 19:02:00 EDT 2024