Estimated redshift from machine learning (Ukwatta et al. 2016) - may take a few minute to calcaulte
Image
Pre-slew 15.0-350.0 keV image (Event data)

#   RAcent    DECcent   POSerr    Theta     Phi              Peak Cts       SNR   Name
  236.4509     8.6116   0.0125     4.8206   107.5921         1.7693882     15.508 TRIG_01245074

Foreground time interval of the image:
 -6.792  73.101 (delta_t =  79.893 [sec])
Background time interval of the image:
-239.000  -6.792 (delta_t = 232.208 [sec])
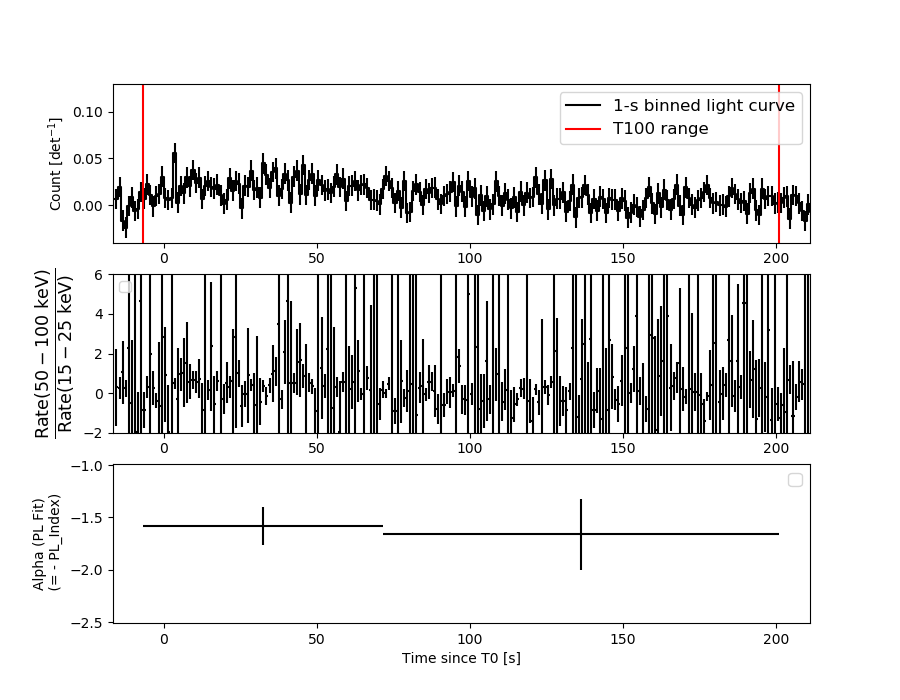
Lightcurves
Notes:
- 1) The mask-weighted light curves are using the flight position.
- 2) Multiple plots of different time binning/intervals are shown to cover all scenarios of short/long GRBs, rate/image triggers, and real/false positives.
- 3) For all the mask-weighted lightcurves, the y-axis units are counts/sec/det where a det is 0.4 x 0.4 = 0.16 sq cm.
- 4) The verticle lines correspond to following: green dotted lines are T50 interval, black dotted lines are T90 interval, blue solid line(s) is a spacecraft slew start time, and orange solid line(s) is a spacecraft slew end time.
- 5) Time of each bin is in the middle of the bin.
1 s binning
From T0-310 s to T0+310 s
From T100_start - 20 s to T100_end + 30 s
Full time interval
64 ms binning
Full time interval

From T100_start to T100_end
From T0-5 sec to T0+5 sec
16 ms binning
From T100_start-5 s to T100_start+5 s

8 ms binning
From T100_start-3 s to T100_start+3 s
2 ms binning
From T100_start-1 s to T100_start+1 s

SN=5 or 10 sec. binning (whichever binning is satisfied first)

SN=5 or 10 sec. binning (T < 200 sec)

Quad-rate summed light curves (from T0-300s to T0+1000s)

Spectral Evolution
Spectra
Notes:
- 1) The fitting includes the systematic errors.
- 2) When the burst includes telescope slew time periods, the fitting uses an average response file made from multiple 5-s response files through out the slew time plus single time preiod for the non-slew times, and weighted by the total counts in the corresponding time period using addrmf. An average response file is needed becuase a spectral fit using the pre-slew DRM will introduce some errors in both a spectral shape and a normalization if the PHA file contains a lot of the slew/post-slew time interval.
- 3) For fits to more complicated models (e.g. a power-law over a cutoff power-law), the BAT team has decided to require a chi-square improvement of more than 6 for each extra dof.
Time averaged spectrum fit using the average DRM
Power-law model

Time interval is from   -6.792 sec. to  201.060 sec.

Spectral model in power-law:
------------------------------------------------------------
Parameters  : value       lower 90%   higher 90%
Photon index: 1.62143     ( -0.175465   0.179056 )
Norm@50keV  : 7.28798E-04    ( -7.94091e-05   7.85542e-05 )
------------------------------------------------------------
#Fit statistic  : Chi-Squared                   65.99     using 59 bins.
 Reduced chi-squared = 1.15772
# Null hypothesis probability of 1.94e-01 with 57 degrees of freedom

Photon flux (15-150 keV)    in 207.9 sec: 9.42898E-02 ( -0.0096179  0.0096272 ) ph/cm2/s
Energy fluence (15-150 keV)             : 1.41366e-06 ( -1.6422e-07  1.66515e-07 ) ergs/cm2
Cutoff power-law model

Time interval is from   -6.792 sec. to  201.060 sec.
Spectral model in the cutoff power-law:
------------------------------------------------------------
Parameters  : value       lower 90%   higher 90%
Photon index: 0.913108     ( -0.847449   0.708018 )
Epeak [keV] : 71.7034      ( -18.8214 747.706 )
Norm@50keV  : 1.73372E-03    ( -0.00098811   0.0030846 )
------------------------------------------------------------
#Fit statistic  : Chi-Squared                   63.07     using 59 bins.
 Reduced chi-squared = 1.12625
# Null hypothesis probability of 2.41e-01 with 56 degrees of freedom

Photon flux (15-150 keV)    in 207.9 sec: 9.13559E-02 ( -0.0100605  0.0100571 ) ph/cm2/s
Energy fluence (15-150 keV)             : 1.32542e-06 ( -1.81795e-07  1.87074e-07 ) ergs/cm2
Band function

Time interval is from   -6.792 sec. to  201.060 sec.


Spectral model in the Band function:
------------------------------------------------------------
Parameters  : value       lower 90%   higher 90%
alpha       :    (     )
beta        :     (     )
Epeak [keV] :       (   )
Norm@50keV   :     (     )
------------------------------------------------------------

Photon flux (15-150 keV)    in  sec:  (    ) ph/cm2/s
Energy fluence (15-150 keV)             : 0 ( 0  0 ) ergs/cm2
Single BB
Spectral model blackbody:
------------------------------------------------------------
Parameters  : value    Lower 90%  Upper 90%
kT [keV]    : 13.1819  (-1.5736  1.82408)
R^2/D10^2   : 1.65776E-02  (-0.00619503   0.00967488)
(R is the radius in km and D10 is the distance to the source in units of 10 kpc)
------------------------------------------------------------
#Fit statistic  : Chi-Squared                   78.83     using 59 bins.
 Reduced chi-squared =
# Null hypothesis probability of 2.94e-02 with 57 degrees of freedom

Energy  Fluence     90% Error
[keV]   [erg/cm2]   [erg/cm2]
15- 25  1.270e-07   2.388e-08
25- 50  4.439e-07   6.039e-08
50-150  4.916e-07   1.061e-07
15-150  1.062e-06   1.353e-07
Thermal bremsstrahlung (OTTB)
Spectral model: thermal bremsstrahlung
------------------------------------------------------------
Parameters  : value         Lower 90%    Upper 90%
kT [keV]    : 154.880       (-58.3554      -153.762)
Norm        : 0.389848       (-0.0426797     0.0519897)
------------------------------------------------------------
#Fit statistic  : Chi-Squared                   63.72     using 59 bins.
 Reduced chi-squared =
# Null hypothesis probability of 2.52e-01 with 57 degrees of freedom

Energy  Fluence     90% Error
[keV]   [erg/cm2]   [erg/cm2]
15- 25  2.076e-07   1.017e-07
25- 50  3.865e-07   1.871e-07
50-150  7.730e-07   4.423e-07
15-150  1.367e-06   6.262e-07
Double BB
Spectral model: bbodyrad<1> + bbodyrad<2>
------------------------------------------------------------
Parameters  : value         Lower 90%    Upper 90%
kT1 [keV]   : 6.82389        (-2.41969      2.64384)
R1^2/D10^2  : 0.103427        (-0.0652986      0.371134)
kT2 [keV]   : 21.7660        (-5.61386      14.1645)
R2^2/D10^2  : 2.04704E-03    (-0.0017356   0.00481041)
------------------------------------------------------------
#Fit statistic  : Chi-Squared                   62.78     using 59 bins.
 Reduced chi-squared =
# Null hypothesis probability of 2.20e-01 with 55 degrees of freedom

Energy  Fluence     90% Error
[keV]   [erg/cm2]   [erg/cm2]
15- 25  1.940e-07   9.441e-08
25- 50  4.010e-07   1.739e-07
50-150  7.279e-07   4.082e-07
15-150  1.323e-06   6.288e-07
Peak spectrum fit
Power-law model

Time interval is from    3.120 sec. to    4.120 sec.

Spectral model in power-law:
------------------------------------------------------------
Parameters  : value       lower 90%   higher 90%
Photon index: 1.89980     ( -0.762013   0.857674 )
Norm@50keV  : 3.04719E-03    ( -0.00143398   0.00121794 )
------------------------------------------------------------
#Fit statistic  : Chi-Squared                   62.47     using 59 bins.
 Reduced chi-squared = 1.09596
# Null hypothesis probability of 2.88e-01 with 57 degrees of freedom

Photon flux (15-150 keV)    in 1 sec: 0.437306 ( -0.136468  0.136276 ) ph/cm2/s
Energy fluence (15-150 keV)             : 2.80046e-08 ( -1.13333e-08  1.22801e-08 ) ergs/cm2
Cutoff power-law model
Time interval is from    3.120 sec. to    4.120 sec.
Spectral model in the cutoff power-law:
------------------------------------------------------------
Parameters  : value       lower 90%   higher 90%
Photon index: 3.44163     ( -1.71751   0.480888 )
Epeak [keV] : 382.208      (   )
Norm@50keV  : 5.77569E-04    (     )
------------------------------------------------------------
#Fit statistic  : Chi-Squared                   59.99     using 59 bins.
 Reduced chi-squared = 1.07125
# Null hypothesis probability of 3.33e-01 with 56 degrees of freedom

Photon flux (15-150 keV)    in 1 sec: 0.287310 ( -0.163216  0.22057 ) ph/cm2/s
Energy fluence (15-150 keV)             : 2.31627e-08 ( -1.35186e-08  7.142e-09 ) ergs/cm2
Band function

Time interval is from    3.120 sec. to    4.120 sec.


Spectral model in the Band function:
------------------------------------------------------------
Parameters  : value       lower 90%   higher 90%
alpha       :    (     )
beta        :     (     )
Epeak [keV] :       (   )
Norm@50keV   :     (     )
------------------------------------------------------------

Photon flux (15-150 keV)    in  sec:  (    ) ph/cm2/s
Energy fluence (15-150 keV)             : 0 ( 0  0 ) ergs/cm2
Single BB
Spectral model blackbody:
------------------------------------------------------------
Parameters  : value    Lower 90%  Upper 90%
kT [keV]    : 5.69139  (-1.64761  2.88784)
R^2/D10^2   : 1.80854  (-1.80834   6.64909)
(R is the radius in km and D10 is the distance to the source in units of 10 kpc)
------------------------------------------------------------
#Fit statistic  : Chi-Squared                   67.01     using 59 bins.
 Reduced chi-squared =
# Null hypothesis probability of 1.71e-01 with 57 degrees of freedom

Energy  Fluence     90% Error
[keV]   [erg/cm2]   [erg/cm2]
15- 25  7.187e-09   4.435e-09
25- 50  6.374e-09   4.436e-09
50-150  4.677e-10   4.685e-10
15-150  1.403e-08   8.795e-09
Thermal bremsstrahlung (OTTB)

Spectral model: thermal bremsstrahlung
------------------------------------------------------------
Parameters  : value         Lower 90%    Upper 90%
kT [keV]    : 159.305       (-161.385      -161.385)
Norm        : 1.71906       (-0.568132     3.32144)
------------------------------------------------------------
#Fit statistic  : Chi-Squared                   64.24     using 59 bins.
 Reduced chi-squared =
# Null hypothesis probability of 2.38e-01 with 57 degrees of freedom

Energy  Fluence     90% Error
[keV]   [erg/cm2]   [erg/cm2]
15- 25  4.391e-09   2.746e-09
25- 50  8.209e-09   4.841e-09
50-150  1.660e-08   1.073e-08
15-150  2.920e-08   1.851e-08
Double BB

Spectral model: bbodyrad<1> + bbodyrad<2>
------------------------------------------------------------
Parameters  : value         Lower 90%    Upper 90%
kT1 [keV]   : 5.03390        (-1.4424      2.07618)
R1^2/D10^2  : 2.85148        (-2.22027      9.81237)
kT2 [keV]   : 98.0560        (-68.8598      -99.3784)
R2^2/D10^2  : 2.63708E-04    (-0.000209696   0.00230807)
------------------------------------------------------------
#Fit statistic  : Chi-Squared                   55.51     using 59 bins.
 Reduced chi-squared =
# Null hypothesis probability of 4.55e-01 with 55 degrees of freedom

Energy  Fluence     90% Error
[keV]   [erg/cm2]   [erg/cm2]
15- 25  7.281e-09   4.410e-09
25- 50  5.996e-09   3.480e-09
50-150  2.478e-08   2.238e-08
15-150  3.805e-08   2.208e-08
Pre-slew spectrum (Pre-slew PHA with pre-slew DRM)
Power-law model

Spectral model in power-law:
------------------------------------------------------------
Parameters  : value       lower 90%   higher 90%
Photon index: 1.61754     ( -0.181027   0.184776 )
Norm@50keV  : 1.17744E-03    ( -0.000129056   0.000127496 )
------------------------------------------------------------
#Fit statistic  : Chi-Squared                   59.60     using 59 bins.
 Reduced chi-squared =
# Null hypothesis probability of 3.81e-01 with 57 degrees of freedom

Photon flux (15-150 keV)    in 79.89 sec: 0.152140 ( -0.01558  0.0155956 ) ph/cm2/s
Energy fluence (15-150 keV)             : 8.77895e-07 ( -1.02929e-07  1.04443e-07 ) ergs/cm2
Cutoff power-law model

Spectral model in the cutoff power-law:
------------------------------------------------------------
Parameters  : value       lower 90%   higher 90%
Photon index: 1.23920     ( -0.842539   0.525974 )
Epeak [keV] : 94.2465      ( -35.2276 -94.2496 )
Norm@50keV  : 1.87145E-03    ( -0.000800535   0.00331005 )
------------------------------------------------------------
#Fit statistic  : Chi-Squared                   58.81     using 59 bins.
 Reduced chi-squared =
# Null hypothesis probability of 3.73e-01 with 56 degrees of freedom

Photon flux (15-150 keV)    in 79.89 sec: 0.149455 ( -0.016449  0.016379 ) ph/cm2/s
Energy fluence (15-150 keV)             : 8.46602e-07 ( -1.18916e-07  1.19859e-07 ) ergs/cm2
Band function

Spectral model in the Band function:
------------------------------------------------------------
Parameters  : value       lower 90%   higher 90%
alpha       :    (     )
beta        :     (     )
Epeak [keV] :       (   )
Norm@50keV   :     (     )
------------------------------------------------------------

Photon flux (15-150 keV)    in  sec:  (    ) ph/cm2/s
Energy fluence (15-150 keV)             : 0 ( 0  0 ) ergs/cm2
S(25-50 keV) vs. S(50-100 keV) plot
S(25-50 keV)  = 3.70e-07
S(50-100 keV) = 4.80e-07
T90 vs. Hardness ratio plot
T90                                   = 177.883999943733 sec.
Hardness ratio (energy fluence ratio) = 1.2973
Color vs. Color plot

Count Ratio  (25-50 keV) / (15-25 keV) = 1.37806
Count Ratio (50-100 keV) / (15-25 keV) = 0.936792
Mask shadow pattern

IMX = -2.548909428459438E-02, IMY = -8.039038628206906E-02
TIME vs. PHA plot around the trigger time

TIME vs. DetID plot around the trigger time

100 us light curve (15-350 keV)
Spacecraft aspect plot
Bright source in the pre-burst/pre-slew/post-slew images
Pre-burst image of 15-350 keV band
Time interval of the image:
-239.000000 -6.792000

# RAcent  DECcent POSerr Theta    Phi  PeakCts   SNR AngSep     Name
#  [deg]    [deg]    ['] [deg]  [deg]                   [']
244.9951 -15.6306    0.6  29.7  139.1   9.9835  18.5    1.1	Sco X-1
254.3045  35.3829    8.4  31.2   20.2   0.6427   1.4    7.9	Her X-1
268.2502  -1.3621    3.9  37.8   91.5   3.4629   3.0    8.9	SW J1753.5-0127
268.4748  50.3790    2.4  49.0   14.1   3.3059   4.8 ------	UNKNOWN
267.6640  62.0164    3.3  56.7    3.2   5.1453   3.5 ------	UNKNOWN
192.8743  41.0425    3.7  45.6  -57.9   5.0558   3.2 ------	UNKNOWN
188.6090  -9.2770    3.2  48.1 -129.3   5.9852   3.6 ------	UNKNOWN
Pre-slew background subtracted image of 15-350 keV band
Time interval of the image:
-6.792000 73.100600

# RAcent  DECcent POSerr Theta    Phi  PeakCts   SNR AngSep     Name
#  [deg]    [deg]    ['] [deg]  [deg]                   [']
245.0247 -15.7910    5.3  29.8  139.2  -0.3755  -2.2    9.4	Sco X-1
254.3837  35.3046    3.7  31.2   20.4   0.4811   3.1    4.3	Her X-1
268.2185  -1.4256   30.5  37.8   91.6  -0.1553  -0.4    9.1	SW J1753.5-0127
236.4509   8.6116    0.7   4.8  107.6   1.7692  15.5 ------	UNKNOWN
Post-slew image of 15-350 keV band
Time interval of the image:
106.300600 744.700600

# RAcent  DECcent POSerr Theta    Phi  PeakCts   SNR AngSep     Name
#  [deg]    [deg]    ['] [deg]  [deg]                   [']
244.9845 -15.6352    0.5  25.7  138.3  26.0308  21.7    0.4	Sco X-1
254.5447  35.4744    9.1  31.5    6.5   1.4354   1.3    9.0	Her X-1
263.0649 -24.8157    7.9  42.3  120.4  -7.8877  -1.5    5.2	GX 1+4
268.4793  -1.5725    8.5  33.5   83.8   2.7661   1.4    9.8	SW J1753.5-0127
275.3428  44.0298    3.6  48.9   14.4   4.9992   3.2 ------	UNKNOWN
244.7036  15.9240    3.5  10.9   24.6   2.7142   3.3 ------	UNKNOWN
208.1406 -42.4347    2.7  57.2 -177.8  17.8136   4.3 ------	UNKNOWN
193.3771 -34.8972    3.1  59.6 -161.9  30.0885   3.7 ------	UNKNOWN
202.0626  42.9029    3.4  45.6  -57.8  15.5894   3.4 ------	UNKNOWN
190.6191  -6.4523    3.5  48.1 -129.2  14.7555   3.3 ------	UNKNOWN
Plot creation:
Sat Oct 19 18:22:25 EDT 2024