Estimated redshift from machine learning (Ukwatta et al. 2016) - may take a few minute to calcaulte
Image
Pre-slew 15.0-350.0 keV image (Event data)

#   RAcent    DECcent   POSerr    Theta     Phi              Peak Cts       SNR   Name
   37.8430    59.0467   0.0160     8.9224   -99.6067         1.1422355     11.992 TRIG_01245636

Foreground time interval of the image:
 -6.696  53.260 (delta_t =  59.956 [sec])
Background time interval of the image:
-209.499  -6.696 (delta_t = 202.803 [sec])
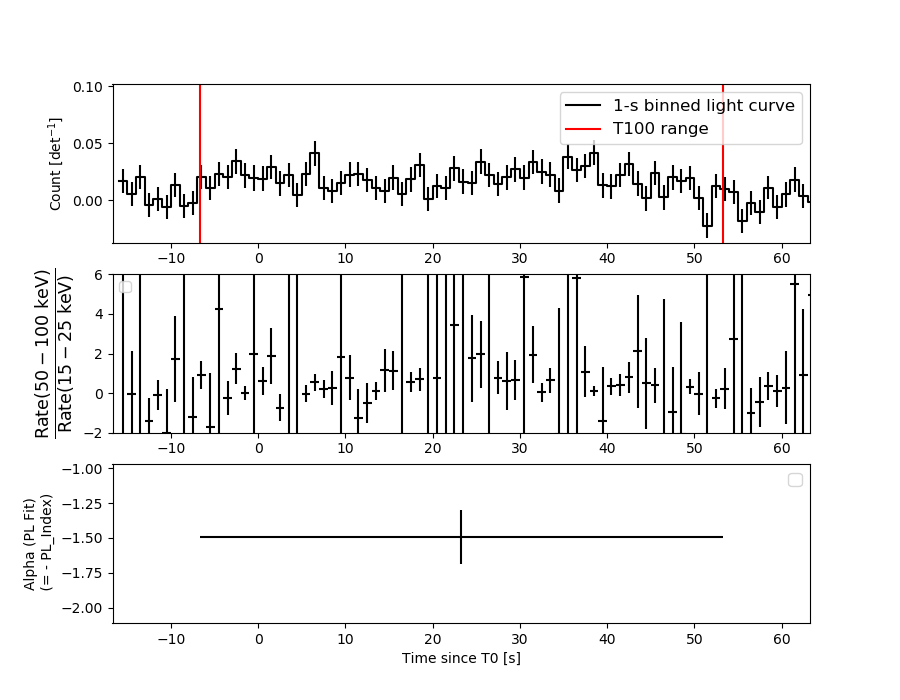
Lightcurves
Notes:
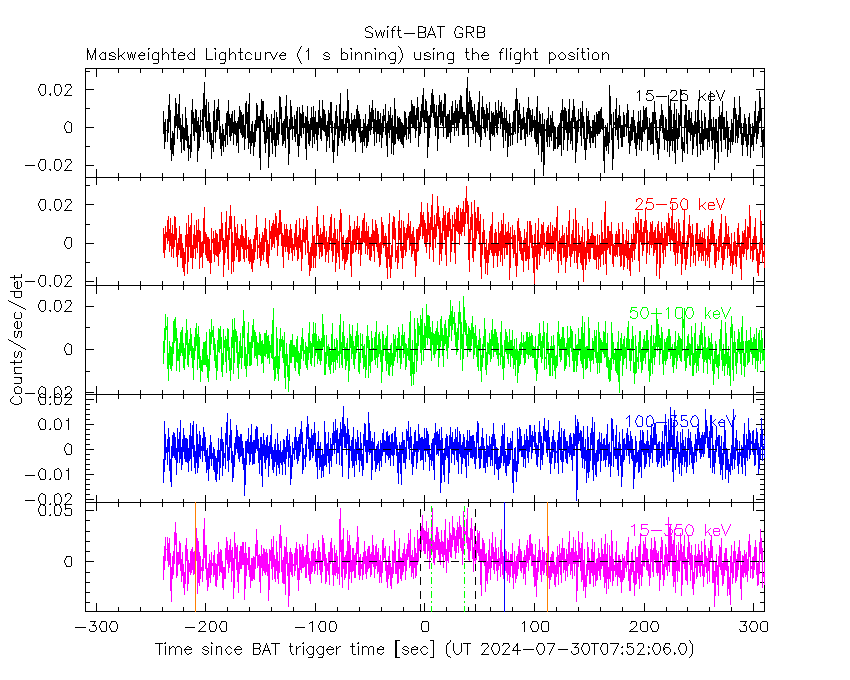
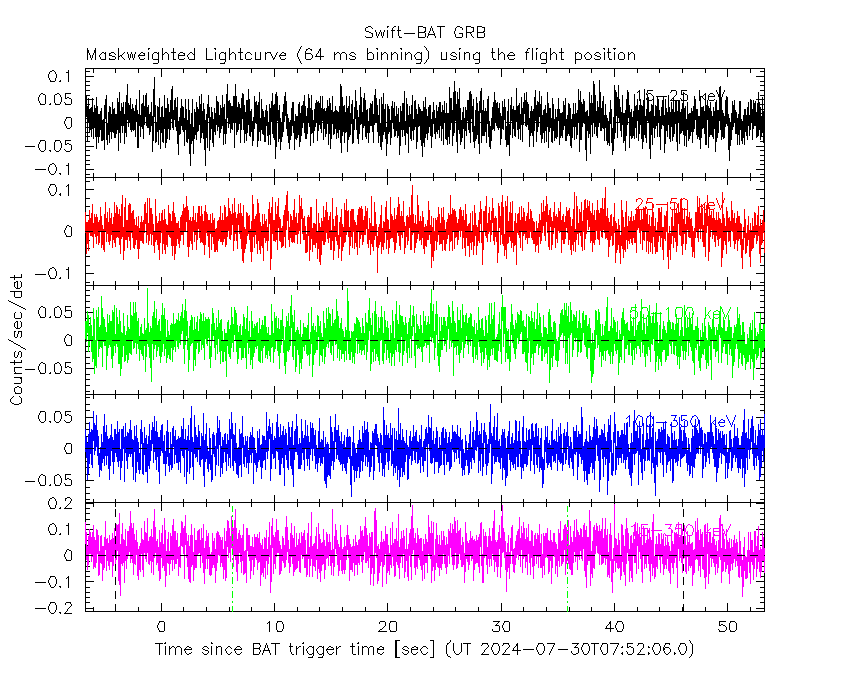
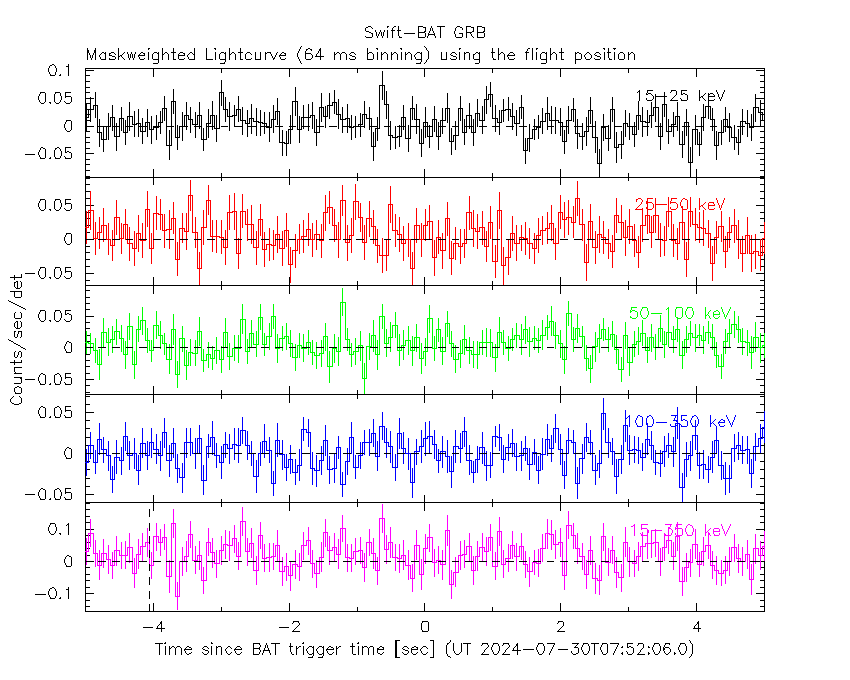
- 1) The mask-weighted light curves are using the flight position.
- 2) Multiple plots of different time binning/intervals are shown to cover all scenarios of short/long GRBs, rate/image triggers, and real/false positives.
- 3) For all the mask-weighted lightcurves, the y-axis units are counts/sec/det where a det is 0.4 x 0.4 = 0.16 sq cm.
- 4) The verticle lines correspond to following: green dotted lines are T50 interval, black dotted lines are T90 interval, blue solid line(s) is a spacecraft slew start time, and orange solid line(s) is a spacecraft slew end time.
- 5) Time of each bin is in the middle of the bin.
1 s binning
From T0-310 s to T0+310 s
From T100_start - 20 s to T100_end + 30 s

Full time interval

64 ms binning
Full time interval

From T100_start to T100_end
From T0-5 sec to T0+5 sec
16 ms binning
From T100_start-5 s to T100_start+5 s

Blue+Cyan dotted lines: Time interval of the scaled map
From 0.000000 to 64.000000
8 ms binning
From T100_start-3 s to T100_start+3 s

Blue+Cyan dotted lines: Time interval of the scaled map
From 0.000000 to 64.000000
2 ms binning
From T100_start-1 s to T100_start+1 s

Blue+Cyan dotted lines: Time interval of the scaled map
From 0.000000 to 64.000000
SN=5 or 10 sec. binning (whichever binning is satisfied first)

SN=5 or 10 sec. binning (T < 200 sec)

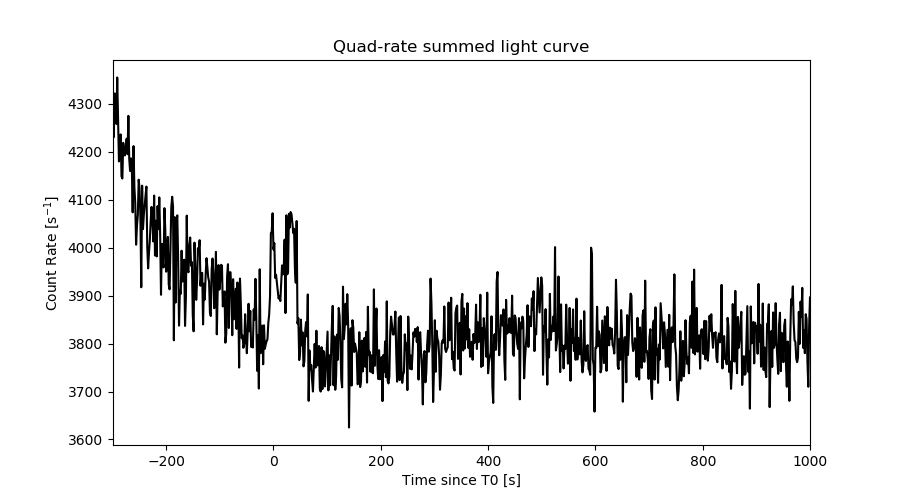
Quad-rate summed light curves (from T0-300s to T0+1000s)
Spectral Evolution
Spectra
Notes:
- 1) The fitting includes the systematic errors.
- 2) When the burst includes telescope slew time periods, the fitting uses an average response file made from multiple 5-s response files through out the slew time plus single time preiod for the non-slew times, and weighted by the total counts in the corresponding time period using addrmf. An average response file is needed becuase a spectral fit using the pre-slew DRM will introduce some errors in both a spectral shape and a normalization if the PHA file contains a lot of the slew/post-slew time interval.
- 3) For fits to more complicated models (e.g. a power-law over a cutoff power-law), the BAT team has decided to require a chi-square improvement of more than 6 for each extra dof.
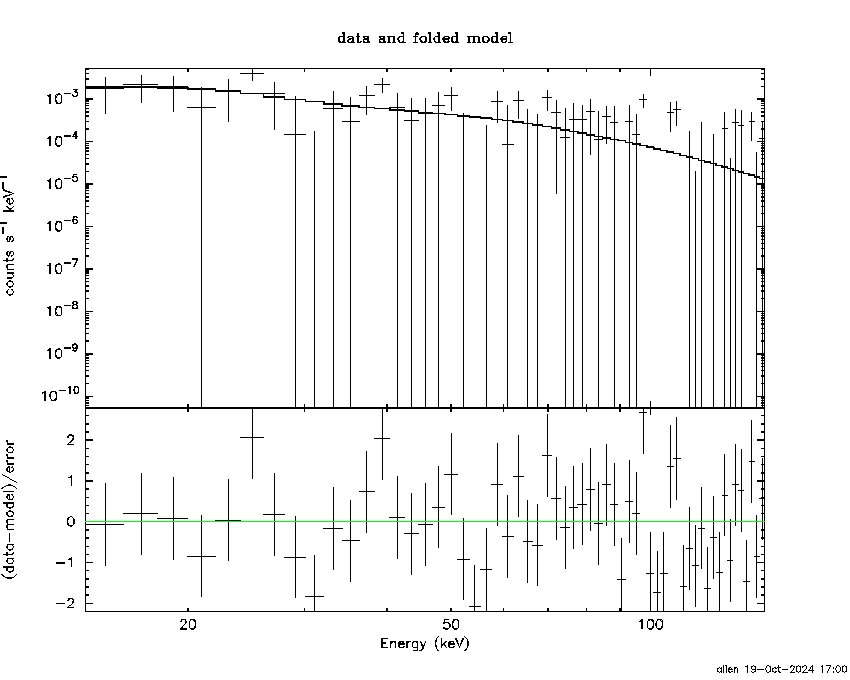
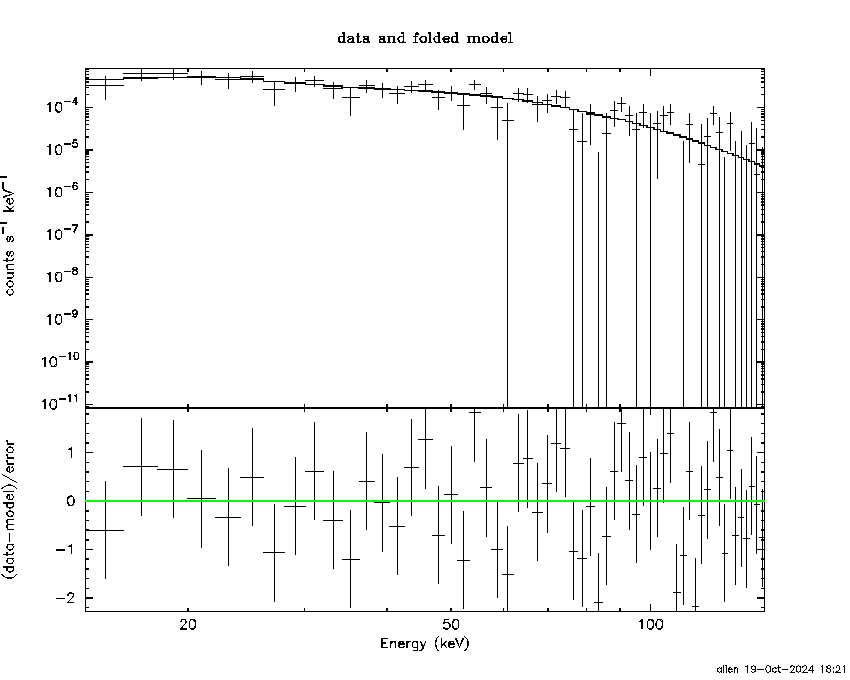
Time averaged spectrum fit using the average DRM
Power-law model
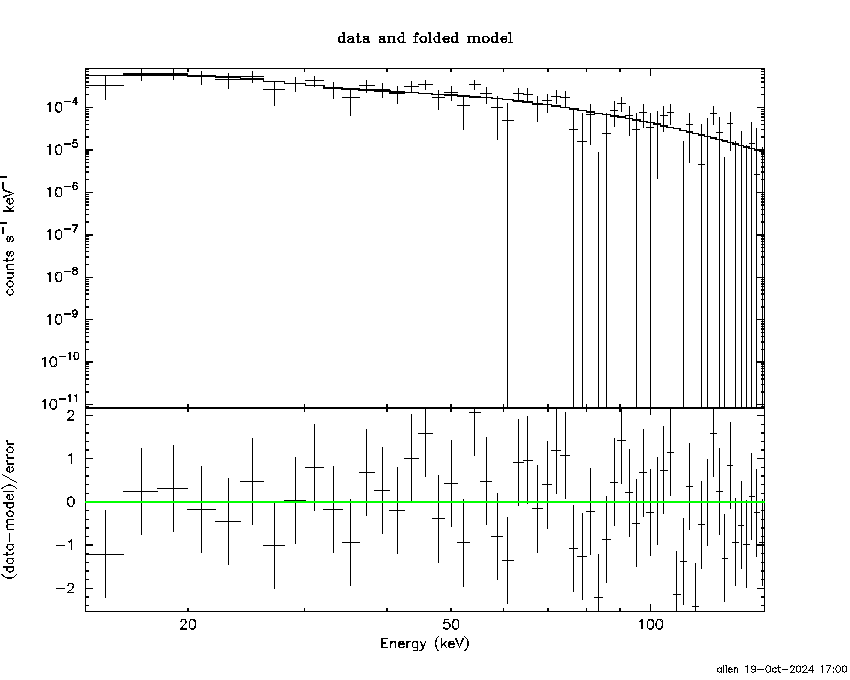
Time interval is from   -6.696 sec. to   53.260 sec.

Spectral model in power-law:
------------------------------------------------------------
Parameters  : value       lower 90%   higher 90%
Photon index: 1.49142     ( -0.192386   0.194856 )
Norm@50keV  : 1.20809E-03    ( -0.000144777   0.000143681 )
------------------------------------------------------------
#Fit statistic  : Chi-Squared                   55.71     using 59 bins.
 Reduced chi-squared = 0.977368
# Null hypothesis probability of 5.23e-01 with 57 degrees of freedom

Photon flux (15-150 keV)    in 59.96 sec: 0.150475 ( -0.017406  0.017421 ) ph/cm2/s
Energy fluence (15-150 keV)             : 6.88227e-07 ( -9.02122e-08  9.14264e-08 ) ergs/cm2
Cutoff power-law model

Time interval is from   -6.696 sec. to   53.260 sec.
Spectral model in the cutoff power-law:
------------------------------------------------------------
Parameters  : value       lower 90%   higher 90%
Photon index: 0.644144     ( -0.980129   0.795744 )
Epeak [keV] : 77.5468      ( -20.3857 300.083 )
Norm@50keV  : 3.32000E-03    ( -0.00200467   0.00703117 )
------------------------------------------------------------
#Fit statistic  : Chi-Squared                   52.37     using 59 bins.
 Reduced chi-squared = 0.935179
# Null hypothesis probability of 6.13e-01 with 56 degrees of freedom

Photon flux (15-150 keV)    in 59.96 sec: 0.145603 ( -0.018091  0.018049 ) ph/cm2/s
Energy fluence (15-150 keV)             : 6.43904e-07 ( -9.72012e-08  1.00008e-07 ) ergs/cm2
Band function

Time interval is from   -6.696 sec. to   53.260 sec.


Spectral model in the Band function:
------------------------------------------------------------
Parameters  : value       lower 90%   higher 90%
alpha       :    (     )
beta        :     (     )
Epeak [keV] :       (   )
Norm@50keV   :     (     )
------------------------------------------------------------

Photon flux (15-150 keV)    in  sec:  (    ) ph/cm2/s
Energy fluence (15-150 keV)             : 0 ( 0  0 ) ergs/cm2
Single BB
Spectral model blackbody:
------------------------------------------------------------
Parameters  : value    Lower 90%  Upper 90%
kT [keV]    : 14.7022  (-1.88991  2.21464)
R^2/D10^2   : 1.87847E-02  (-0.00734269   0.0117287)
(R is the radius in km and D10 is the distance to the source in units of 10 kpc)
------------------------------------------------------------
#Fit statistic  : Chi-Squared                   62.13     using 59 bins.
 Reduced chi-squared =
# Null hypothesis probability of 2.98e-01 with 57 degrees of freedom

Energy  Fluence     90% Error
[keV]   [erg/cm2]   [erg/cm2]
15- 25  5.113e-08   1.062e-08
25- 50  1.994e-07   2.812e-08
50-150  2.907e-07   7.219e-08
15-150  5.412e-07   9.300e-08
Thermal bremsstrahlung (OTTB)
Spectral model: thermal bremsstrahlung
------------------------------------------------------------
Parameters  : value         Lower 90%    Upper 90%
kT [keV]    : 199.363       (-78.0457      -199.363)
Norm        : 0.618547       (-0.0704628     0.0705274)
------------------------------------------------------------
#Fit statistic  : Chi-Squared                   53.98     using 59 bins.
 Reduced chi-squared =
# Null hypothesis probability of 5.89e-01 with 57 degrees of freedom

Energy  Fluence     90% Error
[keV]   [erg/cm2]   [erg/cm2]
15- 25  9.235e-08   5.136e-08
25- 50  1.777e-07   9.869e-08
50-150  3.896e-07   2.133e-07
15-150  6.596e-07   3.580e-07
Double BB

Spectral model: bbodyrad<1> + bbodyrad<2>
------------------------------------------------------------
Parameters  : value         Lower 90%    Upper 90%
kT1 [keV]   : 5.35246        (-2.46141      4.79124)
R1^2/D10^2  : 0.298451        (-0.254605      1.13837)
kT2 [keV]   : 19.1681        (-3.90368      9.56134)
R2^2/D10^2  : 6.38554E-03    (-0.00561653   0.00893117)
------------------------------------------------------------
#Fit statistic  : Chi-Squared                   52.21     using 59 bins.
 Reduced chi-squared =
# Null hypothesis probability of 5.82e-01 with 55 degrees of freedom

Energy  Fluence     90% Error
[keV]   [erg/cm2]   [erg/cm2]
15- 25  8.428e-08   4.573e-08
25- 50  1.770e-07   8.334e-08
50-150  3.632e-07   1.989e-07
15-150  6.246e-07   2.879e-07
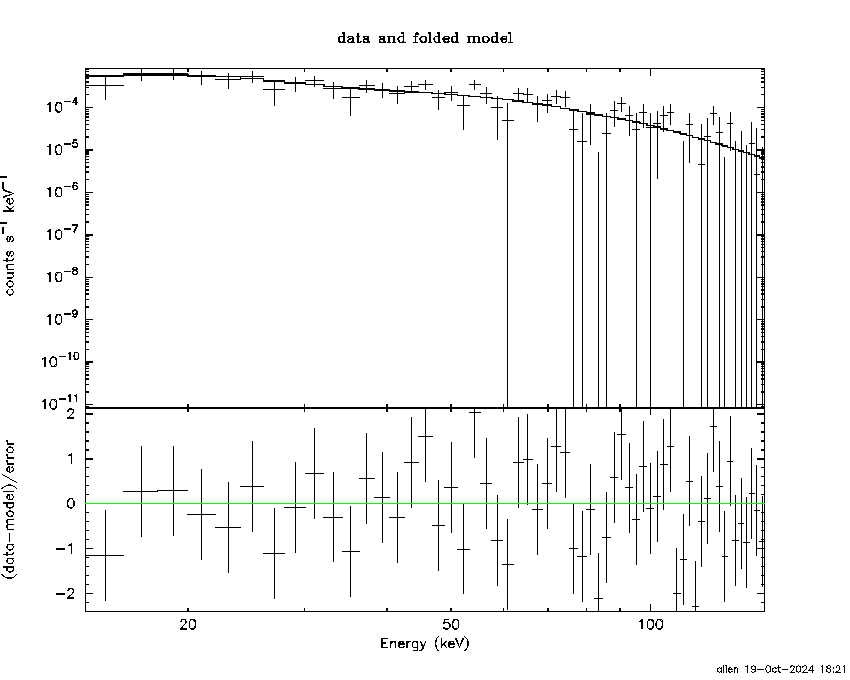
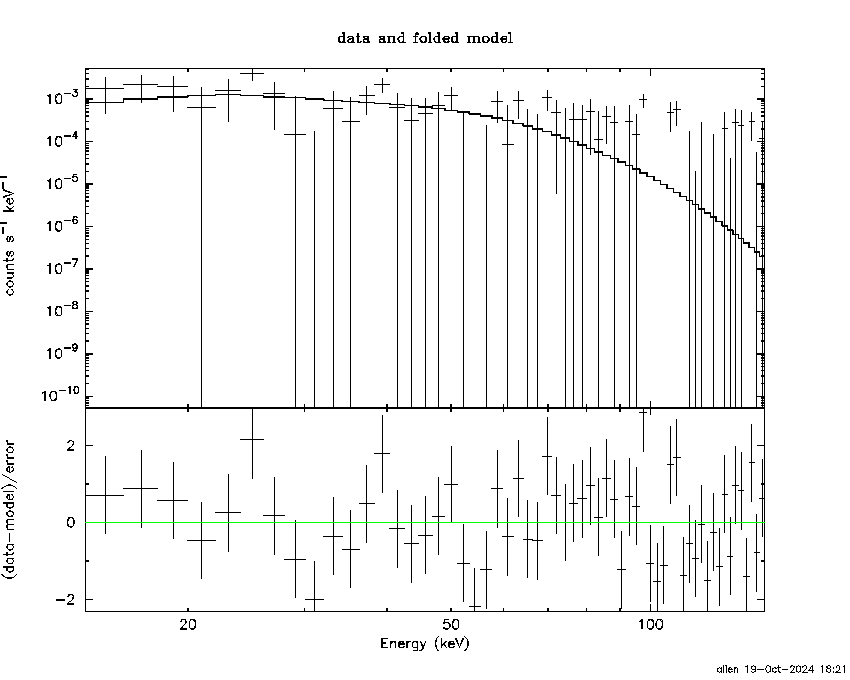
Peak spectrum fit
Power-law model
Time interval is from    5.800 sec. to    6.800 sec.

Spectral model in power-law:
------------------------------------------------------------
Parameters  : value       lower 90%   higher 90%
Photon index: 1.86095     ( -0.61334   0.761324 )
Norm@50keV  : 2.72566E-03    ( -0.00126984   0.00116489 )
------------------------------------------------------------
#Fit statistic  : Chi-Squared                   66.40     using 59 bins.
 Reduced chi-squared = 1.16491
# Null hypothesis probability of 1.85e-01 with 57 degrees of freedom

Photon flux (15-150 keV)    in 1 sec: 0.384859 ( -0.133575  0.133593 ) ph/cm2/s
Energy fluence (15-150 keV)             : 2.50634e-08 ( -1.0682e-08  1.14666e-08 ) ergs/cm2
Cutoff power-law model

Time interval is from    5.800 sec. to    6.800 sec.
Spectral model in the cutoff power-law:
------------------------------------------------------------
Parameters  : value       lower 90%   higher 90%
Photon index: 1.45348     ( -2.93118   1.2529 )
Epeak [keV] : 59.8252      ( -59.3191 -59.9106 )
Norm@50keV  : 4.61200E-03    ( -0.00460228   0.22619 )
------------------------------------------------------------
#Fit statistic  : Chi-Squared                   66.29     using 59 bins.
 Reduced chi-squared = 1.18375
# Null hypothesis probability of 1.63e-01 with 56 degrees of freedom

Photon flux (15-150 keV)    in 1 sec: 0.381262 ( -0.134072  0.134698 ) ph/cm2/s
Energy fluence (15-150 keV)             : 2.43187e-08 ( -1.07108e-08  1.25689e-08 ) ergs/cm2
Band function

Time interval is from    5.800 sec. to    6.800 sec.


Spectral model in the Band function:
------------------------------------------------------------
Parameters  : value       lower 90%   higher 90%
alpha       :    (     )
beta        :     (     )
Epeak [keV] :       (   )
Norm@50keV   :     (     )
------------------------------------------------------------

Photon flux (15-150 keV)    in  sec:  (    ) ph/cm2/s
Energy fluence (15-150 keV)             : 0 ( 0  0 ) ergs/cm2
Single BB
Spectral model blackbody:
------------------------------------------------------------
Parameters  : value    Lower 90%  Upper 90%
kT [keV]    : 11.5383  (-5.34155  8.18125)
R^2/D10^2   : 0.106668  (-0.103411   0.9206)
(R is the radius in km and D10 is the distance to the source in units of 10 kpc)
------------------------------------------------------------
#Fit statistic  : Chi-Squared                   69.08     using 59 bins.
 Reduced chi-squared =
# Null hypothesis probability of 1.31e-01 with 57 degrees of freedom

Energy  Fluence     90% Error
[keV]   [erg/cm2]   [erg/cm2]
15- 25  2.991e-09   1.858e-09
25- 50  8.980e-09   5.800e-09
50-150  6.996e-09   5.065e-09
15-150  1.897e-08   1.281e-08
Thermal bremsstrahlung (OTTB)
Spectral model: thermal bremsstrahlung
------------------------------------------------------------
Parameters  : value         Lower 90%    Upper 90%
kT [keV]    : 89.1523       (-89.1523      -89.1523)
Norm        : 1.76478       (-0.69509     1.32373)
------------------------------------------------------------
#Fit statistic  : Chi-Squared                   66.31     using 59 bins.
 Reduced chi-squared =
# Null hypothesis probability of 1.87e-01 with 57 degrees of freedom

Energy  Fluence     90% Error
[keV]   [erg/cm2]   [erg/cm2]
15- 25  4.603e-09   2.855e-09
25- 50  7.770e-09   4.733e-09
50-150  1.176e-08   9.900e-09
15-150  2.414e-08   1.768e-08
Double BB
Spectral model: bbodyrad<1> + bbodyrad<2>
------------------------------------------------------------
Parameters  : value         Lower 90%    Upper 90%
kT1 [keV]   : 4.29803        (-3.82609      6.57522)
R1^2/D10^2  : 3.07647        (-2.98983      -3.07647)
kT2 [keV]   : 18.5875        (-18.5869      56.9162)
R2^2/D10^2  : 1.55833E-02    (-0.015445   0.16271)
------------------------------------------------------------
#Fit statistic  : Chi-Squared                   65.73     using 59 bins.
 Reduced chi-squared =
# Null hypothesis probability of 1.52e-01 with 55 degrees of freedom

Energy  Fluence     90% Error
[keV]   [erg/cm2]   [erg/cm2]
15- 25  4.988e-09   3.044e-09
25- 50  6.780e-09   3.714e-09
50-150  1.279e-08   9.365e-09
15-150  2.456e-08   1.365e-08
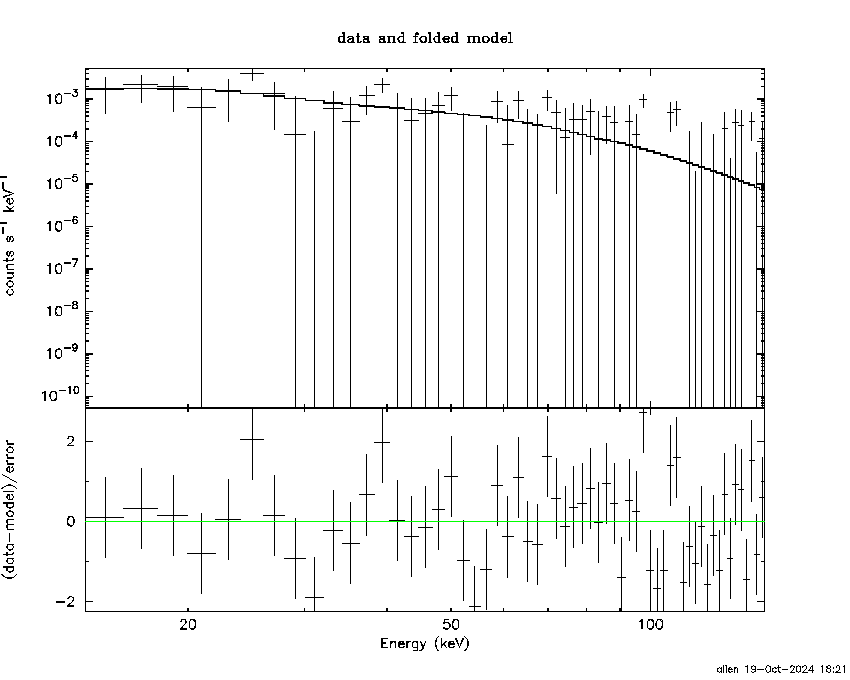
Pre-slew spectrum (Pre-slew PHA with pre-slew DRM)
Power-law model

Spectral model in power-law:
------------------------------------------------------------
Parameters  : value       lower 90%   higher 90%
Photon index: 1.49142     ( -0.192386   0.194856 )
Norm@50keV  : 1.20809E-03    ( -0.000144777   0.000143681 )
------------------------------------------------------------
#Fit statistic  : Chi-Squared                   55.71     using 59 bins.
 Reduced chi-squared =
# Null hypothesis probability of 5.23e-01 with 57 degrees of freedom

Photon flux (15-150 keV)    in 59.96 sec: 0.150471 ( -0.0174051  0.01742 ) ph/cm2/s
Energy fluence (15-150 keV)             : 6.88143e-07 ( -9.01876e-08  9.14444e-08 ) ergs/cm2
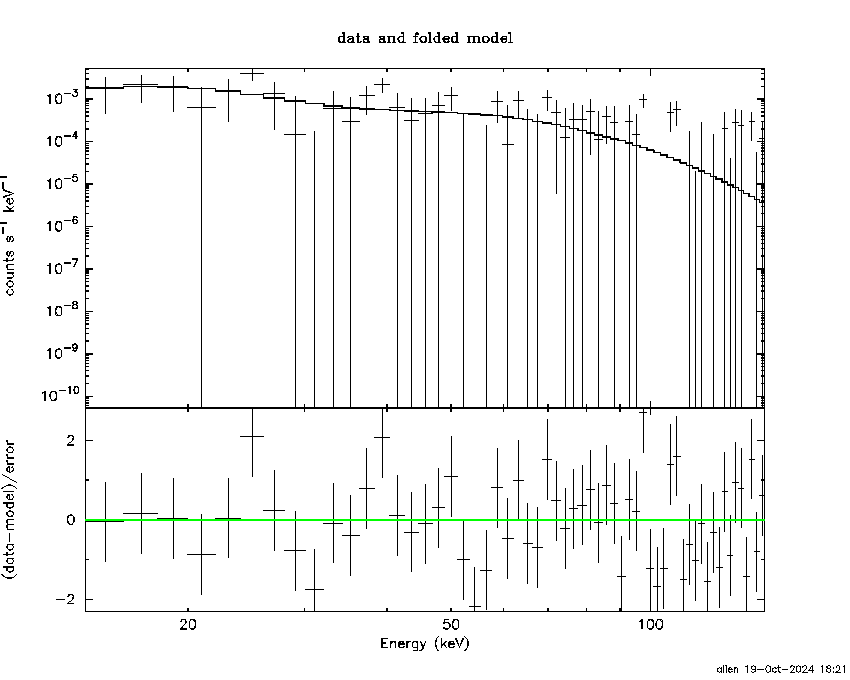
Cutoff power-law model
Spectral model in the cutoff power-law:
------------------------------------------------------------
Parameters  : value       lower 90%   higher 90%
Photon index: 0.644143     ( -0.980129   0.795744 )
Epeak [keV] : 77.5468      ( -20.3857 300.083 )
Norm@50keV  : 3.32001E-03    ( -0.00200467   0.00703117 )
------------------------------------------------------------
#Fit statistic  : Chi-Squared                   52.37     using 59 bins.
 Reduced chi-squared =
# Null hypothesis probability of 6.13e-01 with 56 degrees of freedom

Photon flux (15-150 keV)    in 59.96 sec: 0.145589 ( -0.018087  0.018045 ) ph/cm2/s
Energy fluence (15-150 keV)             : 6.4415e-07 ( -9.71814e-08  1.00091e-07 ) ergs/cm2
Band function

Spectral model in the Band function:
------------------------------------------------------------
Parameters  : value       lower 90%   higher 90%
alpha       :    (     )
beta        :     (     )
Epeak [keV] :       (   )
Norm@50keV   :     (     )
------------------------------------------------------------

Photon flux (15-150 keV)    in  sec:  (    ) ph/cm2/s
Energy fluence (15-150 keV)             : 0 ( 0  0 ) ergs/cm2
S(25-50 keV) vs. S(50-100 keV) plot
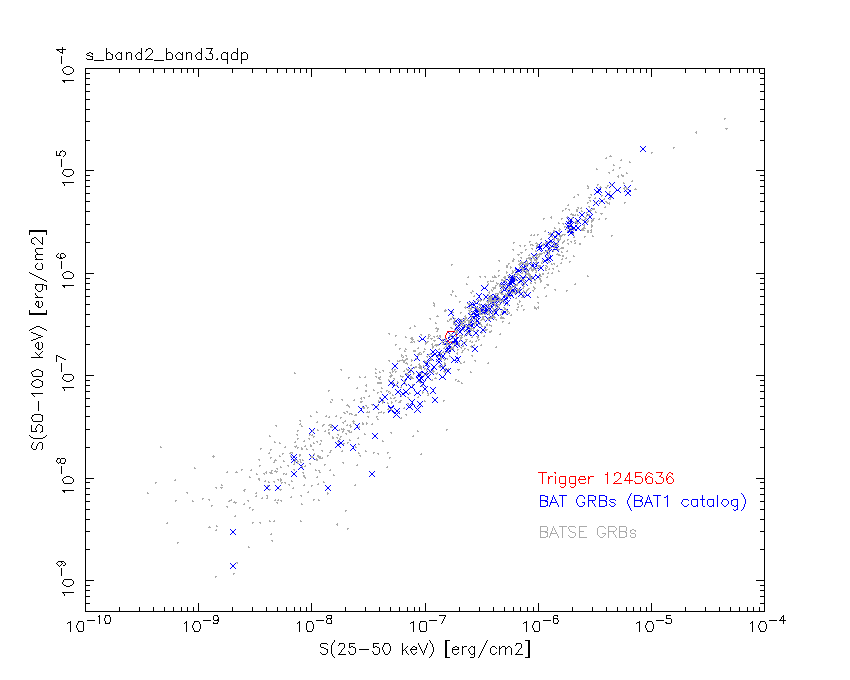
S(25-50 keV)  = 1.70e-07
S(50-100 keV) = 2.41e-07
T90 vs. Hardness ratio plot

T90                                   = 50.1159999370575 sec.
Hardness ratio (energy fluence ratio) = 1.41765
Color vs. Color plot

Count Ratio  (25-50 keV) / (15-25 keV) = 1.37628
Count Ratio (50-100 keV) / (15-25 keV) = 1.04896
Mask shadow pattern
IMX = -2.620016867665400E-02, IMY = 1.547951701735723E-01
TIME vs. PHA plot around the trigger time

Blue+Cyan dotted lines: Time interval of the scaled map
From 0.000000 to 64.000000
TIME vs. DetID plot around the trigger time

Blue+Cyan dotted lines: Time interval of the scaled map
From 0.000000 to 64.000000
100 us light curve (15-350 keV)
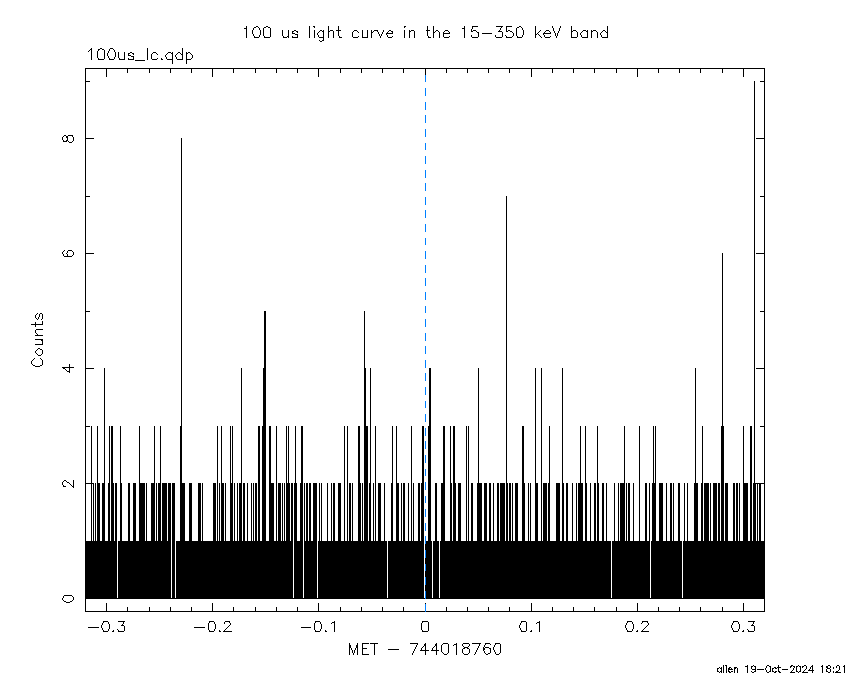
Blue+Cyan dotted lines: Time interval of the scaled map
From 0.000000 to 64.000000
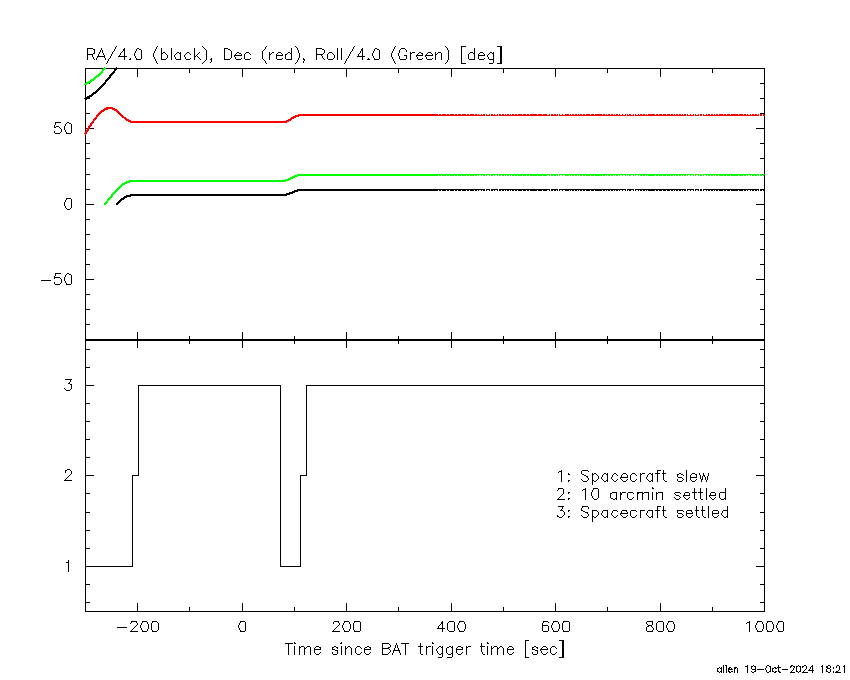
Spacecraft aspect plot
Bright source in the pre-burst/pre-slew/post-slew images
Pre-burst image of 15-350 keV band
Time interval of the image:
-209.499400 -6.696000

# RAcent  DECcent POSerr Theta    Phi  PeakCts   SNR AngSep     Name
#  [deg]    [deg]    ['] [deg]  [deg]                   [']
326.1163  38.4262    4.4  41.7  120.9  -4.0659  -2.6    6.8	Cyg X-2
 12.1897  18.3550    2.7  37.0   47.6   2.5405   4.3 ------	UNKNOWN
 37.2527  14.5815    2.8  41.0    9.0   1.8758   4.2 ------	UNKNOWN
213.5395  77.1245    2.3  48.5 -154.2   3.1264   5.0 ------	UNKNOWN
105.6884  60.1345    2.7  41.7 -103.7   5.3262   4.2 ------	UNKNOWN
Pre-slew background subtracted image of 15-350 keV band
Time interval of the image:
-6.696000 53.260000

# RAcent  DECcent POSerr Theta    Phi  PeakCts   SNR AngSep     Name
#  [deg]    [deg]    ['] [deg]  [deg]                   [']
326.0261  38.3854    7.8  41.8  120.9  -0.4985  -1.5    7.8	Cyg X-2
316.5715  41.1919    2.4  45.4  130.9   1.9818   4.8 ------	UNKNOWN
 37.8430  59.0467    1.0   8.9  -99.6   1.1422  12.0 ------	UNKNOWN
 60.0404   8.8620    2.1  53.6  -17.4   1.5918   5.5 ------	UNKNOWN
 63.5498   5.1777    2.4  58.5  -19.3   3.0410   4.9 ------	UNKNOWN
Post-slew image of 15-350 keV band
Time interval of the image:
111.700600 963.088600

# RAcent  DECcent POSerr Theta    Phi  PeakCts   SNR AngSep     Name
#  [deg]    [deg]    ['] [deg]  [deg]                   [']
356.4789  40.6631    2.4  31.6   84.7  10.1592   4.7 ------	UNKNOWN
  0.0413  37.8611    3.4  32.1   77.3   7.3294   3.4 ------	UNKNOWN
339.0380  58.8594    2.1  29.3  127.2   9.0144   5.4 ------	UNKNOWN
 39.7223  18.1418    2.9  40.9    9.0   6.2670   4.1 ------	UNKNOWN
142.6493  60.0692    3.3  47.3 -127.3  17.6262   3.6 ------	UNKNOWN
Plot creation:
Sat Oct 19 18:21:45 EDT 2024