Estimated redshift from machine learning (Ukwatta et al. 2016) - may take a few minute to calcaulte
Image
Pre-slew 15.0-350.0 keV image (Event data)

#   RAcent    DECcent   POSerr    Theta     Phi              Peak Cts       SNR   Name
  190.9202   -53.6019   0.0045    33.5952   -88.2971        10.5326067     43.099 TRIG_01246907

Foreground time interval of the image:
 -2.360  13.125 (delta_t =  15.485 [sec])
Background time interval of the image:
-239.576  -2.360 (delta_t = 237.216 [sec])
Lightcurves
Notes:
- 1) The mask-weighted light curves are using the flight position.
- 2) Multiple plots of different time binning/intervals are shown to cover all scenarios of short/long GRBs, rate/image triggers, and real/false positives.
- 3) For all the mask-weighted lightcurves, the y-axis units are counts/sec/det where a det is 0.4 x 0.4 = 0.16 sq cm.
- 4) The verticle lines correspond to following: green dotted lines are T50 interval, black dotted lines are T90 interval, blue solid line(s) is a spacecraft slew start time, and orange solid line(s) is a spacecraft slew end time.
- 5) Time of each bin is in the middle of the bin.
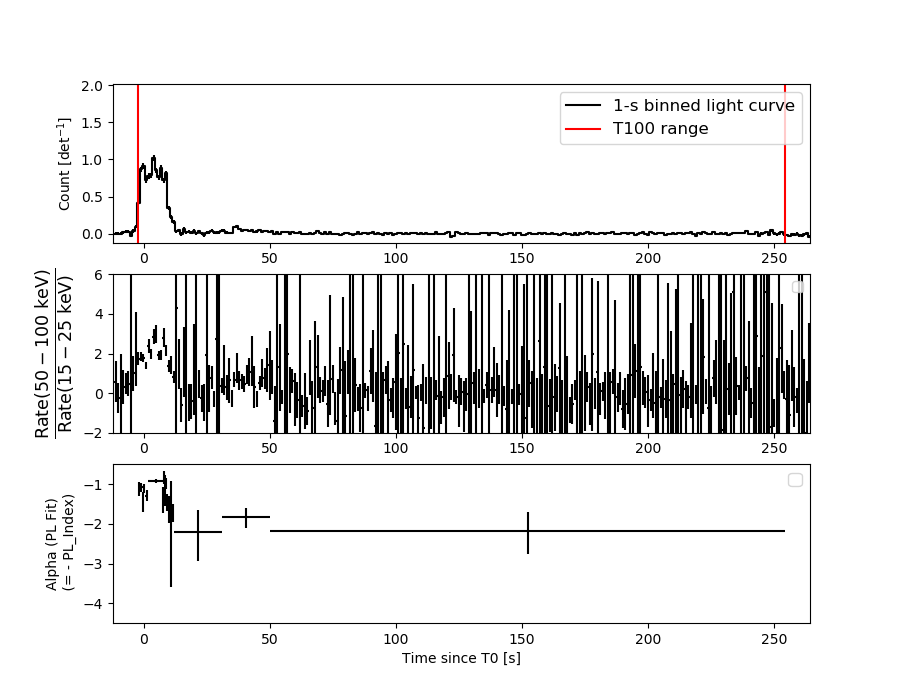
1 s binning
From T0-310 s to T0+310 s

From T100_start - 20 s to T100_end + 30 s

Full time interval

64 ms binning
Full time interval

From T100_start to T100_end

From T0-5 sec to T0+5 sec

16 ms binning
From T100_start-5 s to T100_start+5 s

Blue+Cyan dotted lines: Time interval of the scaled map
From 0.000000 to 1.024000
8 ms binning
From T100_start-3 s to T100_start+3 s

Blue+Cyan dotted lines: Time interval of the scaled map
From 0.000000 to 1.024000
2 ms binning
From T100_start-1 s to T100_start+1 s

Blue+Cyan dotted lines: Time interval of the scaled map
From 0.000000 to 1.024000
SN=5 or 10 sec. binning (whichever binning is satisfied first)

SN=5 or 10 sec. binning (T < 200 sec)

Quad-rate summed light curves (from T0-300s to T0+1000s)

Spectral Evolution
Spectra
Notes:
- 1) The fitting includes the systematic errors.
- 2) When the burst includes telescope slew time periods, the fitting uses an average response file made from multiple 5-s response files through out the slew time plus single time preiod for the non-slew times, and weighted by the total counts in the corresponding time period using addrmf. An average response file is needed becuase a spectral fit using the pre-slew DRM will introduce some errors in both a spectral shape and a normalization if the PHA file contains a lot of the slew/post-slew time interval.
- 3) For fits to more complicated models (e.g. a power-law over a cutoff power-law), the BAT team has decided to require a chi-square improvement of more than 6 for each extra dof.
Time averaged spectrum fit using the average DRM
Power-law model

Time interval is from   -2.360 sec. to  254.152 sec.

Spectral model in power-law:
------------------------------------------------------------
Parameters  : value       lower 90%   higher 90%
Photon index: 1.20471     ( -0.0624752   0.0620998 )
Norm@50keV  : 3.31535E-03    ( -0.000110739   0.000110518 )
------------------------------------------------------------
#Fit statistic  : Chi-Squared                   57.68     using 59 bins.
 Reduced chi-squared = 1.01193
# Null hypothesis probability of 4.50e-01 with 57 degrees of freedom

Photon flux (15-150 keV)    in 256.5 sec: 0.389416 ( -0.014019  0.014078 ) ph/cm2/s
Energy fluence (15-150 keV)             : 8.61701e-06 ( -2.98853e-07  2.99341e-07 ) ergs/cm2
Cutoff power-law model

Time interval is from   -2.360 sec. to  254.152 sec.
Spectral model in the cutoff power-law:
------------------------------------------------------------
Parameters  : value       lower 90%   higher 90%
Photon index: 1.21109     ( -0.0698211   0.065591 )
Epeak [keV] : 9999.36      ( -9999.36 -9999.36 )
Norm@50keV  : 3.29438E-03    ( -0.000109395   0.000799508 )
------------------------------------------------------------
#Fit statistic  : Chi-Squared                   58.13     using 59 bins.
 Reduced chi-squared = 1.03804
# Null hypothesis probability of 3.97e-01 with 56 degrees of freedom

Photon flux (15-150 keV)    in 256.5 sec: 0.389779 ( -0.016022  0.014311 ) ph/cm2/s
Energy fluence (15-150 keV)             : 8.62179e-06 ( -3.17403e-07  2.60145e-07 ) ergs/cm2
Band function

Time interval is from   -2.360 sec. to  254.152 sec.


Spectral model in the Band function:
------------------------------------------------------------
Parameters  : value       lower 90%   higher 90%
alpha       :    (     )
beta        :     (     )
Epeak [keV] :       (   )
Norm@50keV   :     (     )
------------------------------------------------------------

Photon flux (15-150 keV)    in  sec:  (    ) ph/cm2/s
Energy fluence (15-150 keV)             : 0 ( 0  0 ) ergs/cm2
Single BB

Spectral model blackbody:
------------------------------------------------------------
Parameters  : value    Lower 90%  Upper 90%
kT [keV]    : 21.1106  (  )
R^2/D10^2   : 1.46485E-02  (   )
(R is the radius in km and D10 is the distance to the source in units of 10 kpc)
------------------------------------------------------------
#Fit statistic  : Chi-Squared                  244.87     using 59 bins.
 Reduced chi-squared =
# Null hypothesis probability of 3.94e-25 with 57 degrees of freedom

Energy  Fluence     90% Error
[keV]   [erg/cm2]   [erg/cm2]
15- 25  3.156e-07   2.078e-08
25- 50  1.628e-06   8.824e-08
50-150  5.409e-06   2.886e-07
15-150  7.352e-06   2.809e-07
Thermal bremsstrahlung (OTTB)

Spectral model: thermal bremsstrahlung
------------------------------------------------------------
Parameters  : value         Lower 90%    Upper 90%
kT [keV]    : 199.363       (      )
Norm        : 1.66334       (     )
------------------------------------------------------------
#Fit statistic  : Chi-Squared                  162.76     using 59 bins.
 Reduced chi-squared =
# Null hypothesis probability of 4.11e-12 with 57 degrees of freedom

Energy  Fluence     90% Error
[keV]   [erg/cm2]   [erg/cm2]
15- 25  1.062e-06   4.040e-08
25- 50  2.044e-06   7.439e-08
50-150  4.482e-06   1.654e-07
15-150  7.588e-06   2.809e-07
Double BB

Spectral model: bbodyrad<1> + bbodyrad<2>
------------------------------------------------------------
Parameters  : value         Lower 90%    Upper 90%
kT1 [keV]   : 7.21355        (-1.01257      1.14974)
R1^2/D10^2  : 0.297717        (-0.117752      0.219311)
kT2 [keV]   : 31.7495        (-3.14866      4.34211)
R2^2/D10^2  : 3.43029E-03    (-0.00116924   0.00143275)
------------------------------------------------------------
#Fit statistic  : Chi-Squared                   62.42     using 59 bins.
 Reduced chi-squared =
# Null hypothesis probability of 2.29e-01 with 55 degrees of freedom

Energy  Fluence     90% Error
[keV]   [erg/cm2]   [erg/cm2]
15- 25  7.918e-07   1.070e-07
25- 50  1.799e-06   1.553e-07
50-150  6.048e-06   4.720e-07
15-150  8.639e-06   6.053e-07
Peak spectrum fit
Power-law model

Time interval is from    3.284 sec. to    4.284 sec.

Spectral model in power-law:
------------------------------------------------------------
Parameters  : value       lower 90%   higher 90%
Photon index: 0.796065     ( -0.105511   0.103183 )
Norm@50keV  : 6.92398E-02    ( -0.00445557   0.0044306 )
------------------------------------------------------------
#Fit statistic  : Chi-Squared                   54.85     using 59 bins.
 Reduced chi-squared = 0.962281
# Null hypothesis probability of 5.56e-01 with 57 degrees of freedom

Photon flux (15-150 keV)    in 1 sec: 0.385569 ( 0.027832  0.116535 ) ph/cm2/s
Energy fluence (15-150 keV)             : 8.1055e-07 ( -5.30197e-08  5.31442e-08 ) ergs/cm2
Cutoff power-law model

Time interval is from    3.284 sec. to    4.284 sec.
Spectral model in the cutoff power-law:
------------------------------------------------------------
Parameters  : value       lower 90%   higher 90%
Photon index: 0.269470     ( -0.469069   0.422733 )
Epeak [keV] : 201.344      ( -66.3747 489.098 )
Norm@50keV  : 0.115221    ( -0.0379208   0.0620249 )
------------------------------------------------------------
#Fit statistic  : Chi-Squared                   50.23     using 59 bins.
 Reduced chi-squared = 0.896964
# Null hypothesis probability of 6.92e-01 with 56 degrees of freedom

Photon flux (15-150 keV)    in 1 sec: 7.85617 ( -0.5079  0.50842 ) ph/cm2/s
Energy fluence (15-150 keV)             : 8.01475e-07 ( -5.47856e-08  5.45964e-08 ) ergs/cm2
Band function

Time interval is from    3.284 sec. to    4.284 sec.


Spectral model in the Band function:
------------------------------------------------------------
Parameters  : value       lower 90%   higher 90%
alpha       :    (     )
beta        :     (     )
Epeak [keV] :       (   )
Norm@50keV   :     (     )
------------------------------------------------------------

Photon flux (15-150 keV)    in  sec:  (    ) ph/cm2/s
Energy fluence (15-150 keV)             : 0 ( 0  0 ) ergs/cm2
Single BB

Spectral model blackbody:
------------------------------------------------------------
Parameters  : value    Lower 90%  Upper 90%
kT [keV]    : 25.8490  (-2.08176  2.36399)
R^2/D10^2   : 0.188080  (-0.0432894   0.0541617)
(R is the radius in km and D10 is the distance to the source in units of 10 kpc)
------------------------------------------------------------
#Fit statistic  : Chi-Squared                   74.75     using 59 bins.
 Reduced chi-squared =
# Null hypothesis probability of 5.74e-02 with 57 degrees of freedom

Energy  Fluence     90% Error
[keV]   [erg/cm2]   [erg/cm2]
15- 25  2.144e-08   2.790e-09
25- 50  1.237e-07   1.190e-08
50-150  6.095e-07   5.855e-08
15-150  7.546e-07   6.085e-08
Thermal bremsstrahlung (OTTB)

Spectral model: thermal bremsstrahlung
------------------------------------------------------------
Parameters  : value         Lower 90%    Upper 90%
kT [keV]    : 199.363       (      )
Norm        : 30.5519       (     )
------------------------------------------------------------
#Fit statistic  : Chi-Squared                  189.47     using 59 bins.
 Reduced chi-squared =
# Null hypothesis probability of 3.98e-16 with 57 degrees of freedom

Energy  Fluence     90% Error
[keV]   [erg/cm2]   [erg/cm2]
15- 25  7.608e-08   5.770e-09
25- 50  1.464e-07   1.735e-08
50-150  3.210e-07   7.585e-08
15-150  5.434e-07   9.460e-08
Double BB

Spectral model: bbodyrad<1> + bbodyrad<2>
------------------------------------------------------------
Parameters  : value         Lower 90%    Upper 90%
kT1 [keV]   : 9.80423        (-2.87388      3.95415)
R1^2/D10^2  : 1.45497        (-0.813305      2.47111)
kT2 [keV]   : 37.1962        (-6.74076      17.0483)
R2^2/D10^2  : 5.49265E-02    (-0.0373778   0.0498767)
------------------------------------------------------------
#Fit statistic  : Chi-Squared                   48.79     using 59 bins.
 Reduced chi-squared =
# Null hypothesis probability of 7.10e-01 with 55 degrees of freedom

Energy  Fluence     90% Error
[keV]   [erg/cm2]   [erg/cm2]
15- 25  3.861e-08   1.744e-08
25- 50  1.372e-07   4.612e-08
50-150  6.335e-07   2.248e-07
15-150  8.094e-07   2.860e-07
Pre-slew spectrum (Pre-slew PHA with pre-slew DRM)
Power-law model

Spectral model in power-law:
------------------------------------------------------------
Parameters  : value       lower 90%   higher 90%
Photon index: 1.04777     ( -0.0438339   0.0435912 )
Norm@50keV  : 4.53565E-02    ( -0.00111621   0.00111268 )
------------------------------------------------------------
#Fit statistic  : Chi-Squared                   51.04     using 59 bins.
 Reduced chi-squared =
# Null hypothesis probability of 6.97e-01 with 57 degrees of freedom

Photon flux (15-150 keV)    in 15.48 sec: 5.23768 ( -0.134318  0.134528 ) ph/cm2/s
Energy fluence (15-150 keV)             : 7.46789e-06 ( -1.84757e-07  1.8485e-07 ) ergs/cm2
Cutoff power-law model
Spectral model in the cutoff power-law:
------------------------------------------------------------
Parameters  : value       lower 90%   higher 90%
Photon index: 0.931251     ( -0.175842   0.137985 )
Epeak [keV] : 566.634      ( -566.634 -566.634 )
Norm@50keV  : 5.06524E-02    ( -0.00348289   0.00890731 )
------------------------------------------------------------
#Fit statistic  : Chi-Squared                   49.68     using 59 bins.
 Reduced chi-squared =
# Null hypothesis probability of 7.11e-01 with 56 degrees of freedom

Photon flux (15-150 keV)    in 15.48 sec: 5.20395 ( -0.14203  0.14214 ) ph/cm2/s
Energy fluence (15-150 keV)             : 7.44478e-06 ( -1.90218e-07  1.89584e-07 ) ergs/cm2
Band function
Spectral model in the Band function:
------------------------------------------------------------
Parameters  : value       lower 90%   higher 90%
alpha       :    (     )
beta        :     (     )
Epeak [keV] :       (   )
Norm@50keV   :     (     )
------------------------------------------------------------

Photon flux (15-150 keV)    in  sec:  (    ) ph/cm2/s
Energy fluence (15-150 keV)             : 0 ( 0  0 ) ergs/cm2
S(25-50 keV) vs. S(50-100 keV) plot

S(25-50 keV)  = 1.82e-06
S(50-100 keV) = 3.15e-06
T90 vs. Hardness ratio plot

T90                                   = 40.2439999580383 sec.
Hardness ratio (energy fluence ratio) = 1.73077
Color vs. Color plot

Count Ratio  (25-50 keV) / (15-25 keV) = 1.48801
Count Ratio (50-100 keV) / (15-25 keV) = 1.50516
Mask shadow pattern

IMX = 1.973969035050268E-02, IMY = 6.639847191198863E-01
TIME vs. PHA plot around the trigger time
Blue+Cyan dotted lines: Time interval of the scaled map
From 0.000000 to 1.024000
TIME vs. DetID plot around the trigger time

Blue+Cyan dotted lines: Time interval of the scaled map
From 0.000000 to 1.024000
100 us light curve (15-350 keV)

Blue+Cyan dotted lines: Time interval of the scaled map
From 0.000000 to 1.024000
Spacecraft aspect plot
Bright source in the pre-burst/pre-slew/post-slew images
Pre-burst image of 15-350 keV band
Time interval of the image:
-239.576000 -2.360000

# RAcent  DECcent POSerr Theta    Phi  PeakCts   SNR AngSep     Name
#  [deg]    [deg]    ['] [deg]  [deg]                   [']
170.2541 -60.4894   42.9  38.9 -108.7   0.2773   0.3    8.2	Cen X-3
186.4565 -62.6458   10.8  31.1 -105.2   0.5604   1.1    9.3	GX 301-2
244.9819 -15.6364    0.7  44.0    8.7   9.8783  15.6    0.3	Sco X-1
256.2312 -37.9292    0.0  21.4   26.8   0.2552   0.6   12.7	4U 1700-377
256.3869 -36.4942    8.6  22.8   26.8   0.5768   1.3    4.9	GX 349+2
262.9807 -24.7764    9.7  35.1   35.8   0.9260   1.2    2.4	GX 1+4
264.7266 -44.4711    3.6  16.3   50.8   1.3513   3.2    1.4	4U 1735-44
270.2747 -25.1488    8.1  36.1   47.0   1.2697   1.4    4.2	GX 5-1
270.3112 -25.7183    5.1  35.6   47.3  -1.9580  -2.3    1.6	GRS 1758-258
275.9652 -30.1879    0.0  32.9   58.3  -1.3043  -1.5   10.9	H1820-303
285.1214 -25.0098   53.4  40.8   67.3   0.4220   0.2    7.1	HT1900.1-2455
263.1055 -33.7777    7.7  26.3   39.1   0.7511   1.5    6.7	GX 354-0
286.4843 -35.4261    3.6  32.2   77.4   2.6336   3.2 ------	UNKNOWN
 22.7029 -67.0862    2.4  48.4  176.4   5.0830   4.8 ------	UNKNOWN
237.5743 -68.5115    3.0  11.5 -130.3   1.3571   3.9 ------	UNKNOWN
216.3744 -21.8335    2.8  45.6  -31.0   2.6653   4.1 ------	UNKNOWN
196.8363 -43.3436    2.7  37.2  -70.4   3.5262   4.4 ------	UNKNOWN
197.9702 -31.6087    3.3  45.6  -57.8   6.3762   3.5 ------	UNKNOWN
Pre-slew background subtracted image of 15-350 keV band
Time interval of the image:
-2.360000 13.124600

# RAcent  DECcent POSerr Theta    Phi  PeakCts   SNR AngSep     Name
#  [deg]    [deg]    ['] [deg]  [deg]                   [']
170.3536 -60.4176    0.0  38.9 -108.6  -0.7655  -2.3   12.4	Cen X-3
186.6820 -62.6752   38.6  31.0 -105.2   0.0607   0.3    5.7	GX 301-2
244.9076 -15.7805  166.6  43.8    8.6  -0.0112  -0.1    9.4	Sco X-1
256.1454 -37.9549    9.7  21.3   26.6   0.1265   1.2   10.0	4U 1700-377
256.2738 -36.4769   13.5  22.8   26.6  -0.0880  -0.8    8.4	GX 349+2
262.7858 -24.6741    0.0  35.2   35.4   0.0317   0.2   12.9	GX 1+4
264.8684 -44.3116    4.2  16.5   50.9   0.2700   2.8    9.9	4U 1735-44
270.3484 -25.0615   43.5  36.2   47.1  -0.0426  -0.3    3.6	GX 5-1
270.3137 -25.7769   17.3  35.5   47.3  -0.1014  -0.7    2.1	GRS 1758-258
275.7774 -30.4087    4.0  32.6   58.1   0.4451   2.9    8.0	H1820-303
284.9731 -24.8140    9.5  40.9   67.0  -0.3726  -1.2    7.3	HT1900.1-2455
263.1254 -33.8236    5.5  26.2   39.1  -0.2275  -2.1    6.8	GX 354-0
276.5717 -19.1501    3.0  43.5   53.2   1.2011   3.8 ------	UNKNOWN
230.8707  -4.4685    3.3  57.4   -6.6   1.8915   3.5 ------	UNKNOWN
 52.0462 -66.6723    2.4  53.2 -170.2   1.5505   4.7 ------	UNKNOWN
155.8858 -75.4392    2.8  35.4 -134.4   0.7387   4.0 ------	UNKNOWN
220.2753  -8.0576    2.2  56.9  -19.8   2.5798   5.1 ------	UNKNOWN
190.9202 -53.6019    0.3  33.6  -88.3  10.5323  43.1 ------	UNKNOWN
182.6685 -54.0229    2.5  37.3  -93.8   1.5371   4.6 ------	UNKNOWN
103.2452 -64.6210    2.8  54.1 -144.5   2.6655   4.1 ------	UNKNOWN
Post-slew image of 15-350 keV band
Time interval of the image:
84.924600 179.124600

# RAcent  DECcent POSerr Theta    Phi  PeakCts   SNR AngSep     Name
#  [deg]    [deg]    ['] [deg]  [deg]                   [']
135.6369 -40.4794   28.9  38.8 -131.0   0.1218   0.4    6.7	Vela X-1
170.0869 -60.5657    3.9  13.2 -167.7   0.5245   3.0    7.6	Cen X-3
186.5139 -62.9119    5.2   9.6  154.5   0.3447   2.2    9.4	GX 301-2
250.4109 -62.9263    3.0  31.4   93.5   1.3314   3.8 ------	UNKNOWN
188.8533 -55.2265    2.6   2.0  178.0   0.6767   4.5 ------	UNKNOWN
197.1799   3.0891    2.3  56.9  -30.2   4.5002   5.1 ------	UNKNOWN
151.3150 -24.7324    2.5  41.2  -99.1   3.3021   4.5 ------	UNKNOWN
Plot creation:
Sat Oct 19 18:21:04 EDT 2024