Estimated redshift from machine learning (Ukwatta et al. 2016) - may take a few minute to calcaulte
Image
Pre-slew 15.0-350.0 keV image (Event data)
#   RAcent    DECcent   POSerr    Theta     Phi              Peak Cts       SNR   Name
  254.2237    18.3170   0.0094    19.7996    30.8256         1.0544297     20.421 TRIG_01246989

Foreground time interval of the image:
 -0.756  11.237 (delta_t =  11.993 [sec])
Background time interval of the image:
-239.064  -0.756 (delta_t = 238.308 [sec])
Lightcurves
Notes:
- 1) The mask-weighted light curves are using the flight position.
- 2) Multiple plots of different time binning/intervals are shown to cover all scenarios of short/long GRBs, rate/image triggers, and real/false positives.
- 3) For all the mask-weighted lightcurves, the y-axis units are counts/sec/det where a det is 0.4 x 0.4 = 0.16 sq cm.
- 4) The verticle lines correspond to following: green dotted lines are T50 interval, black dotted lines are T90 interval, blue solid line(s) is a spacecraft slew start time, and orange solid line(s) is a spacecraft slew end time.
- 5) Time of each bin is in the middle of the bin.
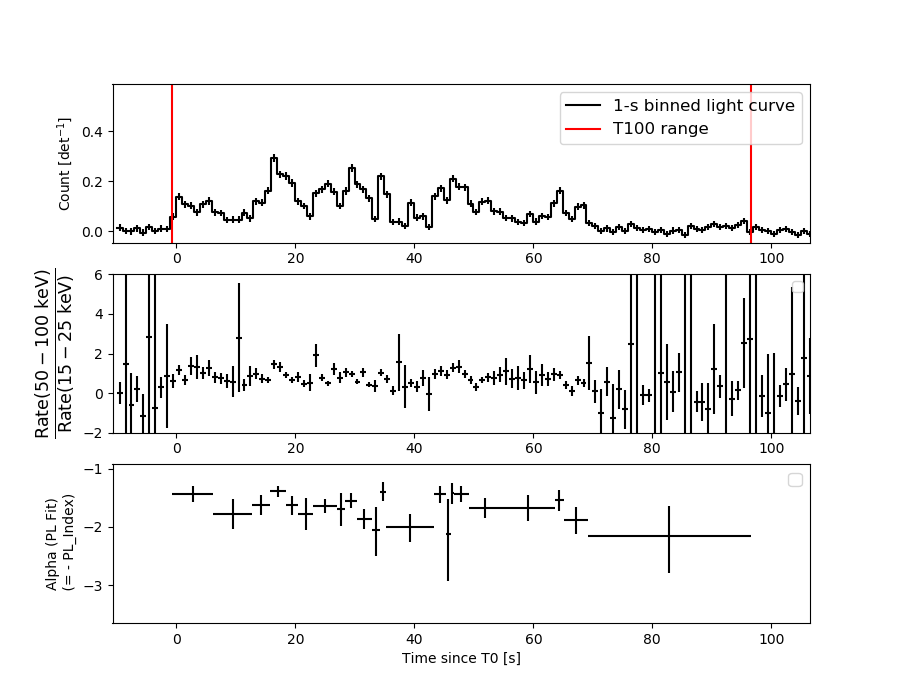
1 s binning
From T0-310 s to T0+310 s
From T100_start - 20 s to T100_end + 30 s
Full time interval
64 ms binning
Full time interval
From T100_start to T100_end

From T0-5 sec to T0+5 sec
16 ms binning
From T100_start-5 s to T100_start+5 s

Blue+Cyan dotted lines: Time interval of the scaled map
From 0.000000 to 1.024000
8 ms binning
From T100_start-3 s to T100_start+3 s
Blue+Cyan dotted lines: Time interval of the scaled map
From 0.000000 to 1.024000
2 ms binning
From T100_start-1 s to T100_start+1 s
Blue+Cyan dotted lines: Time interval of the scaled map
From 0.000000 to 1.024000
SN=5 or 10 sec. binning (whichever binning is satisfied first)
SN=5 or 10 sec. binning (T < 200 sec)
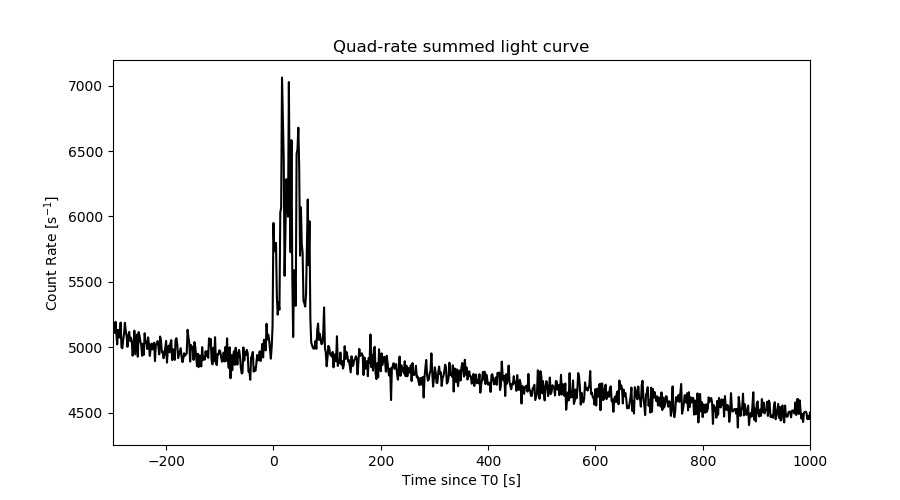
Quad-rate summed light curves (from T0-300s to T0+1000s)
Spectral Evolution
Spectra
Notes:
- 1) The fitting includes the systematic errors.
- 2) When the burst includes telescope slew time periods, the fitting uses an average response file made from multiple 5-s response files through out the slew time plus single time preiod for the non-slew times, and weighted by the total counts in the corresponding time period using addrmf. An average response file is needed becuase a spectral fit using the pre-slew DRM will introduce some errors in both a spectral shape and a normalization if the PHA file contains a lot of the slew/post-slew time interval.
- 3) For fits to more complicated models (e.g. a power-law over a cutoff power-law), the BAT team has decided to require a chi-square improvement of more than 6 for each extra dof.
Time averaged spectrum fit using the average DRM
Power-law model
Time interval is from   -0.756 sec. to   96.516 sec.

Spectral model in power-law:
------------------------------------------------------------
Parameters  : value       lower 90%   higher 90%
Photon index: 1.70432     ( -0.0557253   0.0559771 )
Norm@50keV  : 5.27383E-03    ( -0.000158241   0.000157985 )
------------------------------------------------------------
#Fit statistic  : Chi-Squared                   60.86     using 59 bins.
 Reduced chi-squared = 1.06772
# Null hypothesis probability of 3.39e-01 with 57 degrees of freedom

Photon flux (15-150 keV)    in 97.27 sec: 0.701514 ( -0.022049  0.022113 ) ph/cm2/s
Energy fluence (15-150 keV)             : 4.74875e-06 ( -1.48527e-07  1.48913e-07 ) ergs/cm2
Cutoff power-law model
Time interval is from   -0.756 sec. to   96.516 sec.
Spectral model in the cutoff power-law:
------------------------------------------------------------
Parameters  : value       lower 90%   higher 90%
Photon index: 1.04726     ( -0.26558   0.250003 )
Epeak [keV] : 71.9689      ( -8.18034 15.1298 )
Norm@50keV  : 1.11601E-02    ( -0.00271523   0.00387413 )
------------------------------------------------------------
#Fit statistic  : Chi-Squared                   38.83     using 59 bins.
 Reduced chi-squared = 0.693393
# Null hypothesis probability of 9.61e-01 with 56 degrees of freedom

Photon flux (15-150 keV)    in 97.27 sec: 0.668007 ( -0.024887  0.025024 ) ph/cm2/s
Energy fluence (15-150 keV)             : 4.4732e-06 ( -1.78147e-07  1.78573e-07 ) ergs/cm2
Band function

Time interval is from   -0.756 sec. to   96.516 sec.


Spectral model in the Band function:
------------------------------------------------------------
Parameters  : value       lower 90%   higher 90%
alpha       :    (     )
beta        :     (     )
Epeak [keV] :       (   )
Norm@50keV   :     (     )
------------------------------------------------------------

Photon flux (15-150 keV)    in  sec:  (    ) ph/cm2/s
Energy fluence (15-150 keV)             : 0 ( 0  0 ) ergs/cm2
Single BB
Spectral model blackbody:
------------------------------------------------------------
Parameters  : value    Lower 90%  Upper 90%
kT [keV]    : 13.6889  (  )
R^2/D10^2   : 0.101869  (   )
(R is the radius in km and D10 is the distance to the source in units of 10 kpc)
------------------------------------------------------------
#Fit statistic  : Chi-Squared                  194.23     using 59 bins.
 Reduced chi-squared =
# Null hypothesis probability of 7.21e-17 with 57 degrees of freedom

Energy  Fluence     90% Error
[keV]   [erg/cm2]   [erg/cm2]
15- 25  3.930e-07   2.116e-08
25- 50  1.429e-06   4.912e-08
50-150  1.742e-06   1.007e-07
15-150  3.564e-06   1.133e-07
Thermal bremsstrahlung (OTTB)
Spectral model: thermal bremsstrahlung
------------------------------------------------------------
Parameters  : value         Lower 90%    Upper 90%
kT [keV]    : 131.060       (-16.1574      21.4441)
Norm        : 2.91775       (-0.11759     0.121941)
------------------------------------------------------------
#Fit statistic  : Chi-Squared                   41.04     using 59 bins.
 Reduced chi-squared =
# Null hypothesis probability of 9.45e-01 with 57 degrees of freedom

Energy  Fluence     90% Error
[keV]   [erg/cm2]   [erg/cm2]
15- 25  7.360e-07   4.421e-08
25- 50  1.336e-06   6.809e-08
50-150  2.487e-06   5.963e-07
15-150  4.559e-06   6.104e-07
Double BB

Spectral model: bbodyrad<1> + bbodyrad<2>
------------------------------------------------------------
Parameters  : value         Lower 90%    Upper 90%
kT1 [keV]   : 7.69389        (-1.02624      1.04747)
R1^2/D10^2  : 0.520973        (-0.163498      0.296313)
kT2 [keV]   : 23.7531        (-3.15297      4.74599)
R2^2/D10^2  : 9.75534E-03    (-0.00495404   0.00775171)
------------------------------------------------------------
#Fit statistic  : Chi-Squared                   43.78     using 59 bins.
 Reduced chi-squared =
# Null hypothesis probability of 8.62e-01 with 55 degrees of freedom

Energy  Fluence     90% Error
[keV]   [erg/cm2]   [erg/cm2]
15- 25  6.216e-07   6.279e-08
25- 50  1.387e-06   1.255e-07
50-150  2.417e-06   3.618e-07
15-150  4.425e-06   4.144e-07
Peak spectrum fit
Power-law model
Time interval is from   15.948 sec. to   16.948 sec.

Spectral model in power-law:
------------------------------------------------------------
Parameters  : value       lower 90%   higher 90%
Photon index: 1.31109     ( -0.137154   0.137085 )
Norm@50keV  : 1.99583E-02    ( -0.00168528   0.00168304 )
------------------------------------------------------------
#Fit statistic  : Chi-Squared                   81.86     using 59 bins.
 Reduced chi-squared = 1.43614
# Null hypothesis probability of 1.71e-02 with 57 degrees of freedom

Photon flux (15-150 keV)    in 1 sec: 2.38604 ( -0.20221  0.20238 ) ph/cm2/s
Energy fluence (15-150 keV)             : 1.96716e-07 ( -1.84986e-08  1.86762e-08 ) ergs/cm2
Cutoff power-law model
Time interval is from   15.948 sec. to   16.948 sec.
Spectral model in the cutoff power-law:
------------------------------------------------------------
Parameters  : value       lower 90%   higher 90%
Photon index: 0.375647     ( -0.688033   0.591602 )
Epeak [keV] : 87.7225      ( -18.8635 63.3692 )
Norm@50keV  : 5.87513E-02    ( -0.028541   0.0682619 )
------------------------------------------------------------
#Fit statistic  : Chi-Squared                   74.00     using 59 bins.
 Reduced chi-squared = 1.32143
# Null hypothesis probability of 5.39e-02 with 56 degrees of freedom

Photon flux (15-150 keV)    in 1 sec: 2.30678 ( -0.20874  0.20863 ) ph/cm2/s
Energy fluence (15-150 keV)             : 1.84014e-07 ( -2.02683e-08  2.04609e-08 ) ergs/cm2
Band function

Time interval is from   15.948 sec. to   16.948 sec.


Spectral model in the Band function:
------------------------------------------------------------
Parameters  : value       lower 90%   higher 90%
alpha       :    (     )
beta        :     (     )
Epeak [keV] :       (   )
Norm@50keV   :     (     )
------------------------------------------------------------

Photon flux (15-150 keV)    in  sec:  (    ) ph/cm2/s
Energy fluence (15-150 keV)             : 0 ( 0  0 ) ergs/cm2
Single BB
Spectral model blackbody:
------------------------------------------------------------
Parameters  : value    Lower 90%  Upper 90%
kT [keV]    : 16.3823  (-1.60061  1.80492)
R^2/D10^2   : 0.214081  (-0.0641153   0.0898335)
(R is the radius in km and D10 is the distance to the source in units of 10 kpc)
------------------------------------------------------------
#Fit statistic  : Chi-Squared                   89.10     using 59 bins.
 Reduced chi-squared =
# Null hypothesis probability of 4.19e-03 with 57 degrees of freedom

Energy  Fluence     90% Error
[keV]   [erg/cm2]   [erg/cm2]
15- 25  1.181e-08   1.933e-09
25- 50  5.072e-08   5.260e-09
50-150  9.597e-08   1.550e-08
15-150  1.585e-07   1.720e-08
Thermal bremsstrahlung (OTTB)
Spectral model: thermal bremsstrahlung
------------------------------------------------------------
Parameters  : value         Lower 90%    Upper 90%
kT [keV]    : 200.000       (-28.2379      -200)
Norm        : 9.85329       (-0.827578     0.827578)
------------------------------------------------------------
#Fit statistic  : Chi-Squared                   85.56     using 59 bins.
 Reduced chi-squared =
# Null hypothesis probability of 8.52e-03 with 57 degrees of freedom

Energy  Fluence     90% Error
[keV]   [erg/cm2]   [erg/cm2]
15- 25  2.453e-08   2.515e-09
25- 50  4.719e-08   1.373e-08
50-150  1.035e-07   4.760e-08
15-150  1.752e-07   4.713e-08
Double BB
Spectral model: bbodyrad<1> + bbodyrad<2>
------------------------------------------------------------
Parameters  : value         Lower 90%    Upper 90%
kT1 [keV]   : 8.08245        (-2.52027      3.52227)
R1^2/D10^2  : 1.17317        (-0.703072      2.40312)
kT2 [keV]   : 24.8197        (-5.45297      17.8618)
R2^2/D10^2  : 4.00269E-02    (-0.0344729   0.0655201)
------------------------------------------------------------
#Fit statistic  : Chi-Squared                   72.70     using 59 bins.
 Reduced chi-squared =
# Null hypothesis probability of 5.52e-02 with 55 degrees of freedom

Energy  Fluence     90% Error
[keV]   [erg/cm2]   [erg/cm2]
15- 25  1.826e-08   9.106e-09
25- 50  4.918e-08   1.833e-08
50-150  1.179e-07   6.015e-08
15-150  1.853e-07   8.542e-08
Pre-slew spectrum (Pre-slew PHA with pre-slew DRM)
Power-law model
Spectral model in power-law:
------------------------------------------------------------
Parameters  : value       lower 90%   higher 90%
Photon index: 1.51669     ( -0.130198   0.131561 )
Norm@50keV  : 5.62029E-03    ( -0.000426328   0.000424463 )
------------------------------------------------------------
#Fit statistic  : Chi-Squared                   89.72     using 59 bins.
 Reduced chi-squared =
# Null hypothesis probability of 3.68e-03 with 57 degrees of freedom

Photon flux (15-150 keV)    in 11.99 sec: 0.704830 ( -0.0526476  0.0527314 ) ph/cm2/s
Energy fluence (15-150 keV)             : 6.37563e-07 ( -5.29092e-08  5.34242e-08 ) ergs/cm2
Cutoff power-law model

Spectral model in the cutoff power-law:
------------------------------------------------------------
Parameters  : value       lower 90%   higher 90%
Photon index: 0.689229     ( -0.636676   0.553933 )
Epeak [keV] : 79.2444      ( -15.9944 58.391 )
Norm@50keV  : 1.45267E-02    ( -0.00670898   0.0151125 )
------------------------------------------------------------
#Fit statistic  : Chi-Squared                   82.81     using 59 bins.
 Reduced chi-squared =
# Null hypothesis probability of 1.15e-02 with 56 degrees of freedom

Photon flux (15-150 keV)    in 11.99 sec: 0.673386 ( -0.028265  0.056432 ) ph/cm2/s
Energy fluence (15-150 keV)             : 5.96738e-07 ( -5.85304e-08  5.95304e-08 ) ergs/cm2
Band function

Spectral model in the Band function:
------------------------------------------------------------
Parameters  : value       lower 90%   higher 90%
alpha       :    (     )
beta        :     (     )
Epeak [keV] :       (   )
Norm@50keV   :     (     )
------------------------------------------------------------

Photon flux (15-150 keV)    in  sec:  (    ) ph/cm2/s
Energy fluence (15-150 keV)             : 0 ( 0  0 ) ergs/cm2
S(25-50 keV) vs. S(50-100 keV) plot
S(25-50 keV)  = 1.28e-06
S(50-100 keV) = 1.59e-06
T90 vs. Hardness ratio plot
T90                                   = 64.9959999322891 sec.
Hardness ratio (energy fluence ratio) = 1.24219
Color vs. Color plot
Count Ratio  (25-50 keV) / (15-25 keV) = 1.30202
Count Ratio (50-100 keV) / (15-25 keV) = 0.812229
Mask shadow pattern

IMX = 3.091552619697618E-01, IMY = -1.844809990319657E-01
TIME vs. PHA plot around the trigger time
Blue+Cyan dotted lines: Time interval of the scaled map
From 0.000000 to 1.024000
TIME vs. DetID plot around the trigger time

Blue+Cyan dotted lines: Time interval of the scaled map
From 0.000000 to 1.024000
100 us light curve (15-350 keV)
Blue+Cyan dotted lines: Time interval of the scaled map
From 0.000000 to 1.024000
Spacecraft aspect plot
Bright source in the pre-burst/pre-slew/post-slew images
Pre-burst image of 15-350 keV band
Time interval of the image:
-239.064000 -0.756000

# RAcent  DECcent POSerr Theta    Phi  PeakCts   SNR AngSep     Name
#  [deg]    [deg]    ['] [deg]  [deg]                   [']
244.9861 -15.6445    0.5  25.7  132.7  13.3053  23.0    0.5	Sco X-1
254.5289  35.2018    7.7  31.3    1.2  -0.7428  -1.5    9.1	Her X-1
268.4380  -1.6378    5.2  33.5   78.3  -2.3253  -2.2   11.9	SW J1753.5-0127
253.4441  -6.0404    2.7  22.4  102.3   2.5820   4.3 ------	UNKNOWN
244.5050  62.0008    2.3  53.7  -23.3   5.5716   5.0 ------	UNKNOWN
Pre-slew background subtracted image of 15-350 keV band
Time interval of the image:
-0.756000 11.236600

# RAcent  DECcent POSerr Theta    Phi  PeakCts   SNR AngSep     Name
#  [deg]    [deg]    ['] [deg]  [deg]                   [']
245.0448 -15.5127   13.7  25.6  132.5  -0.0552  -0.8    8.5	Sco X-1
254.5044  35.1731    4.4  31.3    1.2   0.1439   2.6   10.4	Her X-1
268.3698  -1.4723    6.1  33.4   78.1  -0.1941  -1.9    1.2	SW J1753.5-0127
254.2236  18.3170    0.6  19.8   30.8   1.0544  20.4 ------	UNKNOWN
193.7370 -26.7094    2.7  54.4 -159.9   0.6496   4.2 ------	UNKNOWN
Post-slew image of 15-350 keV band
Time interval of the image:
66.236590 962.963200
1030.936000 1121.063500

# RAcent  DECcent POSerr Theta    Phi  PeakCts   SNR AngSep     Name
#  [deg]    [deg]    ['] [deg]  [deg]                   [']
244.9774 -15.6523    0.6  35.2  169.6  45.7402  20.7    0.7	Sco X-1
254.6841  35.3857    3.6  17.1  -24.8   4.6962   3.2   11.4	Her X-1
263.0130 -24.8887    8.2  44.1  142.5  -8.8631  -1.4    8.6	GX 1+4
268.3601  -1.4536   23.5  24.2  117.5  -1.0876  -0.5    0.5	SW J1753.5-0127
270.0489 -25.1561    0.0  46.1  134.0 -20.0580  -2.3   13.6	GX 5-1
270.2407 -25.6075    6.3  46.6  134.0  15.3419   1.8    8.8	GRS 1758-258
273.9810 -14.1640    8.5  37.9  121.8   7.8361   1.4    7.8	GX 17+2
288.8075  10.8923    6.3  34.2   71.7   7.8807   1.8    3.2	GRS 1915+105
299.6137  35.1824    1.1  43.4   31.8  36.8710  11.0    1.6	Cyg X-1
308.2557  41.0493   11.5  51.2   25.6   4.2909   1.0    8.8	Cyg X-3
285.7920   8.6771    3.2  32.1   77.3  12.8716   3.6 ------	UNKNOWN
267.1014  -8.0635    2.3  29.3  127.3  13.8061   5.1 ------	UNKNOWN
215.6310  52.7963    4.7  45.7  -57.8  18.0491   2.5 ------	UNKNOWN
207.8793   4.6220    3.0  47.3 -127.0  30.2011   3.8 ------	UNKNOWN
Plot creation:
Sat Oct 19 18:20:22 EDT 2024