Estimated redshift from machine learning (Ukwatta et al. 2016) - may take a few minute to calcaulte
Image
Pre-slew 15.0-350.0 keV image (Event data)
#   RAcent    DECcent   POSerr    Theta     Phi              Peak Cts       SNR   Name
  237.5449    -2.3304   0.0025    28.3437   162.1724        10.7599069     76.298 TRIG_01247745

Foreground time interval of the image:
 -9.216  10.549 (delta_t =  19.765 [sec])
Background time interval of the image:
-239.552  -9.216 (delta_t = 230.336 [sec])
Lightcurves
Notes:
- 1) The mask-weighted light curves are using the flight position.
- 2) Multiple plots of different time binning/intervals are shown to cover all scenarios of short/long GRBs, rate/image triggers, and real/false positives.
- 3) For all the mask-weighted lightcurves, the y-axis units are counts/sec/det where a det is 0.4 x 0.4 = 0.16 sq cm.
- 4) The verticle lines correspond to following: green dotted lines are T50 interval, black dotted lines are T90 interval, blue solid line(s) is a spacecraft slew start time, and orange solid line(s) is a spacecraft slew end time.
- 5) Time of each bin is in the middle of the bin.
1 s binning
From T0-310 s to T0+310 s
From T100_start - 20 s to T100_end + 30 s

Full time interval

64 ms binning
Full time interval

From T100_start to T100_end
From T0-5 sec to T0+5 sec
16 ms binning
From T100_start-5 s to T100_start+5 s

Blue+Cyan dotted lines: Time interval of the scaled map
From 0.000000 to 0.512000
8 ms binning
From T100_start-3 s to T100_start+3 s

Blue+Cyan dotted lines: Time interval of the scaled map
From 0.000000 to 0.512000
2 ms binning
From T100_start-1 s to T100_start+1 s

Blue+Cyan dotted lines: Time interval of the scaled map
From 0.000000 to 0.512000
SN=5 or 10 sec. binning (whichever binning is satisfied first)

SN=5 or 10 sec. binning (T < 200 sec)
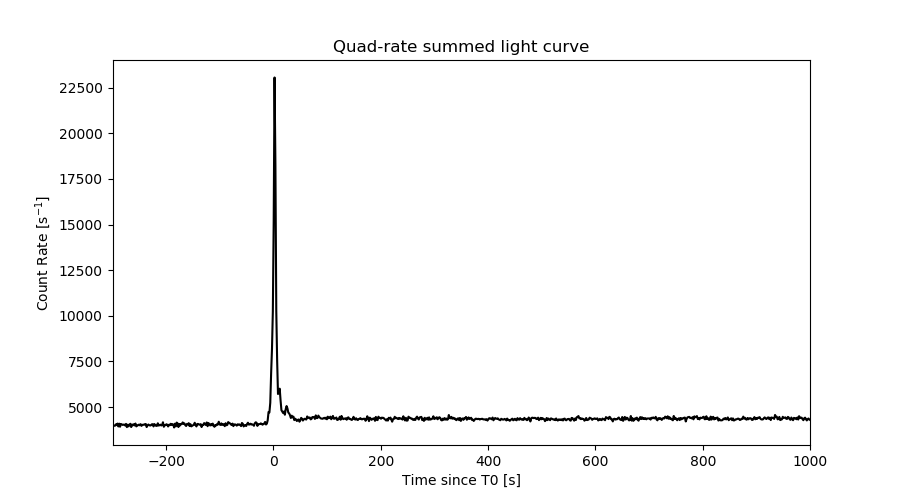
Quad-rate summed light curves (from T0-300s to T0+1000s)
Spectral Evolution
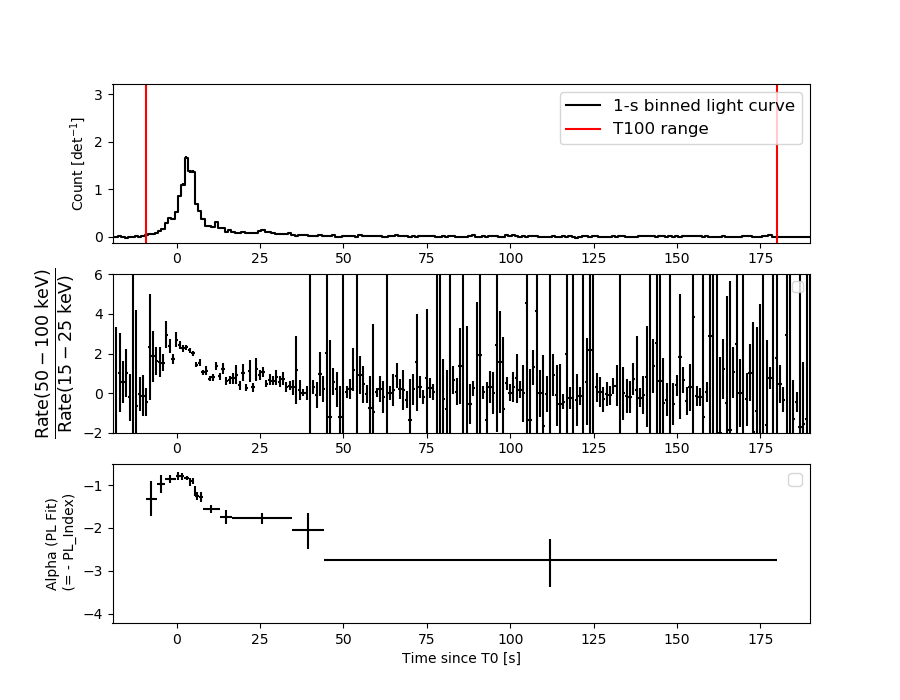
Spectra
Notes:
- 1) The fitting includes the systematic errors.
- 2) When the burst includes telescope slew time periods, the fitting uses an average response file made from multiple 5-s response files through out the slew time plus single time preiod for the non-slew times, and weighted by the total counts in the corresponding time period using addrmf. An average response file is needed becuase a spectral fit using the pre-slew DRM will introduce some errors in both a spectral shape and a normalization if the PHA file contains a lot of the slew/post-slew time interval.
- 3) For fits to more complicated models (e.g. a power-law over a cutoff power-law), the BAT team has decided to require a chi-square improvement of more than 6 for each extra dof.
Time averaged spectrum fit using the average DRM
Power-law model

Time interval is from   -9.216 sec. to  179.904 sec.

Spectral model in power-law:
------------------------------------------------------------
Parameters  : value       lower 90%   higher 90%
Photon index: 1.15560     ( -0.0472237   0.0469504 )
Norm@50keV  : 4.98747E-03    ( -0.000119502   0.000118853 )
------------------------------------------------------------
#Fit statistic  : Chi-Squared                   59.64     using 59 bins.
 Reduced chi-squared = 1.04632
# Null hypothesis probability of 3.80e-01 with 57 degrees of freedom

Photon flux (15-150 keV)    in 189.1 sec: 0.582032 ( -0.015246  0.015305 ) ph/cm2/s
Energy fluence (15-150 keV)             : 9.69374e-06 ( -2.28938e-07  2.29e-07 ) ergs/cm2
Cutoff power-law model
Time interval is from   -9.216 sec. to  179.904 sec.
Spectral model in the cutoff power-law:
------------------------------------------------------------
Parameters  : value       lower 90%   higher 90%
Photon index: 1.15058     ( -0.0539238   0.0418699 )
Epeak [keV] : 1.00000E+04      ( -10000 -10000 )
Norm@50keV  : 5.01207E-03    ( -0.000119492   0.00011371 )
------------------------------------------------------------
#Fit statistic  : Chi-Squared                   60.05     using 59 bins.
 Reduced chi-squared = 1.07232
# Null hypothesis probability of 3.31e-01 with 56 degrees of freedom

Photon flux (15-150 keV)    in 189.1 sec: 0.581802 ( -0.015247  0.015306 ) ph/cm2/s
Energy fluence (15-150 keV)             : 2.76905e-06 ( -3.26396e-07  2.55856e-07 ) ergs/cm2
Band function

Time interval is from   -9.216 sec. to  179.904 sec.


Spectral model in the Band function:
------------------------------------------------------------
Parameters  : value       lower 90%   higher 90%
alpha       :    (     )
beta        :     (     )
Epeak [keV] :       (   )
Norm@50keV   :     (     )
------------------------------------------------------------

Photon flux (15-150 keV)    in  sec:  (    ) ph/cm2/s
Energy fluence (15-150 keV)             : 0 ( 0  0 ) ergs/cm2
Single BB
Spectral model blackbody:
------------------------------------------------------------
Parameters  : value    Lower 90%  Upper 90%
kT [keV]    : 23.2716  (  )
R^2/D10^2   : 1.58878E-02  (   )
(R is the radius in km and D10 is the distance to the source in units of 10 kpc)
------------------------------------------------------------
#Fit statistic  : Chi-Squared                  512.26     using 59 bins.
 Reduced chi-squared =
# Null hypothesis probability of 1.94e-74 with 57 degrees of freedom

Energy  Fluence     90% Error
[keV]   [erg/cm2]   [erg/cm2]
15- 25  2.932e-07   1.513e-08
25- 50  1.601e-06   6.193e-08
50-150  6.474e-06   2.137e-07
15-150  8.368e-06   2.250e-07
Thermal bremsstrahlung (OTTB)

Spectral model: thermal bremsstrahlung
------------------------------------------------------------
Parameters  : value         Lower 90%    Upper 90%
kT [keV]    : 199.363       (      )
Norm        : 2.54001       (     )
------------------------------------------------------------
#Fit statistic  : Chi-Squared                  329.46     using 59 bins.
 Reduced chi-squared =
# Null hypothesis probability of 5.50e-40 with 57 degrees of freedom

Energy  Fluence     90% Error
[keV]   [erg/cm2]   [erg/cm2]
15- 25  1.196e-06   3.082e-08
25- 50  2.301e-06   5.768e-08
50-150  5.046e-06   1.324e-07
15-150  8.543e-06   2.231e-07
Double BB
Spectral model: bbodyrad<1> + bbodyrad<2>
------------------------------------------------------------
Parameters  : value         Lower 90%    Upper 90%
kT1 [keV]   : 7.50188        (-0.651603      0.712171)
R1^2/D10^2  : 0.430780        (-0.119639      0.174849)
kT2 [keV]   : 38.1039        (-3.08633      3.91878)
R2^2/D10^2  : 3.08021E-03    (-0.000764237   0.000893978)
------------------------------------------------------------
#Fit statistic  : Chi-Squared                   51.04     using 59 bins.
 Reduced chi-squared =
# Null hypothesis probability of 6.27e-01 with 55 degrees of freedom

Energy  Fluence     90% Error
[keV]   [erg/cm2]   [erg/cm2]
15- 25  8.999e-07   8.264e-08
25- 50  1.987e-06   9.587e-08
50-150  7.085e-06   3.158e-07
15-150  9.973e-06   3.905e-07
Peak spectrum fit
Power-law model

Time interval is from    2.668 sec. to    3.668 sec.

Spectral model in power-law:
------------------------------------------------------------
Parameters  : value       lower 90%   higher 90%
Photon index: 0.801546     ( -0.0628261   0.0622467 )
Norm@50keV  : 0.111748    ( -0.00379384   0.00377676 )
------------------------------------------------------------
#Fit statistic  : Chi-Squared                   61.51     using 59 bins.
 Reduced chi-squared = 1.07912
# Null hypothesis probability of 3.18e-01 with 57 degrees of freedom

Photon flux (15-150 keV)    in 1 sec: 12.8426 ( -0.4277  0.4281 ) ph/cm2/s
Energy fluence (15-150 keV)             : 1.30518e-06 ( -4.79927e-08  4.8045e-08 ) ergs/cm2
Cutoff power-law model

Time interval is from    2.668 sec. to    3.668 sec.
Spectral model in the cutoff power-law:
------------------------------------------------------------
Parameters  : value       lower 90%   higher 90%
Photon index: 0.797627     ( -0.0665123   0.0598357 )
Epeak [keV] : 9999.34      ( -9999.36 -9999.36 )
Norm@50keV  : 0.112487    ( -0.0037949   0.0132845 )
------------------------------------------------------------
#Fit statistic  : Chi-Squared                   61.65     using 59 bins.
 Reduced chi-squared = 1.10089
# Null hypothesis probability of 2.81e-01 with 56 degrees of freedom

Photon flux (15-150 keV)    in 1 sec: 1.33454E-02 ( -0.0133454  0.142652 ) ph/cm2/s
Energy fluence (15-150 keV)             : 1.31226e-06 ( -5.55357e-08  4.04665e-08 ) ergs/cm2
Band function

Time interval is from    2.668 sec. to    3.668 sec.


Spectral model in the Band function:
------------------------------------------------------------
Parameters  : value       lower 90%   higher 90%
alpha       :    (     )
beta        :     (     )
Epeak [keV] :       (   )
Norm@50keV   :     (     )
------------------------------------------------------------

Photon flux (15-150 keV)    in  sec:  (    ) ph/cm2/s
Energy fluence (15-150 keV)             : 0 ( 0  0 ) ergs/cm2
Single BB

Spectral model blackbody:
------------------------------------------------------------
Parameters  : value    Lower 90%  Upper 90%
kT [keV]    : 25.7505  (  )
R^2/D10^2   : 0.294208  (   )
(R is the radius in km and D10 is the distance to the source in units of 10 kpc)
------------------------------------------------------------
#Fit statistic  : Chi-Squared                  228.04     using 59 bins.
 Reduced chi-squared =
# Null hypothesis probability of 2.56e-22 with 57 degrees of freedom

Energy  Fluence     90% Error
[keV]   [erg/cm2]   [erg/cm2]
15- 25  3.336e-08   2.305e-09
25- 50  1.921e-07   9.500e-09
50-150  9.398e-07   5.370e-08
15-150  1.165e-06   5.050e-08
Thermal bremsstrahlung (OTTB)
Spectral model: thermal bremsstrahlung
------------------------------------------------------------
Parameters  : value         Lower 90%    Upper 90%
kT [keV]    : 199.363       (      )
Norm        : 49.7539       (     )
------------------------------------------------------------
#Fit statistic  : Chi-Squared                  442.53     using 59 bins.
 Reduced chi-squared =
# Null hypothesis probability of 4.89e-61 with 57 degrees of freedom

Energy  Fluence     90% Error
[keV]   [erg/cm2]   [erg/cm2]
15- 25  1.239e-07   4.250e-09
25- 50  2.383e-07   8.750e-09
50-150  5.227e-07   2.135e-08
15-150  8.849e-07   3.145e-08
Double BB
Spectral model: bbodyrad<1> + bbodyrad<2>
------------------------------------------------------------
Parameters  : value         Lower 90%    Upper 90%
kT1 [keV]   : 10.0869        (-1.50431      1.65067)
R1^2/D10^2  : 2.78171        (-0.927376      1.63255)
kT2 [keV]   : 52.6128        (-9.65037      18.495)
R2^2/D10^2  : 3.54602E-02    (-0.018068   0.0253012)
------------------------------------------------------------
#Fit statistic  : Chi-Squared                   62.18     using 59 bins.
 Reduced chi-squared =
# Null hypothesis probability of 2.36e-01 with 55 degrees of freedom

Energy  Fluence     90% Error
[keV]   [erg/cm2]   [erg/cm2]
15- 25  6.810e-08   7.815e-09
25- 50  2.207e-07   2.315e-08
50-150  1.043e-06   1.824e-07
15-150  1.332e-06   1.873e-07
Pre-slew spectrum (Pre-slew PHA with pre-slew DRM)
Power-law model

Spectral model in power-law:
------------------------------------------------------------
Parameters  : value       lower 90%   higher 90%
Photon index: 0.949668     ( -0.0358984   0.0357049 )
Norm@50keV  : 3.56118E-02    ( -0.000687463   0.000683472 )
------------------------------------------------------------
#Fit statistic  : Chi-Squared                   57.39     using 59 bins.
 Reduced chi-squared =
# Null hypothesis probability of 4.61e-01 with 57 degrees of freedom

Photon flux (15-150 keV)    in 19.76 sec: 4.09141 ( -0.0804136  0.0807093 ) ph/cm2/s
Energy fluence (15-150 keV)             : 7.74965e-06 ( -1.44719e-07  1.44844e-07 ) ergs/cm2
Cutoff power-law model
Spectral model in the cutoff power-law:
------------------------------------------------------------
Parameters  : value       lower 90%   higher 90%
Photon index: 0.943069     ( -0.0397746   0.0339531 )
Epeak [keV] : 1.00000E+04      ( -10000 -10000 )
Norm@50keV  : 3.58306E-02    ( -0.000687795   0.000635773 )
------------------------------------------------------------
#Fit statistic  : Chi-Squared                   57.88     using 59 bins.
 Reduced chi-squared =
# Null hypothesis probability of 4.06e-01 with 56 degrees of freedom

Photon flux (15-150 keV)    in 19.76 sec: 4.09048 ( -0.07929  0.07928 ) ph/cm2/s
Energy fluence (15-150 keV)             : 7.74685e-06 ( -1.40711e-07  1.51026e-07 ) ergs/cm2
Band function

Spectral model in the Band function:
------------------------------------------------------------
Parameters  : value       lower 90%   higher 90%
alpha       :    (     )
beta        :     (     )
Epeak [keV] :       (   )
Norm@50keV   :     (     )
------------------------------------------------------------

Photon flux (15-150 keV)    in  sec:  (    ) ph/cm2/s
Energy fluence (15-150 keV)             : 0 ( 0  0 ) ergs/cm2
S(25-50 keV) vs. S(50-100 keV) plot
S(25-50 keV)  = 1.99e-06
S(50-100 keV) = 3.56e-06
T90 vs. Hardness ratio plot
T90                                   = 69.4399999380112 sec.
Hardness ratio (energy fluence ratio) = 1.78894
Color vs. Color plot
Count Ratio  (25-50 keV) / (15-25 keV) = 1.39027
Count Ratio (50-100 keV) / (15-25 keV) = 1.34706
Mask shadow pattern

IMX = -5.135257878257191E-01, IMY = -1.651475167264640E-01
TIME vs. PHA plot around the trigger time

Blue+Cyan dotted lines: Time interval of the scaled map
From 0.000000 to 0.512000
TIME vs. DetID plot around the trigger time

Blue+Cyan dotted lines: Time interval of the scaled map
From 0.000000 to 0.512000
100 us light curve (15-350 keV)
Blue+Cyan dotted lines: Time interval of the scaled map
From 0.000000 to 0.512000
Spacecraft aspect plot
Bright source in the pre-burst/pre-slew/post-slew images
Pre-burst image of 15-350 keV band
Time interval of the image:
-239.552000 -9.216000

# RAcent  DECcent POSerr Theta    Phi  PeakCts   SNR AngSep     Name
#  [deg]    [deg]    ['] [deg]  [deg]                   [']
244.9932 -15.6420    1.3  41.9  149.9   7.7117   8.8    0.8	Sco X-1
254.4102  35.3508    1.6  15.6   26.8   2.2159   7.2    2.4	Her X-1
268.1666  -1.4935    0.0  38.7  108.0   1.6449   1.4   12.3	SW J1753.5-0127
280.4376  13.0112    3.2  40.2   78.1   5.8967   3.7 ------	UNKNOWN
203.3100   3.7671    3.3  41.4 -138.8   1.9012   3.5 ------	UNKNOWN
192.6121  53.5399    3.3  44.4  -61.3   5.0678   3.5 ------	UNKNOWN
191.9810  56.2036    2.7  45.7  -57.9   6.0936   4.3 ------	UNKNOWN
Pre-slew background subtracted image of 15-350 keV band
Time interval of the image:
-9.216000 10.548600

# RAcent  DECcent POSerr Theta    Phi  PeakCts   SNR AngSep     Name
#  [deg]    [deg]    ['] [deg]  [deg]                   [']
244.9793 -15.5977    6.4  41.8  149.9  -0.5333  -1.8    2.6	Sco X-1
254.4494  35.3432  182.0  15.7   26.9  -0.0088  -0.1    0.4	Her X-1
268.2129  -1.4764  137.3  38.7  108.0  -0.0370  -0.1    9.4	SW J1753.5-0127
237.5449  -2.3304    0.2  28.3  162.2  10.7600  76.3 ------	UNKNOWN
238.3135  10.7050    2.7  15.3  163.1   0.5348   4.2 ------	UNKNOWN
209.3943 -11.6910    2.7  47.9 -160.7   1.1290   4.4 ------	UNKNOWN
223.8353  69.6039    2.5  44.7  -30.6   1.0439   4.5 ------	UNKNOWN
192.9298  51.5720    3.4  43.6  -63.9   2.2216   3.4 ------	UNKNOWN
191.8908  60.1911    2.1  47.3  -52.9   2.8995   5.4 ------	UNKNOWN
Post-slew image of 15-350 keV band
Time interval of the image:
76.348600 962.502800

# RAcent  DECcent POSerr Theta    Phi  PeakCts   SNR AngSep     Name
#  [deg]    [deg]    ['] [deg]  [deg]                   [']
245.0007 -15.6329    0.5  15.2  136.3  32.3403  25.3    1.3	Sco X-1
254.4868  35.3484    3.5  40.9    6.0   7.0272   3.2    1.5	Her X-1
256.0260 -37.8530    2.8  39.4  141.5  15.7629   4.1    1.9	4U 1700-377
256.2680 -36.4868    6.2  38.3  140.1   6.6634   1.9    8.9	GX 349+2
262.9889 -24.8689   18.6  33.3  119.5   1.7027   0.6    7.5	GX 1+4
264.7630 -44.3182    4.7  48.4  138.8 -14.1514  -2.4    8.0	4U 1735-44
268.5244  -1.4309   10.8  31.0   73.6   2.8372   1.1    9.5	SW J1753.5-0127
270.0925 -25.1974    0.0  38.8  113.8   9.5927   2.1   12.6	GX 5-1
270.2461 -25.7213    5.0  39.2  114.3  10.8085   2.3    3.3	GRS 1758-258
274.1603 -14.0501    5.3  38.0   94.8   8.6229   2.2    9.0	GX 17+2
262.8757 -33.9669    6.0  39.5  130.8   7.7474   1.9    9.7	GX 354-0
269.7160  -3.3753    2.9  32.1   77.4  10.9729   4.0 ------	UNKNOWN
Plot creation:
Sat Oct 19 18:19:39 EDT 2024