Estimated redshift from machine learning (Ukwatta et al. 2016) - may take a few minute to calcaulte
Image
Pre-slew 15.0-350.0 keV image (Event data)
#   RAcent    DECcent   POSerr    Theta     Phi              Peak Cts       SNR   Name
  226.3394    28.9013   0.0086    33.0107   -23.3286         3.0169641     22.221 TRIG_01248132

Foreground time interval of the image:
-34.864  11.333 (delta_t =  46.197 [sec])
Background time interval of the image:
-128.667 -34.864 (delta_t =  93.803 [sec])
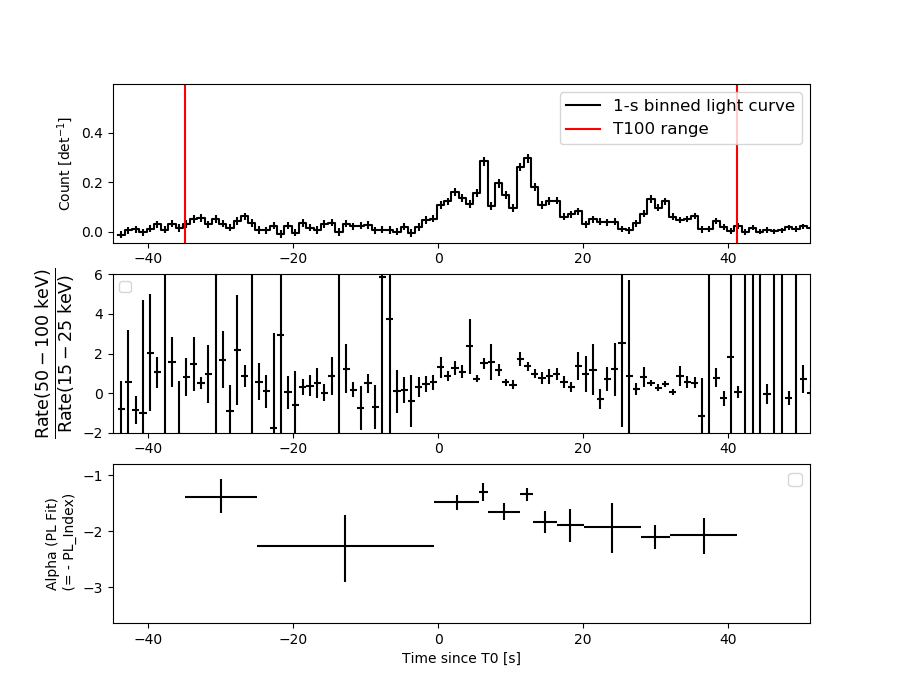
Lightcurves
Notes:
- 1) The mask-weighted light curves are using the flight position.
- 2) Multiple plots of different time binning/intervals are shown to cover all scenarios of short/long GRBs, rate/image triggers, and real/false positives.
- 3) For all the mask-weighted lightcurves, the y-axis units are counts/sec/det where a det is 0.4 x 0.4 = 0.16 sq cm.
- 4) The verticle lines correspond to following: green dotted lines are T50 interval, black dotted lines are T90 interval, blue solid line(s) is a spacecraft slew start time, and orange solid line(s) is a spacecraft slew end time.
- 5) Time of each bin is in the middle of the bin.
1 s binning
From T0-310 s to T0+310 s
From T100_start - 20 s to T100_end + 30 s
Full time interval
64 ms binning
Full time interval
From T100_start to T100_end
From T0-5 sec to T0+5 sec
16 ms binning
From T100_start-5 s to T100_start+5 s
Blue+Cyan dotted lines: Time interval of the scaled map
From 0.000000 to 1.024000
8 ms binning
From T100_start-3 s to T100_start+3 s
Blue+Cyan dotted lines: Time interval of the scaled map
From 0.000000 to 1.024000
2 ms binning
From T100_start-1 s to T100_start+1 s
Blue+Cyan dotted lines: Time interval of the scaled map
From 0.000000 to 1.024000
SN=5 or 10 sec. binning (whichever binning is satisfied first)

SN=5 or 10 sec. binning (T < 200 sec)
Quad-rate summed light curves (from T0-300s to T0+1000s)

Spectral Evolution
Spectra
Notes:
- 1) The fitting includes the systematic errors.
- 2) When the burst includes telescope slew time periods, the fitting uses an average response file made from multiple 5-s response files through out the slew time plus single time preiod for the non-slew times, and weighted by the total counts in the corresponding time period using addrmf. An average response file is needed becuase a spectral fit using the pre-slew DRM will introduce some errors in both a spectral shape and a normalization if the PHA file contains a lot of the slew/post-slew time interval.
- 3) For fits to more complicated models (e.g. a power-law over a cutoff power-law), the BAT team has decided to require a chi-square improvement of more than 6 for each extra dof.
Time averaged spectrum fit using the average DRM
Power-law model
Time interval is from  -34.864 sec. to   41.244 sec.

Spectral model in power-law:
------------------------------------------------------------
Parameters  : value       lower 90%   higher 90%
Photon index: 1.71347     ( -0.0816449   0.0820577 )
Norm@50keV  : 4.18383E-03    ( -0.000191589   0.000191086 )
------------------------------------------------------------
#Fit statistic  : Chi-Squared                   54.32     using 59 bins.
 Reduced chi-squared = 0.952982
# Null hypothesis probability of 5.76e-01 with 57 degrees of freedom

Photon flux (15-150 keV)    in 76.11 sec: 0.558325 ( -0.02654  0.026618 ) ph/cm2/s
Energy fluence (15-150 keV)             : 2.94572e-06 ( -1.39891e-07  1.40318e-07 ) ergs/cm2
Cutoff power-law model

Time interval is from  -34.864 sec. to   41.244 sec.
Spectral model in the cutoff power-law:
------------------------------------------------------------
Parameters  : value       lower 90%   higher 90%
Photon index: 1.39092     ( -0.332006   0.307563 )
Epeak [keV] : 93.5152      ( -25.2087 494.998 )
Norm@50keV  : 6.08426E-03    ( -0.0017816   0.00278104 )
------------------------------------------------------------
#Fit statistic  : Chi-Squared                   51.08     using 59 bins.
 Reduced chi-squared = 0.912143
# Null hypothesis probability of 6.61e-01 with 56 degrees of freedom

Photon flux (15-150 keV)    in 76.11 sec: 0.547264 ( -0.028443  0.028498 ) ph/cm2/s
Energy fluence (15-150 keV)             : 2.86894e-06 ( -1.57992e-07  1.57703e-07 ) ergs/cm2
Band function

Time interval is from  -34.864 sec. to   41.244 sec.


Spectral model in the Band function:
------------------------------------------------------------
Parameters  : value       lower 90%   higher 90%
alpha       :    (     )
beta        :     (     )
Epeak [keV] :       (   )
Norm@50keV   :     (     )
------------------------------------------------------------

Photon flux (15-150 keV)    in  sec:  (    ) ph/cm2/s
Energy fluence (15-150 keV)             : 0 ( 0  0 ) ergs/cm2
Single BB
Spectral model blackbody:
------------------------------------------------------------
Parameters  : value    Lower 90%  Upper 90%
kT [keV]    : 13.5817  (  )
R^2/D10^2   : 8.30546E-02  (   )
(R is the radius in km and D10 is the distance to the source in units of 10 kpc)
------------------------------------------------------------
#Fit statistic  : Chi-Squared                  165.96     using 59 bins.
 Reduced chi-squared =
# Null hypothesis probability of 1.40e-12 with 57 degrees of freedom

Energy  Fluence     90% Error
[keV]   [erg/cm2]   [erg/cm2]
15- 25  2.469e-07   2.173e-08
25- 50  8.905e-07   5.404e-08
50-150  1.064e-06   1.008e-07
15-150  2.202e-06   1.081e-07
Thermal bremsstrahlung (OTTB)
Spectral model: thermal bremsstrahlung
------------------------------------------------------------
Parameters  : value         Lower 90%    Upper 90%
kT [keV]    : 137.028       (-26.8949      31.7545)
Norm        : 2.29268       (-0.128463     0.16273)
------------------------------------------------------------
#Fit statistic  : Chi-Squared                   51.34     using 59 bins.
 Reduced chi-squared =
# Null hypothesis probability of 6.86e-01 with 57 degrees of freedom

Energy  Fluence     90% Error
[keV]   [erg/cm2]   [erg/cm2]
15- 25  4.513e-07   3.478e-08
25- 50  8.251e-07   5.754e-08
50-150  1.567e-06   4.262e-07
15-150  2.843e-06   4.669e-07
Double BB

Spectral model: bbodyrad<1> + bbodyrad<2>
------------------------------------------------------------
Parameters  : value         Lower 90%    Upper 90%
kT1 [keV]   : 7.04201        (-0.890417      0.964855)
R1^2/D10^2  : 0.639516        (-0.228329      0.397279)
kT2 [keV]   : 25.6816        (-3.62863      5.30905)
R2^2/D10^2  : 6.20041E-03    (-0.00306539   0.00488503)
------------------------------------------------------------
#Fit statistic  : Chi-Squared                   46.83     using 59 bins.
 Reduced chi-squared =
# Null hypothesis probability of 7.75e-01 with 55 degrees of freedom

Energy  Fluence     90% Error
[keV]   [erg/cm2]   [erg/cm2]
15- 25  4.435e-07   6.663e-08
25- 50  8.470e-07   9.982e-08
50-150  1.584e-06   3.090e-07
15-150  2.874e-06   4.338e-07
Peak spectrum fit
Power-law model

Time interval is from   11.304 sec. to   12.304 sec.

Spectral model in power-law:
------------------------------------------------------------
Parameters  : value       lower 90%   higher 90%
Photon index: 1.53134     ( -0.145253   0.147308 )
Norm@50keV  : 2.33665E-02    ( -0.0020535   0.00204693 )
------------------------------------------------------------
#Fit statistic  : Chi-Squared                   71.95     using 59 bins.
 Reduced chi-squared = 1.26228
# Null hypothesis probability of 8.77e-02 with 57 degrees of freedom

Photon flux (15-150 keV)    in 1 sec: 2.94242 ( -0.26183  0.26239 ) ph/cm2/s
Energy fluence (15-150 keV)             : 2.20607e-07 ( -2.07681e-08  2.09168e-08 ) ergs/cm2
Cutoff power-law model

Time interval is from   11.304 sec. to   12.304 sec.
Spectral model in the cutoff power-law:
------------------------------------------------------------
Parameters  : value       lower 90%   higher 90%
Photon index: 0.906438     ( -0.672243   0.579934 )
Epeak [keV] : 91.2121      ( -24.4971 350.708 )
Norm@50keV  : 4.72094E-02    ( -0.0222241   0.0514989 )
------------------------------------------------------------
#Fit statistic  : Chi-Squared                   68.53     using 59 bins.
 Reduced chi-squared = 1.22375
# Null hypothesis probability of 1.21e-01 with 56 degrees of freedom

Photon flux (15-150 keV)    in 1 sec: 2.86327 ( -0.2721  0.27229 ) ph/cm2/s
Energy fluence (15-150 keV)             : 2.13359e-07 ( -2.23077e-08  2.22164e-08 ) ergs/cm2
Band function

Time interval is from   11.304 sec. to   12.304 sec.


Spectral model in the Band function:
------------------------------------------------------------
Parameters  : value       lower 90%   higher 90%
alpha       :    (     )
beta        :     (     )
Epeak [keV] :       (   )
Norm@50keV   :     (     )
------------------------------------------------------------

Photon flux (15-150 keV)    in  sec:  (    ) ph/cm2/s
Energy fluence (15-150 keV)             : 0 ( 0  0 ) ergs/cm2
Single BB

Spectral model blackbody:
------------------------------------------------------------
Parameters  : value    Lower 90%  Upper 90%
kT [keV]    : 15.4489  (-1.5891  1.78217)
R^2/D10^2   : 0.303669  (-0.097325   0.141757)
(R is the radius in km and D10 is the distance to the source in units of 10 kpc)
------------------------------------------------------------
#Fit statistic  : Chi-Squared                   91.75     using 59 bins.
 Reduced chi-squared =
# Null hypothesis probability of 2.40e-03 with 57 degrees of freedom

Energy  Fluence     90% Error
[keV]   [erg/cm2]   [erg/cm2]
15- 25  1.510e-08   2.355e-09
25- 50  6.160e-08   7.115e-09
50-150  1.013e-07   1.690e-08
15-150  1.780e-07   1.910e-08
Thermal bremsstrahlung (OTTB)
Spectral model: thermal bremsstrahlung
------------------------------------------------------------
Parameters  : value         Lower 90%    Upper 90%
kT [keV]    : 199.344       (-61.4119      -199.359)
Norm        : 12.0704       (-1.03349     1.03505)
------------------------------------------------------------
#Fit statistic  : Chi-Squared                   69.57     using 59 bins.
 Reduced chi-squared =
# Null hypothesis probability of 1.23e-01 with 57 degrees of freedom

Energy  Fluence     90% Error
[keV]   [erg/cm2]   [erg/cm2]
15- 25  3.006e-08   4.290e-09
25- 50  5.782e-08   1.192e-08
50-150  1.268e-07   5.370e-08
15-150  2.147e-07   5.625e-08
Double BB

Spectral model: bbodyrad<1> + bbodyrad<2>
------------------------------------------------------------
Parameters  : value         Lower 90%    Upper 90%
kT1 [keV]   : 7.01944        (-2.27803      2.70578)
R1^2/D10^2  : 2.67672        (-1.6905      8.20029)
kT2 [keV]   : 23.6662        (-4.8883      10.0688)
R2^2/D10^2  : 5.32352E-02    (-0.0396333   0.0532447)
------------------------------------------------------------
#Fit statistic  : Chi-Squared                   68.73     using 59 bins.
 Reduced chi-squared =
# Null hypothesis probability of 1.01e-01 with 55 degrees of freedom

Energy  Fluence     90% Error
[keV]   [erg/cm2]   [erg/cm2]
15- 25  2.658e-08   1.284e-08
25- 50  5.862e-08   2.109e-08
50-150  1.276e-07   6.391e-08
15-150  2.128e-07   8.235e-08
Pre-slew spectrum (Pre-slew PHA with pre-slew DRM)
Power-law model

Spectral model in power-law:
------------------------------------------------------------
Parameters  : value       lower 90%   higher 90%
Photon index: 1.59111     ( -0.114981   0.11533 )
Norm@50keV  : 3.75682E-03    ( -0.000242222   0.000241321 )
------------------------------------------------------------
#Fit statistic  : Chi-Squared                   51.88     using 59 bins.
 Reduced chi-squared =
# Null hypothesis probability of 6.67e-01 with 57 degrees of freedom

Photon flux (15-150 keV)    in 46.2 sec: 0.481449 ( -0.0323783  0.0324839 ) ph/cm2/s
Energy fluence (15-150 keV)             : 1.62498e-06 ( -1.10941e-07  1.11439e-07 ) ergs/cm2
Cutoff power-law model

Spectral model in the cutoff power-law:
------------------------------------------------------------
Parameters  : value       lower 90%   higher 90%
Photon index: 1.37086     ( -0.455235   0.280488 )
Epeak [keV] : 145.802      ( -67.033 -145.802 )
Norm@50keV  : 4.82785E-03    ( -0.00126199   0.0031563 )
------------------------------------------------------------
#Fit statistic  : Chi-Squared                   51.07     using 59 bins.
 Reduced chi-squared =
# Null hypothesis probability of 6.61e-01 with 56 degrees of freedom

Photon flux (15-150 keV)    in 46.2 sec: 0.475367 ( -0.034258  0.034307 ) ph/cm2/s
Energy fluence (15-150 keV)             : 1.59943e-06 ( -1.22333e-07  1.21682e-07 ) ergs/cm2
Band function

Spectral model in the Band function:
------------------------------------------------------------
Parameters  : value       lower 90%   higher 90%
alpha       :    (     )
beta        :     (     )
Epeak [keV] :       (   )
Norm@50keV   :     (     )
------------------------------------------------------------

Photon flux (15-150 keV)    in  sec:  (    ) ph/cm2/s
Energy fluence (15-150 keV)             : 0 ( 0  0 ) ergs/cm2
S(25-50 keV) vs. S(50-100 keV) plot

S(25-50 keV)  = 7.99e-07
S(50-100 keV) = 9.82e-07
T90 vs. Hardness ratio plot
T90                                   = 62.9119999408722 sec.
Hardness ratio (energy fluence ratio) = 1.22904
Color vs. Color plot
Count Ratio  (25-50 keV) / (15-25 keV) = 1.29008
Count Ratio (50-100 keV) / (15-25 keV) = 0.845859
Mask shadow pattern

IMX = 5.965619257236635E-01, IMY = 2.572726785250722E-01
TIME vs. PHA plot around the trigger time

Blue+Cyan dotted lines: Time interval of the scaled map
From 0.000000 to 1.024000
TIME vs. DetID plot around the trigger time
Blue+Cyan dotted lines: Time interval of the scaled map
From 0.000000 to 1.024000
100 us light curve (15-350 keV)
Blue+Cyan dotted lines: Time interval of the scaled map
From 0.000000 to 1.024000
Spacecraft aspect plot

Bright source in the pre-burst/pre-slew/post-slew images
Pre-burst image of 15-350 keV band
Time interval of the image:
-128.667400 -34.864000

# RAcent  DECcent POSerr Theta    Phi  PeakCts   SNR AngSep     Name
#  [deg]    [deg]    ['] [deg]  [deg]                   [']
244.9883 -15.6333    0.3  15.2  146.4   7.0406  38.4    0.7	Sco X-1
254.4575  35.3422   82.0  40.9   16.1  -0.0448  -0.1    0.0	Her X-1
255.9685 -37.7091   12.3  39.2  151.6   0.3697   0.9    8.1	4U 1700-377
256.6103 -36.2617    0.0  38.2  149.7   1.0016   2.6   12.9	GX 349+2
262.9234 -24.6171    7.2  33.1  129.4   0.5572   1.6    9.0	GX 1+4
264.9245 -44.2705    4.4  48.4  148.7   1.9345   2.6   13.3	4U 1735-44
268.5101  -1.5946    0.0  31.0   84.1   0.1772   0.5   12.1	SW J1753.5-0127
270.2558 -24.9803  193.6  38.8  123.5  -0.0389  -0.1    6.1	GX 5-1
270.2312 -25.8695    7.0  39.3  124.7   1.0814   1.7    8.5	GRS 1758-258
274.1566 -14.0313    7.5  38.0  104.9   0.9327   1.5    8.8	GX 17+2
263.0079 -33.8593   48.7  39.5  140.7   0.1275   0.2    1.7	GX 354-0
249.0192 -51.0199    2.6  49.7  165.4   2.7815   4.5 ------	UNKNOWN
232.0822 -11.7983    3.9  10.9 -155.7   0.5285   2.9 ------	UNKNOWN
193.8183 -28.8491    2.0  49.3 -132.2   5.5533   5.7 ------	UNKNOWN
Pre-slew background subtracted image of 15-350 keV band
Time interval of the image:
-34.864000 11.332600

# RAcent  DECcent POSerr Theta    Phi  PeakCts   SNR AngSep     Name
#  [deg]    [deg]    ['] [deg]  [deg]                   [']
244.9788 -15.6311    5.9  15.2  146.5  -0.2036  -2.0    0.5	Sco X-1
254.6152  35.4610   10.5  41.0   16.2   0.2116   1.1   10.5	Her X-1
256.1305 -37.9737    0.0  39.5  151.6   0.5491   2.6   10.3	4U 1700-377
256.3073 -36.5797    7.4  38.4  150.3  -0.3140  -1.6   11.2	GX 349+2
263.0807 -24.6019    4.4  33.2  129.2  -0.4654  -2.6    9.5	GX 1+4
264.8614 -44.5697   12.3  48.6  149.0  -0.3886  -0.9    8.8	4U 1735-44
268.5215  -1.3921    6.0  31.0   83.7  -0.3883  -1.9    9.9	SW J1753.5-0127
270.3008 -25.0302    5.1  38.9  123.5   0.6760   2.3    3.1	GX 5-1
270.2468 -25.7317    5.5  39.2  124.5  -0.6463  -2.1    3.1	GRS 1758-258
273.9764 -14.0642    5.9  37.9  105.0  -0.6506  -2.0    2.4	GX 17+2
263.1525 -33.7692    5.3  39.5  140.5   0.5224   2.2    9.0	GX 354-0
249.5711  10.3686    2.6  17.4   38.0   0.4526   4.4 ------	UNKNOWN
237.5459  29.1022    2.7  31.4   -5.1   0.5080   4.2 ------	UNKNOWN
226.3394  28.9013    0.5  33.0  -23.3   3.0175  22.2 ------	UNKNOWN
216.5288 -42.2369    2.5  44.1 -162.7   0.8330   4.5 ------	UNKNOWN
216.3657  23.8596    2.3  33.3  -42.1   0.6668   5.0 ------	UNKNOWN
Post-slew image of 15-350 keV band
Time interval of the image:
83.132590 962.963700

# RAcent  DECcent POSerr Theta    Phi  PeakCts   SNR AngSep     Name
#  [deg]    [deg]    ['] [deg]  [deg]                   [']
244.9833 -15.6434    1.1  48.0  145.0  47.7400  10.7    0.3	Sco X-1
254.4042  35.3603    3.6  24.5   56.9   4.4982   3.2    2.8	Her X-1
280.4144  45.1015    2.2  45.2   43.1  11.9190   5.3 ------	UNKNOWN
281.5037  63.8542    2.3  49.2   18.0   7.8630   5.1 ------	UNKNOWN
233.5351  25.8989    2.6   7.0  102.8   4.2097   4.4 ------	UNKNOWN
195.5827  -4.7946    2.6  44.8 -144.2   9.7945   4.5 ------	UNKNOWN
184.5626   5.6531    2.7  45.8 -122.8  21.3498   4.2 ------	UNKNOWN
181.6374  19.1830    3.1  41.8 -103.7  18.1636   3.7 ------	UNKNOWN
Plot creation:
Sat Oct 19 18:18:58 EDT 2024