Estimated redshift from machine learning (Ukwatta et al. 2016) - may take a few minute to calcaulte
Image
Pre-slew 15.0-350.0 keV image (Event data)

#   RAcent    DECcent   POSerr    Theta     Phi              Peak Cts       SNR   Name
  344.5701     1.0189   0.0027    24.7406   101.9320        31.9669591     71.707 TRIG_01250617

Foreground time interval of the image:
  0.112  10.413 (delta_t =  10.301 [sec])
Background time interval of the image:
-50.987   0.112 (delta_t =  51.099 [sec])
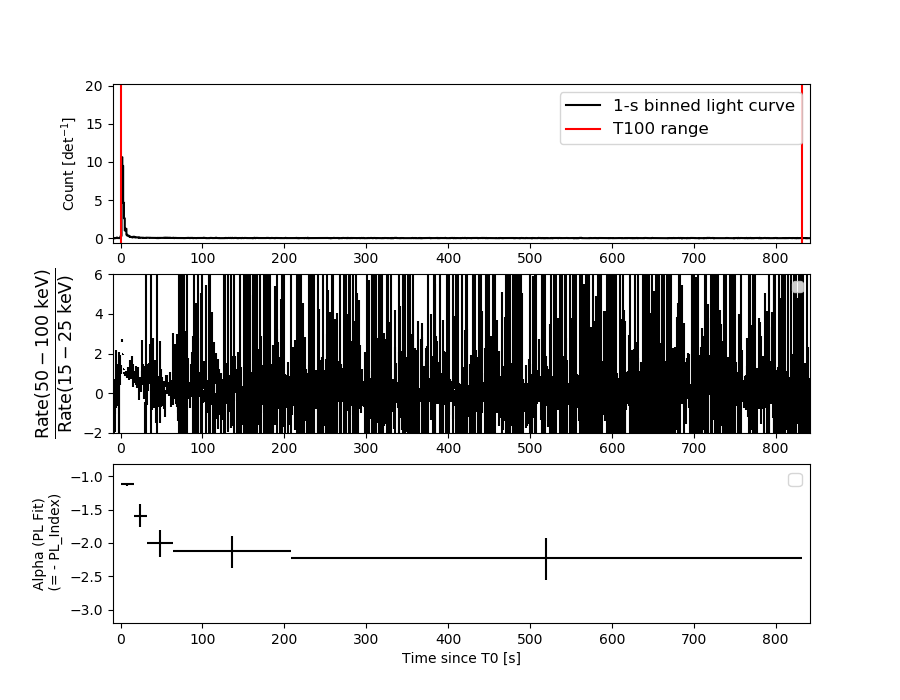
Lightcurves
Notes:
- 1) The mask-weighted light curves are using the flight position.
- 2) Multiple plots of different time binning/intervals are shown to cover all scenarios of short/long GRBs, rate/image triggers, and real/false positives.
- 3) For all the mask-weighted lightcurves, the y-axis units are counts/sec/det where a det is 0.4 x 0.4 = 0.16 sq cm.
- 4) The verticle lines correspond to following: green dotted lines are T50 interval, black dotted lines are T90 interval, blue solid line(s) is a spacecraft slew start time, and orange solid line(s) is a spacecraft slew end time.
- 5) Time of each bin is in the middle of the bin.
1 s binning
From T0-310 s to T0+310 s
From T100_start - 20 s to T100_end + 30 s

Full time interval
64 ms binning
Full time interval
From T100_start to T100_end

From T0-5 sec to T0+5 sec

16 ms binning
From T100_start-5 s to T100_start+5 s

Blue+Cyan dotted lines: Time interval of the scaled map
From 0.000000 to 0.512000
8 ms binning
From T100_start-3 s to T100_start+3 s

Blue+Cyan dotted lines: Time interval of the scaled map
From 0.000000 to 0.512000
2 ms binning
From T100_start-1 s to T100_start+1 s
Blue+Cyan dotted lines: Time interval of the scaled map
From 0.000000 to 0.512000
SN=5 or 10 sec. binning (whichever binning is satisfied first)
SN=5 or 10 sec. binning (T < 200 sec)

Quad-rate summed light curves (from T0-300s to T0+1000s)

Spectral Evolution
Spectra
Notes:
- 1) The fitting includes the systematic errors.
- 2) When the burst includes telescope slew time periods, the fitting uses an average response file made from multiple 5-s response files through out the slew time plus single time preiod for the non-slew times, and weighted by the total counts in the corresponding time period using addrmf. An average response file is needed becuase a spectral fit using the pre-slew DRM will introduce some errors in both a spectral shape and a normalization if the PHA file contains a lot of the slew/post-slew time interval.
- 3) For fits to more complicated models (e.g. a power-law over a cutoff power-law), the BAT team has decided to require a chi-square improvement of more than 6 for each extra dof.
Time averaged spectrum fit using the average DRM
Power-law model
Time interval is from    0.112 sec. to  832.112 sec.

Spectral model in power-law:
------------------------------------------------------------
Parameters  : value       lower 90%   higher 90%
Photon index: 1.26106     ( -0.0362383   0.0360976 )
Norm@50keV  : 3.07059E-03    ( -5.82766e-05   5.81383e-05 )
------------------------------------------------------------
#Fit statistic  : Chi-Squared                   42.51     using 59 bins.
 Reduced chi-squared = 0.745789
# Null hypothesis probability of 9.24e-01 with 57 degrees of freedom

Photon flux (15-150 keV)    in 832 sec: 0.363834 ( -0.007782  0.007821 ) ph/cm2/s
Energy fluence (15-150 keV)             : 2.54966e-05 ( -4.75717e-07  4.76432e-07 ) ergs/cm2
Cutoff power-law model

Time interval is from    0.112 sec. to  832.112 sec.
Spectral model in the cutoff power-law:
------------------------------------------------------------
Parameters  : value       lower 90%   higher 90%
Photon index: 1.25740     ( -0.0372815   0.0356016 )
Epeak [keV] : 9999.36      ( -9999.36 -9999.36 )
Norm@50keV  : 3.08427E-03    ( -5.78037e-05   0.000205532 )
------------------------------------------------------------
#Fit statistic  : Chi-Squared                   42.65     using 59 bins.
 Reduced chi-squared = 0.761607
# Null hypothesis probability of 9.06e-01 with 56 degrees of freedom

Photon flux (15-150 keV)    in 832 sec: 0.366778 ( -0.010857  0.004733 ) ph/cm2/s
Energy fluence (15-150 keV)             : 2.5602e-05 ( -5.77591e-07  3.64523e-07 ) ergs/cm2
Band function

Time interval is from    0.112 sec. to  832.112 sec.


Spectral model in the Band function:
------------------------------------------------------------
Parameters  : value       lower 90%   higher 90%
alpha       :    (     )
beta        :     (     )
Epeak [keV] :       (   )
Norm@50keV   :     (     )
------------------------------------------------------------

Photon flux (15-150 keV)    in  sec:  (    ) ph/cm2/s
Energy fluence (15-150 keV)             : 0 ( 0  0 ) ergs/cm2
Single BB
Spectral model blackbody:
------------------------------------------------------------
Parameters  : value    Lower 90%  Upper 90%
kT [keV]    : 21.1851  (  )
R^2/D10^2   : 1.30651E-02  (   )
(R is the radius in km and D10 is the distance to the source in units of 10 kpc)
------------------------------------------------------------
#Fit statistic  : Chi-Squared                  667.20     using 59 bins.
 Reduced chi-squared =
# Null hypothesis probability of 6.11e-105 with 57 degrees of freedom

Energy  Fluence     90% Error
[keV]   [erg/cm2]   [erg/cm2]
15- 25  9.182e-07   3.536e-08
25- 50  4.746e-06   1.414e-07
50-150  1.589e-05   4.368e-07
15-150  2.155e-05   4.368e-07
Thermal bremsstrahlung (OTTB)
Spectral model: thermal bremsstrahlung
------------------------------------------------------------
Parameters  : value         Lower 90%    Upper 90%
kT [keV]    : 199.363       (      )
Norm        : 1.58039       (     )
------------------------------------------------------------
#Fit statistic  : Chi-Squared                  303.43     using 59 bins.
 Reduced chi-squared =
# Null hypothesis probability of 2.61e-35 with 57 degrees of freedom

Energy  Fluence     90% Error
[keV]   [erg/cm2]   [erg/cm2]
15- 25  3.274e-06   7.072e-08
25- 50  6.298e-06   1.394e-07
50-150  1.381e-05   2.829e-07
15-150  2.339e-05   4.950e-07
Double BB
Spectral model: bbodyrad<1> + bbodyrad<2>
------------------------------------------------------------
Parameters  : value         Lower 90%    Upper 90%
kT1 [keV]   : 8.60233        (-0.618289      0.65515)
R1^2/D10^2  : 0.168334        (-0.0359307      0.0482459)
kT2 [keV]   : 37.1005        (-2.88685      3.67227)
R2^2/D10^2  : 1.80544E-03    (-0.000456872   0.000534875)
------------------------------------------------------------
#Fit statistic  : Chi-Squared                   50.04     using 59 bins.
 Reduced chi-squared =
# Null hypothesis probability of 6.64e-01 with 55 degrees of freedom

Energy  Fluence     90% Error
[keV]   [erg/cm2]   [erg/cm2]
15- 25  2.249e-06   1.652e-07
25- 50  5.766e-06   1.876e-07
50-150  1.757e-05   7.446e-07
15-150  2.559e-05   9.818e-07
Peak spectrum fit
Power-law model
Time interval is from    7.612 sec. to    8.612 sec.

Spectral model in power-law:
------------------------------------------------------------
Parameters  : value       lower 90%   higher 90%
Photon index: 1.61789     ( -0.157303   0.162092 )
Norm@50keV  : 2.27496E-02    ( -0.00232276   0.00229471 )
------------------------------------------------------------
#Fit statistic  : Chi-Squared                   50.58     using 59 bins.
 Reduced chi-squared = 0.887368
# Null hypothesis probability of 7.13e-01 with 57 degrees of freedom

Photon flux (15-150 keV)    in 1 sec: 2.93997 ( -0.27555  0.27563 ) ph/cm2/s
Energy fluence (15-150 keV)             : 2.12339e-07 ( -2.31831e-08  2.34318e-08 ) ergs/cm2
Cutoff power-law model
Time interval is from    7.612 sec. to    8.612 sec.
Spectral model in the cutoff power-law:
------------------------------------------------------------
Parameters  : value       lower 90%   higher 90%
Photon index: 1.01543     ( -0.729881   0.6296 )
Epeak [keV] : 78.0515      ( -21.5705 -78.0515 )
Norm@50keV  : 4.73711E-02    ( -0.0249297   0.0656865 )
------------------------------------------------------------
#Fit statistic  : Chi-Squared                   47.92     using 59 bins.
 Reduced chi-squared = 0.855714
# Null hypothesis probability of 7.70e-01 with 56 degrees of freedom

Photon flux (15-150 keV)    in 1 sec: 2.88324 ( -0.2828  0.28227 ) ph/cm2/s
Energy fluence (15-150 keV)             : 2.03395e-07 ( -2.50463e-08  2.5307e-08 ) ergs/cm2
Band function

Time interval is from    7.612 sec. to    8.612 sec.


Spectral model in the Band function:
------------------------------------------------------------
Parameters  : value       lower 90%   higher 90%
alpha       :    (     )
beta        :     (     )
Epeak [keV] :       (   )
Norm@50keV   :     (     )
------------------------------------------------------------

Photon flux (15-150 keV)    in  sec:  (    ) ph/cm2/s
Energy fluence (15-150 keV)             : 0 ( 0  0 ) ergs/cm2
Single BB
Spectral model blackbody:
------------------------------------------------------------
Parameters  : value    Lower 90%  Upper 90%
kT [keV]    : 13.6645  (-1.53743  1.70469)
R^2/D10^2   : 0.465148  (-0.158669   0.243886)
(R is the radius in km and D10 is the distance to the source in units of 10 kpc)
------------------------------------------------------------
#Fit statistic  : Chi-Squared                   69.68     using 59 bins.
 Reduced chi-squared =
# Null hypothesis probability of 1.21e-01 with 57 degrees of freedom

Energy  Fluence     90% Error
[keV]   [erg/cm2]   [erg/cm2]
15- 25  1.838e-08   3.075e-09
25- 50  6.672e-08   8.270e-09
50-150  8.099e-08   1.602e-08
15-150  1.661e-07   2.045e-08
Thermal bremsstrahlung (OTTB)
Spectral model: thermal bremsstrahlung
------------------------------------------------------------
Parameters  : value         Lower 90%    Upper 90%
kT [keV]    : 162.968       (-59.4213      -161.844)
Norm        : 12.1361       (-1.19208     1.44803)
------------------------------------------------------------
#Fit statistic  : Chi-Squared                   48.37     using 59 bins.
 Reduced chi-squared =
# Null hypothesis probability of 7.85e-01 with 57 degrees of freedom

Energy  Fluence     90% Error
[keV]   [erg/cm2]   [erg/cm2]
15- 25  3.093e-08   7.545e-09
25- 50  5.801e-08   2.186e-08
50-150  1.184e-07   6.425e-08
15-150  2.073e-07   9.868e-08
Double BB
Spectral model: bbodyrad<1> + bbodyrad<2>
------------------------------------------------------------
Parameters  : value         Lower 90%    Upper 90%
kT1 [keV]   : 5.29003        (-1.51579      2.18481)
R1^2/D10^2  : 7.59556        (-5.27753      15.9035)
kT2 [keV]   : 19.3577        (-3.33495      5.98074)
R2^2/D10^2  : 0.110996    (-0.0732555   0.108555)
------------------------------------------------------------
#Fit statistic  : Chi-Squared                   46.95     using 59 bins.
 Reduced chi-squared =
# Null hypothesis probability of 7.72e-01 with 55 degrees of freedom

Energy  Fluence     90% Error
[keV]   [erg/cm2]   [erg/cm2]
15- 25  3.114e-08   1.405e-08
25- 50  5.680e-08   1.913e-08
50-150  1.102e-07   4.815e-08
15-150  1.982e-07   7.555e-08
Pre-slew spectrum (Pre-slew PHA with pre-slew DRM)
Power-law model
Spectral model in power-law:
------------------------------------------------------------
Parameters  : value       lower 90%   higher 90%
Photon index: 1.11705     ( -0.024899   0.0247995 )
Norm@50keV  : 0.205385    ( -0.00294213   0.00293218 )
------------------------------------------------------------
#Fit statistic  : Chi-Squared                   42.86     using 59 bins.
 Reduced chi-squared =
# Null hypothesis probability of 9.18e-01 with 57 degrees of freedom

Photon flux (15-150 keV)    in 10.3 sec: 23.8642 ( -0.371092  0.37245 ) ph/cm2/s
Energy fluence (15-150 keV)             : 2.19988e-05 ( -2.87214e-07  2.87256e-07 ) ergs/cm2
Cutoff power-law model

Spectral model in the cutoff power-law:
------------------------------------------------------------
Parameters  : value       lower 90%   higher 90%
Photon index: 1.11244     ( -0.0289124   0.0239206 )
Epeak [keV] : 9951.00      ( -9945.33 -9945.33 )
Norm@50keV  : 0.206546    ( -0.00284576   0.022595 )
------------------------------------------------------------
#Fit statistic  : Chi-Squared                   42.80     using 59 bins.
 Reduced chi-squared =
# Null hypothesis probability of 9.03e-01 with 56 degrees of freedom

Photon flux (15-150 keV)    in 10.3 sec: 23.8501 ( -0.352  0.3725 ) ph/cm2/s
Energy fluence (15-150 keV)             : 2.19718e-05 ( 0  0 ) ergs/cm2
Band function

Spectral model in the Band function:
------------------------------------------------------------
Parameters  : value       lower 90%   higher 90%
alpha       :    (     )
beta        :     (     )
Epeak [keV] :       (   )
Norm@50keV   :     (     )
------------------------------------------------------------

Photon flux (15-150 keV)    in  sec:  (    ) ph/cm2/s
Energy fluence (15-150 keV)             : 0 ( 0  0 ) ergs/cm2
S(25-50 keV) vs. S(50-100 keV) plot
S(25-50 keV)  = 5.55e-06
S(50-100 keV) = 9.24e-06
T90 vs. Hardness ratio plot

T90                                   = 416 sec.
Hardness ratio (energy fluence ratio) = 1.66486
Color vs. Color plot

Count Ratio  (25-50 keV) / (15-25 keV) = 1.51371
Count Ratio (50-100 keV) / (15-25 keV) = 1.3586
Mask shadow pattern

IMX = -9.527226604463888E-02, IMY = -4.508503657237785E-01
TIME vs. PHA plot around the trigger time
Blue+Cyan dotted lines: Time interval of the scaled map
From 0.000000 to 0.512000
TIME vs. DetID plot around the trigger time

Blue+Cyan dotted lines: Time interval of the scaled map
From 0.000000 to 0.512000
100 us light curve (15-350 keV)

Blue+Cyan dotted lines: Time interval of the scaled map
From 0.000000 to 0.512000
Spacecraft aspect plot
Bright source in the pre-burst/pre-slew/post-slew images
Pre-burst image of 15-350 keV band
Time interval of the image:
-50.987400 0.112000

# RAcent  DECcent POSerr Theta    Phi  PeakCts   SNR AngSep     Name
#  [deg]    [deg]    ['] [deg]  [deg]                   [']
308.0343  40.9537    5.5  52.3 -179.0  -0.6414  -2.1    3.4	Cyg X-3
326.1696  38.3220   53.4  38.2 -177.2  -0.0299  -0.2    0.1	Cyg X-2
Pre-slew background subtracted image of 15-350 keV band
Time interval of the image:
0.112000 10.412600

# RAcent  DECcent POSerr Theta    Phi  PeakCts   SNR AngSep     Name
#  [deg]    [deg]    ['] [deg]  [deg]                   [']
308.1066  40.9067    3.3  52.2 -179.1  -3.3631  -3.5    2.8	Cyg X-3
326.4046  38.3847    0.0  38.0 -177.0   0.8360   1.9   11.6	Cyg X-2
344.5701   1.0189    0.2  24.7  101.9  31.9717  71.7 ------	UNKNOWN
302.6414  31.4723    2.9  56.0  168.9   8.2787   3.9 ------	UNKNOWN
338.6862  15.6547    2.9  23.5  141.0   1.5511   4.0 ------	UNKNOWN
 35.1727  19.7372    2.9  30.4  -46.4   1.5444   4.0 ------	UNKNOWN
 49.1317  30.9243    3.3  43.6  -64.0   4.9963   3.5 ------	UNKNOWN
 45.5824  36.7366    2.1  41.8  -73.2   5.0297   5.5 ------	UNKNOWN
Post-slew image of 15-350 keV band
Time interval of the image:
71.412600 962.117000

# RAcent  DECcent POSerr Theta    Phi  PeakCts   SNR AngSep     Name
#  [deg]    [deg]    ['] [deg]  [deg]                   [']
299.5482  35.2105    1.7  54.0 -175.2  27.3072   6.9    2.1	Cyg X-1
308.1056  40.9118   13.1  51.7 -164.5   3.0765   0.9    2.5	Cyg X-3
326.4414  38.3553    0.0  40.9 -151.5  -2.7598  -1.4   12.9	Cyg X-2
328.7661 -27.3425    3.3  32.2   77.4   7.4658   3.4 ------	UNKNOWN
  9.2017 -27.5913    2.5  37.1   12.6   7.0619   4.6 ------	UNKNOWN
Plot creation:
Sat Oct 19 18:17:33 EDT 2024