Estimated redshift from machine learning (Ukwatta et al. 2016) - may take a few minute to calcaulte
Image
Pre-slew 15.0-350.0 keV image (Event data)

#   RAcent    DECcent   POSerr    Theta     Phi              Peak Cts       SNR   Name
  345.7947    35.5128   0.0156    37.6757   128.7829         1.3053611     12.364 TRIG_01252695

Foreground time interval of the image:
  0.084  16.141 (delta_t =  16.057 [sec])
Background time interval of the image:
-239.760   0.084 (delta_t = 239.844 [sec])
Lightcurves
Notes:
- 1) The mask-weighted light curves are using the flight position.
- 2) Multiple plots of different time binning/intervals are shown to cover all scenarios of short/long GRBs, rate/image triggers, and real/false positives.
- 3) For all the mask-weighted lightcurves, the y-axis units are counts/sec/det where a det is 0.4 x 0.4 = 0.16 sq cm.
- 4) The verticle lines correspond to following: green dotted lines are T50 interval, black dotted lines are T90 interval, blue solid line(s) is a spacecraft slew start time, and orange solid line(s) is a spacecraft slew end time.
- 5) Time of each bin is in the middle of the bin.
1 s binning
From T0-310 s to T0+310 s

From T100_start - 20 s to T100_end + 30 s

Full time interval

64 ms binning
Full time interval

From T100_start to T100_end

From T0-5 sec to T0+5 sec

16 ms binning
From T100_start-5 s to T100_start+5 s

Blue+Cyan dotted lines: Time interval of the scaled map
From 0.000000 to 1.024000
8 ms binning
From T100_start-3 s to T100_start+3 s

Blue+Cyan dotted lines: Time interval of the scaled map
From 0.000000 to 1.024000
2 ms binning
From T100_start-1 s to T100_start+1 s

Blue+Cyan dotted lines: Time interval of the scaled map
From 0.000000 to 1.024000
SN=5 or 10 sec. binning (whichever binning is satisfied first)

SN=5 or 10 sec. binning (T < 200 sec)

Quad-rate summed light curves (from T0-300s to T0+1000s)

Spectral Evolution

Spectra
Notes:
- 1) The fitting includes the systematic errors.
- 2) When the burst includes telescope slew time periods, the fitting uses an average response file made from multiple 5-s response files through out the slew time plus single time preiod for the non-slew times, and weighted by the total counts in the corresponding time period using addrmf. An average response file is needed becuase a spectral fit using the pre-slew DRM will introduce some errors in both a spectral shape and a normalization if the PHA file contains a lot of the slew/post-slew time interval.
- 3) For fits to more complicated models (e.g. a power-law over a cutoff power-law), the BAT team has decided to require a chi-square improvement of more than 6 for each extra dof.
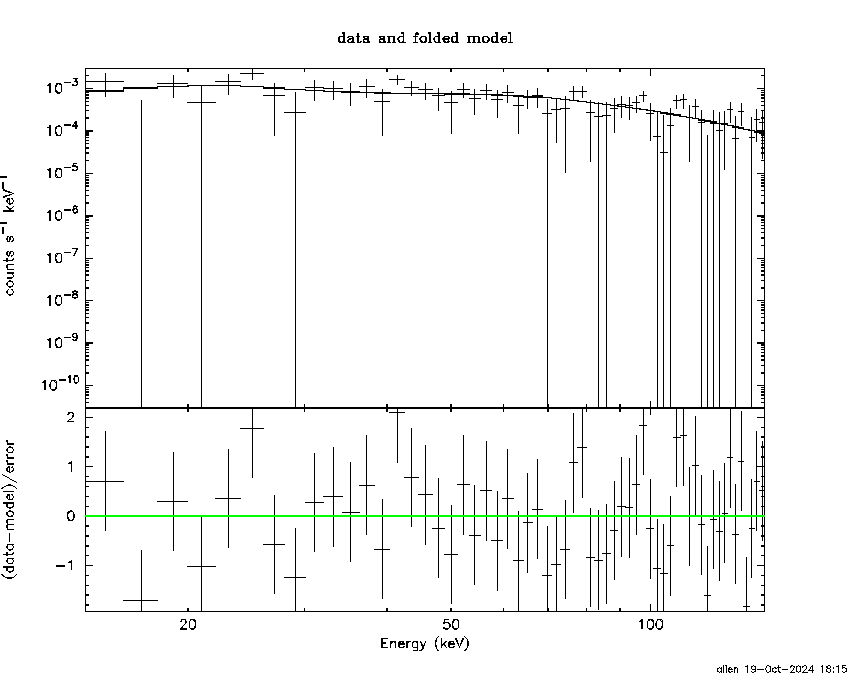
Time averaged spectrum fit using the average DRM
Power-law model

Time interval is from    0.084 sec. to  139.388 sec.

Spectral model in power-law:
------------------------------------------------------------
Parameters  : value       lower 90%   higher 90%
Photon index: 1.16690     ( -0.18626   0.181414 )
Norm@50keV  : 1.37888E-03    ( -0.000142405   0.000141916 )
------------------------------------------------------------
#Fit statistic  : Chi-Squared                   60.41     using 59 bins.
 Reduced chi-squared = 1.05982
# Null hypothesis probability of 3.54e-01 with 57 degrees of freedom

Photon flux (15-150 keV)    in 139.3 sec: 0.161139 ( -0.017405  0.017499 ) ph/cm2/s
Energy fluence (15-150 keV)             : 1.96763e-06 ( -2.16446e-07  2.17573e-07 ) ergs/cm2
Cutoff power-law model

Time interval is from    0.084 sec. to  139.388 sec.
Spectral model in the cutoff power-law:
------------------------------------------------------------
Parameters  : value       lower 90%   higher 90%
Photon index: 1.01073     ( -0.765224   0.466022 )
Epeak [keV] : 352.231      ( -352.233 -352.233 )
Norm@50keV  : 1.62762E-03    ( -0.000376238   0.00192904 )
------------------------------------------------------------
#Fit statistic  : Chi-Squared                   60.25     using 59 bins.
 Reduced chi-squared = 1.07589
# Null hypothesis probability of 3.25e-01 with 56 degrees of freedom

Photon flux (15-150 keV)    in 139.3 sec: 0.159992 ( -0.018112  0.017983 ) ph/cm2/s
Energy fluence (15-150 keV)             : 1.95034e-06 ( -2.32189e-07  2.27126e-07 ) ergs/cm2
Band function

Time interval is from    0.084 sec. to  139.388 sec.


Spectral model in the Band function:
------------------------------------------------------------
Parameters  : value       lower 90%   higher 90%
alpha       :    (     )
beta        :     (     )
Epeak [keV] :       (   )
Norm@50keV   :     (     )
------------------------------------------------------------

Photon flux (15-150 keV)    in  sec:  (    ) ph/cm2/s
Energy fluence (15-150 keV)             : 0 ( 0  0 ) ergs/cm2
Single BB

Spectral model blackbody:
------------------------------------------------------------
Parameters  : value    Lower 90%  Upper 90%
kT [keV]    : 19.7552  (-2.72283  3.36627)
R^2/D10^2   : 7.66501E-03  (-0.00309431   0.00492588)
(R is the radius in km and D10 is the distance to the source in units of 10 kpc)
------------------------------------------------------------
#Fit statistic  : Chi-Squared                   79.16     using 59 bins.
 Reduced chi-squared =
# Null hypothesis probability of 2.77e-02 with 57 degrees of freedom

Energy  Fluence     90% Error
[keV]   [erg/cm2]   [erg/cm2]
15- 25  8.072e-08   1.822e-08
25- 50  3.988e-07   6.533e-08
50-150  1.152e-06   2.080e-07
15-150  1.631e-06   2.177e-07
Thermal bremsstrahlung (OTTB)

Spectral model: thermal bremsstrahlung
------------------------------------------------------------
Parameters  : value         Lower 90%    Upper 90%
kT [keV]    : 200.000       (-26.3605      -200)
Norm        : 0.677811       (-0.0710605     0.0710605)
------------------------------------------------------------
#Fit statistic  : Chi-Squared                   72.97     using 59 bins.
 Reduced chi-squared =
# Null hypothesis probability of 7.55e-02 with 57 degrees of freedom

Energy  Fluence     90% Error
[keV]   [erg/cm2]   [erg/cm2]
15- 25  2.351e-07   8.827e-08
25- 50  4.522e-07   2.473e-07
50-150  9.917e-07   5.150e-07
15-150  1.679e-06   8.820e-07
Double BB

Spectral model: bbodyrad<1> + bbodyrad<2>
------------------------------------------------------------
Parameters  : value         Lower 90%    Upper 90%
kT1 [keV]   : 9.60305        (-2.75594      3.24696)
R1^2/D10^2  : 5.28888E-02        (-0.0305375      0.0549369)
kT2 [keV]   : 41.0821        (-13.9313      92.8477)
R2^2/D10^2  : 6.09597E-04    (-0.000531591   0.00169091)
------------------------------------------------------------
#Fit statistic  : Chi-Squared                   59.11     using 59 bins.
 Reduced chi-squared =
# Null hypothesis probability of 3.28e-01 with 55 degrees of freedom

Energy  Fluence     90% Error
[keV]   [erg/cm2]   [erg/cm2]
15- 25  1.544e-07   7.800e-08
25- 50  4.443e-07   2.172e-07
50-150  1.379e-06   7.208e-07
15-150  1.978e-06   9.850e-07
Peak spectrum fit
Power-law model

Time interval is from    0.084 sec. to    1.084 sec.

Spectral model in power-law:
------------------------------------------------------------
Parameters  : value       lower 90%   higher 90%
Photon index: 1.00870     ( -0.2867   0.273204 )
Norm@50keV  : 2.18169E-02    ( -0.00342368   0.0033884 )
------------------------------------------------------------
#Fit statistic  : Chi-Squared                   60.28     using 59 bins.
 Reduced chi-squared = 1.05754
# Null hypothesis probability of 3.58e-01 with 57 degrees of freedom

Photon flux (15-150 keV)    in 1 sec: 2.51295 ( -0.40169  0.40307 ) ph/cm2/s
Energy fluence (15-150 keV)             : 2.35218e-07 ( -3.84339e-08  3.85735e-08 ) ergs/cm2
Cutoff power-law model

Time interval is from    0.084 sec. to    1.084 sec.
Spectral model in the cutoff power-law:
------------------------------------------------------------
Parameters  : value       lower 90%   higher 90%
Photon index: 1.00269     ( -0.814806   0.332391 )
Epeak [keV] : 1.00000E+04      ( -10000 -10000 )
Norm@50keV  : 2.19463E-02    ( -0.00342985   0.00333125 )
------------------------------------------------------------
#Fit statistic  : Chi-Squared                   60.28     using 59 bins.
 Reduced chi-squared = 1.07643
# Null hypothesis probability of 3.24e-01 with 56 degrees of freedom

Photon flux (15-150 keV)    in 1 sec: 2.52134 ( -0.4336  0.41797 ) ph/cm2/s
Energy fluence (15-150 keV)             : 2.35586e-07 ( -4.10321e-08  4.03892e-08 ) ergs/cm2
Band function

Time interval is from    0.084 sec. to    1.084 sec.


Spectral model in the Band function:
------------------------------------------------------------
Parameters  : value       lower 90%   higher 90%
alpha       :    (     )
beta        :     (     )
Epeak [keV] :       (   )
Norm@50keV   :     (     )
------------------------------------------------------------

Photon flux (15-150 keV)    in  sec:  (    ) ph/cm2/s
Energy fluence (15-150 keV)             : 0 ( 0  0 ) ergs/cm2
Single BB

Spectral model blackbody:
------------------------------------------------------------
Parameters  : value    Lower 90%  Upper 90%
kT [keV]    : 25.8705  (-5.80074  8.14498)
R^2/D10^2   : 5.34171E-02  (-0.0294929   0.0638835)
(R is the radius in km and D10 is the distance to the source in units of 10 kpc)
------------------------------------------------------------
#Fit statistic  : Chi-Squared                   71.88     using 59 bins.
 Reduced chi-squared =
# Null hypothesis probability of 8.86e-02 with 57 degrees of freedom

Energy  Fluence     90% Error
[keV]   [erg/cm2]   [erg/cm2]
15- 25  6.097e-09   2.166e-09
25- 50  3.519e-08   1.110e-08
50-150  1.736e-07   5.212e-08
15-150  2.149e-07   5.690e-08
Thermal bremsstrahlung (OTTB)

Spectral model: thermal bremsstrahlung
------------------------------------------------------------
Parameters  : value         Lower 90%    Upper 90%
kT [keV]    : 200.000       (-39.9481      -200)
Norm        : 10.3570       (-1.65653     1.65653)
------------------------------------------------------------
#Fit statistic  : Chi-Squared                   71.83     using 59 bins.
 Reduced chi-squared =
# Null hypothesis probability of 8.93e-02 with 57 degrees of freedom

Energy  Fluence     90% Error
[keV]   [erg/cm2]   [erg/cm2]
15- 25  2.579e-08   1.478e-08
25- 50  4.961e-08   2.837e-08
50-150  1.088e-07   6.120e-08
15-150  1.842e-07   1.039e-07
Double BB

Spectral model: bbodyrad<1> + bbodyrad<2>
------------------------------------------------------------
Parameters  : value         Lower 90%    Upper 90%
kT1 [keV]   : 6.86918        (-3.07372      4.22641)
R1^2/D10^2  : 2.21889        (-1.80856      22.6661)
kT2 [keV]   : 38.6376        (-11.42      32.2471)
R2^2/D10^2  : 1.47922E-02    (-0.0117056   0.0275919)
------------------------------------------------------------
#Fit statistic  : Chi-Squared                   58.77     using 59 bins.
 Reduced chi-squared =
# Null hypothesis probability of 3.39e-01 with 55 degrees of freedom

Energy  Fluence     90% Error
[keV]   [erg/cm2]   [erg/cm2]
15- 25  1.941e-08   1.084e-08
25- 50  4.148e-08   2.214e-08
50-150  1.838e-07   1.033e-07
15-150  2.447e-07   1.291e-07
Pre-slew spectrum (Pre-slew PHA with pre-slew DRM)
Power-law model
Spectral model in power-law:
------------------------------------------------------------
Parameters  : value       lower 90%   higher 90%
Photon index: 0.871622     ( -0.263054   0.243066 )
Norm@50keV  : 4.92035E-03    ( -0.000728221   0.000708814 )
------------------------------------------------------------
#Fit statistic  : Chi-Squared                   49.46     using 59 bins.
 Reduced chi-squared =
# Null hypothesis probability of 7.51e-01 with 57 degrees of freedom

Photon flux (15-150 keV)    in 16.06 sec: 0.564698 ( -0.081565  0.0823473 ) ph/cm2/s
Energy fluence (15-150 keV)             : 8.96778e-07 ( -1.21747e-07  1.22185e-07 ) ergs/cm2
Cutoff power-law model

Spectral model in the cutoff power-law:
------------------------------------------------------------
Parameters  : value       lower 90%   higher 90%
Photon index: 0.867230     ( -0.267128   0.243576 )
Epeak [keV] : 9999.36      ( -9999.36 -9999.36 )
Norm@50keV  : 4.95622E-03    ( -0.000682764   0.00707828 )
------------------------------------------------------------
#Fit statistic  : Chi-Squared                   49.46     using 59 bins.
 Reduced chi-squared =
# Null hypothesis probability of 7.19e-01 with 56 degrees of freedom

Photon flux (15-150 keV)    in 16.06 sec: 0.564764 ( -0.042051  0.08147 ) ph/cm2/s
Energy fluence (15-150 keV)             : 8.96965e-07 ( -1.24537e-07  1.21622e-07 ) ergs/cm2
Band function

Spectral model in the Band function:
------------------------------------------------------------
Parameters  : value       lower 90%   higher 90%
alpha       :    (     )
beta        :     (     )
Epeak [keV] :       (   )
Norm@50keV   :     (     )
------------------------------------------------------------

Photon flux (15-150 keV)    in  sec:  (    ) ph/cm2/s
Energy fluence (15-150 keV)             : 0 ( 0  0 ) ergs/cm2
S(25-50 keV) vs. S(50-100 keV) plot

S(25-50 keV)  = 4.05e-07
S(50-100 keV) = 7.22e-07
T90 vs. Hardness ratio plot

T90                                   = 121.155999898911 sec.
Hardness ratio (energy fluence ratio) = 1.78272
Color vs. Color plot

Count Ratio  (25-50 keV) / (15-25 keV) = 1.90053
Count Ratio (50-100 keV) / (15-25 keV) = 1.64367
Mask shadow pattern

IMX = -4.836911996927961E-01, IMY = -6.019577487709601E-01
TIME vs. PHA plot around the trigger time

Blue+Cyan dotted lines: Time interval of the scaled map
From 0.000000 to 1.024000
TIME vs. DetID plot around the trigger time

Blue+Cyan dotted lines: Time interval of the scaled map
From 0.000000 to 1.024000
100 us light curve (15-350 keV)

Blue+Cyan dotted lines: Time interval of the scaled map
From 0.000000 to 1.024000
Spacecraft aspect plot

Bright source in the pre-burst/pre-slew/post-slew images
Pre-burst image of 15-350 keV band
Time interval of the image:
-239.760000 0.084000

# RAcent  DECcent POSerr Theta    Phi  PeakCts   SNR AngSep     Name
#  [deg]    [deg]    ['] [deg]  [deg]                   [']
 83.6217  22.0176    0.9  48.0  -27.0   9.2218  12.8    0.7	Crab
325.9880  38.3294   10.1  48.2  146.8   1.5125   1.1    8.7	Cyg X-2
 36.9170  13.4040    2.7  38.1   40.1   2.7210   4.2 ------	UNKNOWN
338.4672  82.5910    2.8  34.9 -146.3   1.8156   4.1 ------	UNKNOWN
 94.0267  76.9046    2.5  33.7 -114.8   2.4226   4.6 ------	UNKNOWN
 93.6402  55.8627    2.5  34.5  -76.8   2.9402   4.6 ------	UNKNOWN
Pre-slew background subtracted image of 15-350 keV band
Time interval of the image:
0.084000 16.140600

# RAcent  DECcent POSerr Theta    Phi  PeakCts   SNR AngSep     Name
#  [deg]    [deg]    ['] [deg]  [deg]                   [']
 83.5806  22.1470   37.8  47.9  -27.0   0.0329   0.3    8.5	Crab
326.1480  38.4190    6.4  48.0  146.7   0.3447   1.8    5.9	Cyg X-2
345.7947  35.5128    0.9  37.7  128.8   1.3055  12.4 ------	UNKNOWN
Post-slew image of 15-350 keV band
Time interval of the image:
93.940600 322.940600

# RAcent  DECcent POSerr Theta    Phi  PeakCts   SNR AngSep     Name
#  [deg]    [deg]    ['] [deg]  [deg]                   [']
299.5832  35.1921    1.3  37.4 -167.6   3.8108   8.8    0.7	Cyg X-1
308.2075  40.8954    3.2  29.8 -159.2   1.2471   3.6    5.6	Cyg X-3
326.3700  38.2988   28.3  15.8 -165.0   0.1231   0.4    9.4	Cyg X-2
346.9789  -2.7146    2.6  38.2   87.1   4.2300   4.4 ------	UNKNOWN
306.1649   1.6005    2.8  50.0  145.3   5.9966   4.2 ------	UNKNOWN
 40.3701  14.6508    2.2  52.9    7.6   3.5865   5.2 ------	UNKNOWN
343.3150  35.3971    2.0   2.0  177.0   1.6641   5.8 ------	UNKNOWN
 41.4775  33.4591    3.3  45.3  -15.4   1.7786   3.5 ------	UNKNOWN
301.3309  47.8837    2.5  34.9 -146.3   1.9656   4.7 ------	UNKNOWN
Plot creation:
Sat Oct 19 18:15:33 EDT 2024