Estimated redshift from machine learning (Ukwatta et al. 2016) - may take a few minute to calcaulte
Image
Pre-slew 15.0-350.0 keV image (Event data)
#   RAcent    DECcent   POSerr    Theta     Phi              Peak Cts       SNR   Name
  124.6227    33.9950   0.0067    29.0863  -165.3448         1.4673395     28.729 TRIG_01253910

Foreground time interval of the image:
 -3.648  10.157 (delta_t =  13.805 [sec])
Background time interval of the image:
-156.443  -3.648 (delta_t = 152.795 [sec])
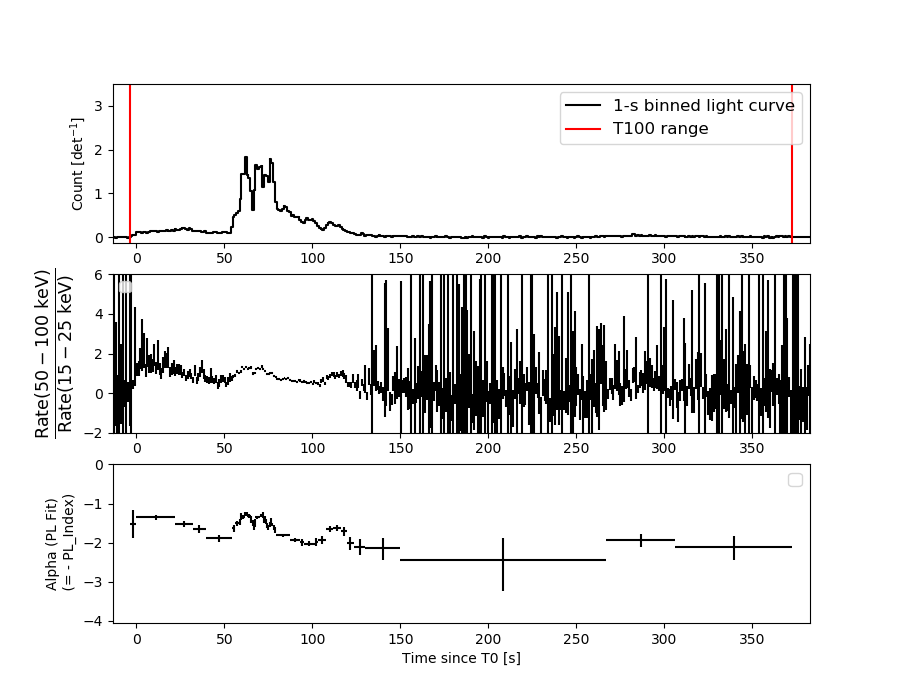
Lightcurves
Notes:
- 1) The mask-weighted light curves are using the flight position.
- 2) Multiple plots of different time binning/intervals are shown to cover all scenarios of short/long GRBs, rate/image triggers, and real/false positives.
- 3) For all the mask-weighted lightcurves, the y-axis units are counts/sec/det where a det is 0.4 x 0.4 = 0.16 sq cm.
- 4) The verticle lines correspond to following: green dotted lines are T50 interval, black dotted lines are T90 interval, blue solid line(s) is a spacecraft slew start time, and orange solid line(s) is a spacecraft slew end time.
- 5) Time of each bin is in the middle of the bin.
1 s binning
From T0-310 s to T0+310 s

From T100_start - 20 s to T100_end + 30 s
Full time interval
64 ms binning
Full time interval
From T100_start to T100_end
From T0-5 sec to T0+5 sec
16 ms binning
From T100_start-5 s to T100_start+5 s
Blue+Cyan dotted lines: Time interval of the scaled map
From 0.000000 to 0.512000
8 ms binning
From T100_start-3 s to T100_start+3 s

Blue+Cyan dotted lines: Time interval of the scaled map
From 0.000000 to 0.512000
2 ms binning
From T100_start-1 s to T100_start+1 s
Blue+Cyan dotted lines: Time interval of the scaled map
From 0.000000 to 0.512000
SN=5 or 10 sec. binning (whichever binning is satisfied first)
SN=5 or 10 sec. binning (T < 200 sec)
Quad-rate summed light curves (from T0-300s to T0+1000s)

Spectral Evolution
Spectra
Notes:
- 1) The fitting includes the systematic errors.
- 2) When the burst includes telescope slew time periods, the fitting uses an average response file made from multiple 5-s response files through out the slew time plus single time preiod for the non-slew times, and weighted by the total counts in the corresponding time period using addrmf. An average response file is needed becuase a spectral fit using the pre-slew DRM will introduce some errors in both a spectral shape and a normalization if the PHA file contains a lot of the slew/post-slew time interval.
- 3) For fits to more complicated models (e.g. a power-law over a cutoff power-law), the BAT team has decided to require a chi-square improvement of more than 6 for each extra dof.
Time averaged spectrum fit using the average DRM
Power-law model
Time interval is from   -3.648 sec. to  373.028 sec.

Spectral model in power-law:
------------------------------------------------------------
Parameters  : value       lower 90%   higher 90%
Photon index: 1.62451     ( -0.0255764   0.0255143 )
Norm@50keV  : 9.60437E-03    ( -0.000131926   0.000131782 )
------------------------------------------------------------
#Fit statistic  : Chi-Squared                   36.54     using 59 bins.
 Reduced chi-squared = 0.641053
# Null hypothesis probability of 9.84e-01 with 57 degrees of freedom

Photon flux (15-150 keV)    in 376.7 sec: 1.24380 ( -0.02216  0.02227 ) ph/cm2/s
Energy fluence (15-150 keV)             : 3.37439e-05 ( -4.45346e-07  4.45806e-07 ) ergs/cm2
Cutoff power-law model
Time interval is from   -3.648 sec. to  373.028 sec.
Spectral model in the cutoff power-law:
------------------------------------------------------------
Parameters  : value       lower 90%   higher 90%
Photon index: 1.45014     ( -0.108286   0.105988 )
Epeak [keV] : 193.985      ( -50.5613 191.316 )
Norm@50keV  : 1.13027E-02    ( -0.00104296   0.00117146 )
------------------------------------------------------------
#Fit statistic  : Chi-Squared                   28.63     using 59 bins.
 Reduced chi-squared = 0.51125
# Null hypothesis probability of 9.99e-01 with 56 degrees of freedom

Photon flux (15-150 keV)    in 376.7 sec: 1.21947 ( -0.02603  0.02626 ) ph/cm2/s
Energy fluence (15-150 keV)             : 3.34261e-05 ( -4.82911e-07  4.82952e-07 ) ergs/cm2
Band function

Time interval is from   -3.648 sec. to  373.028 sec.


Spectral model in the Band function:
------------------------------------------------------------
Parameters  : value       lower 90%   higher 90%
alpha       :    (     )
beta        :     (     )
Epeak [keV] :       (   )
Norm@50keV   :     (     )
------------------------------------------------------------

Photon flux (15-150 keV)    in  sec:  (    ) ph/cm2/s
Energy fluence (15-150 keV)             : 0 ( 0  0 ) ergs/cm2
Single BB
Spectral model blackbody:
------------------------------------------------------------
Parameters  : value    Lower 90%  Upper 90%
kT [keV]    : 18.6186  (  )
R^2/D10^2   : 5.95582E-02  (   )
(R is the radius in km and D10 is the distance to the source in units of 10 kpc)
------------------------------------------------------------
#Fit statistic  : Chi-Squared                 1192.99     using 59 bins.
 Reduced chi-squared =
# Null hypothesis probability of 3.44e-212 with 57 degrees of freedom

Energy  Fluence     90% Error
[keV]   [erg/cm2]   [erg/cm2]
15- 25  1.540e-06   4.577e-08
25- 50  7.300e-06   1.488e-07
50-150  1.852e-05   3.447e-07
15-150  2.736e-05   3.710e-07
Thermal bremsstrahlung (OTTB)
Spectral model: thermal bremsstrahlung
------------------------------------------------------------
Parameters  : value         Lower 90%    Upper 90%
kT [keV]    : 200.000       (-8.37977      -200)
Norm        : 4.92907       (-0.0648662     0.0648662)
------------------------------------------------------------
#Fit statistic  : Chi-Squared                   37.31     using 59 bins.
 Reduced chi-squared =
# Null hypothesis probability of 9.80e-01 with 57 degrees of freedom

Energy  Fluence     90% Error
[keV]   [erg/cm2]   [erg/cm2]
15- 25  4.626e-06   8.099e-08
25- 50  8.899e-06   1.526e-07
50-150  1.952e-05   3.371e-07
15-150  3.304e-05   5.387e-07
Double BB
Spectral model: bbodyrad<1> + bbodyrad<2>
------------------------------------------------------------
Parameters  : value         Lower 90%    Upper 90%
kT1 [keV]   : 7.96638        (-0.423727      0.443509)
R1^2/D10^2  : 0.812963        (-0.142042      0.180011)
kT2 [keV]   : 28.9949        (-1.32776      1.53173)
R2^2/D10^2  : 9.78773E-03    (-0.00171848   0.00191428)
------------------------------------------------------------
#Fit statistic  : Chi-Squared                   57.97     using 59 bins.
 Reduced chi-squared =
# Null hypothesis probability of 3.66e-01 with 55 degrees of freedom

Energy  Fluence     90% Error
[keV]   [erg/cm2]   [erg/cm2]
15- 25  3.999e-06   2.143e-07
25- 50  9.098e-06   2.147e-07
50-150  1.968e-05   4.313e-07
15-150  3.278e-05   6.310e-07
Peak spectrum fit
Power-law model
Time interval is from   76.052 sec. to   77.052 sec.

Spectral model in power-law:
------------------------------------------------------------
Parameters  : value       lower 90%   higher 90%
Photon index: 1.49701     ( -0.0481667   0.0482754 )
Norm@50keV  : 0.119582    ( -0.00314338   0.00314291 )
------------------------------------------------------------
#Fit statistic  : Chi-Squared                   54.32     using 59 bins.
 Reduced chi-squared = 0.952982
# Null hypothesis probability of 5.76e-01 with 57 degrees of freedom

Photon flux (15-150 keV)    in 1 sec: 14.9170 ( -0.4235  0.4243 ) ph/cm2/s
Energy fluence (15-150 keV)             : 1.13512e-06 ( -3.1753e-08  3.1824e-08 ) ergs/cm2
Cutoff power-law model
Time interval is from   76.052 sec. to   77.052 sec.
Spectral model in the cutoff power-law:
------------------------------------------------------------
Parameters  : value       lower 90%   higher 90%
Photon index: 1.22362     ( -0.20228   0.193412 )
Epeak [keV] : 154.422      ( -43.3565 221.113 )
Norm@50keV  : 0.160274    ( -0.0293128   0.0377613 )
------------------------------------------------------------
#Fit statistic  : Chi-Squared                   48.41     using 59 bins.
 Reduced chi-squared = 0.864464
# Null hypothesis probability of 7.54e-01 with 56 degrees of freedom

Photon flux (15-150 keV)    in 1 sec: 14.6529 ( -0.4584  0.4598 ) ph/cm2/s
Energy fluence (15-150 keV)             : 7.13724e-07 ( -3.84034e-08  3.19002e-08 ) ergs/cm2
Band function

Time interval is from   76.052 sec. to   77.052 sec.


Spectral model in the Band function:
------------------------------------------------------------
Parameters  : value       lower 90%   higher 90%
alpha       :    (     )
beta        :     (     )
Epeak [keV] :       (   )
Norm@50keV   :     (     )
------------------------------------------------------------

Photon flux (15-150 keV)    in  sec:  (    ) ph/cm2/s
Energy fluence (15-150 keV)             : 0 ( 0  0 ) ergs/cm2
Single BB

Spectral model blackbody:
------------------------------------------------------------
Parameters  : value    Lower 90%  Upper 90%
kT [keV]    : 16.2356  (  )
R^2/D10^2   : 1.25961  (   )
(R is the radius in km and D10 is the distance to the source in units of 10 kpc)
------------------------------------------------------------
#Fit statistic  : Chi-Squared                  327.87     using 59 bins.
 Reduced chi-squared =
# Null hypothesis probability of 1.07e-39 with 57 degrees of freedom

Energy  Fluence     90% Error
[keV]   [erg/cm2]   [erg/cm2]
15- 25  6.842e-08   3.515e-09
25- 50  2.915e-07   1.030e-08
50-150  5.400e-07   2.585e-08
15-150  9.000e-07   2.930e-08
Thermal bremsstrahlung (OTTB)

Spectral model: thermal bremsstrahlung
------------------------------------------------------------
Parameters  : value         Lower 90%    Upper 90%
kT [keV]    : 200.000       (-8.71572      -200)
Norm        : 61.2520       (-1.60609     1.60609)
------------------------------------------------------------
#Fit statistic  : Chi-Squared                   56.59     using 59 bins.
 Reduced chi-squared =
# Null hypothesis probability of 4.91e-01 with 57 degrees of freedom

Energy  Fluence     90% Error
[keV]   [erg/cm2]   [erg/cm2]
15- 25  1.525e-07   4.550e-09
25- 50  2.934e-07   8.600e-09
50-150  6.435e-07   1.865e-08
15-150  1.089e-06   3.200e-08
Double BB
Spectral model: bbodyrad<1> + bbodyrad<2>
------------------------------------------------------------
Parameters  : value         Lower 90%    Upper 90%
kT1 [keV]   : 8.47189        (-0.93713      0.981247)
R1^2/D10^2  : 7.89478        (-2.19783      3.50393)
kT2 [keV]   : 30.8557        (-3.86847      5.74152)
R2^2/D10^2  : 0.102527    (-0.0454592   0.0647255)
------------------------------------------------------------
#Fit statistic  : Chi-Squared                   59.34     using 59 bins.
 Reduced chi-squared =
# Null hypothesis probability of 3.20e-01 with 55 degrees of freedom

Energy  Fluence     90% Error
[keV]   [erg/cm2]   [erg/cm2]
15- 25  1.216e-07   1.045e-08
25- 50  2.992e-07   1.665e-08
50-150  6.874e-07   7.155e-08
15-150  1.108e-06   7.495e-08
Pre-slew spectrum (Pre-slew PHA with pre-slew DRM)
Power-law model
Spectral model in power-law:
------------------------------------------------------------
Parameters  : value       lower 90%   higher 90%
Photon index: 1.31588     ( -0.090296   0.0897547 )
Norm@50keV  : 7.15662E-03    ( -0.000378039   0.000378039 )
------------------------------------------------------------
#Fit statistic  : Chi-Squared                   57.33     using 59 bins.
 Reduced chi-squared =
# Null hypothesis probability of 4.63e-01 with 57 degrees of freedom

Photon flux (15-150 keV)    in 13.8 sec: 0.856347 ( -0.0474667  0.0475518 ) ph/cm2/s
Energy fluence (15-150 keV)             : 9.72218e-07 ( -5.53914e-08  5.55508e-08 ) ergs/cm2
Cutoff power-law model
Spectral model in the cutoff power-law:
------------------------------------------------------------
Parameters  : value       lower 90%   higher 90%
Photon index: 0.715204     ( -0.430421   0.389487 )
Epeak [keV] : 113.536      ( -27.1279 106.044 )
Norm@50keV  : 1.38990E-02    ( -0.00476966   0.00819017 )
------------------------------------------------------------
#Fit statistic  : Chi-Squared                   50.09     using 59 bins.
 Reduced chi-squared =
# Null hypothesis probability of 6.97e-01 with 56 degrees of freedom

Photon flux (15-150 keV)    in 13.8 sec: 0.834477 ( -0.049533  0.049544 ) ph/cm2/s
Energy fluence (15-150 keV)             : 9.37902e-07 ( -6.11588e-08  6.068e-08 ) ergs/cm2
Band function
Spectral model in the Band function:
------------------------------------------------------------
Parameters  : value       lower 90%   higher 90%
alpha       :    (     )
beta        :     (     )
Epeak [keV] :       (   )
Norm@50keV   :     (     )
------------------------------------------------------------

Photon flux (15-150 keV)    in  sec:  (    ) ph/cm2/s
Energy fluence (15-150 keV)             : 0 ( 0  0 ) ergs/cm2
S(25-50 keV) vs. S(50-100 keV) plot

S(25-50 keV)  = 8.85e-06
S(50-100 keV) = 1.15e-05
T90 vs. Hardness ratio plot
T90                                   = 114.931999921799 sec.
Hardness ratio (energy fluence ratio) = 1.29944
Color vs. Color plot
Count Ratio  (25-50 keV) / (15-25 keV) = 1.26842
Count Ratio (50-100 keV) / (15-25 keV) = 0.902441
Mask shadow pattern
IMX = -5.381822438423821E-01, IMY = 1.407399230798909E-01
TIME vs. PHA plot around the trigger time

Blue+Cyan dotted lines: Time interval of the scaled map
From 0.000000 to 0.512000
TIME vs. DetID plot around the trigger time
Blue+Cyan dotted lines: Time interval of the scaled map
From 0.000000 to 0.512000
100 us light curve (15-350 keV)
Blue+Cyan dotted lines: Time interval of the scaled map
From 0.000000 to 0.512000
Spacecraft aspect plot
Bright source in the pre-burst/pre-slew/post-slew images
Pre-burst image of 15-350 keV band
Time interval of the image:
-156.443400 -3.648000

# RAcent  DECcent POSerr Theta    Phi  PeakCts   SNR AngSep     Name
#  [deg]    [deg]    ['] [deg]  [deg]                   [']
 83.6361  22.0239    1.4  39.9  127.2   6.0964   8.5    0.6	Crab
135.4504 -40.5079    5.5  47.5   -6.3   0.8386   2.1    4.5	Vela X-1
 89.4123  -3.7321    2.5  32.8   83.5   2.1224   4.7 ------	UNKNOWN
129.0911 -38.8238    2.6  44.6   -0.4   1.6968   4.5 ------	UNKNOWN
Pre-slew background subtracted image of 15-350 keV band
Time interval of the image:
-3.648000 10.156600

# RAcent  DECcent POSerr Theta    Phi  PeakCts   SNR AngSep     Name
#  [deg]    [deg]    ['] [deg]  [deg]                   [']
 83.5955  21.8556   14.9  39.9  127.0   0.1000   0.8    9.8	Crab
135.4464 -40.5222    3.5  47.5   -6.3   0.2931   3.3    4.2	Vela X-1
 99.8233  50.8858    2.1  49.1  171.0   0.6639   5.5 ------	UNKNOWN
127.5182   2.9374    2.6   6.8  -63.2   0.2003   4.5 ------	UNKNOWN
124.6227  33.9950    0.4  29.1 -165.3   1.4675  28.7 ------	UNKNOWN
Post-slew image of 15-350 keV band
Time interval of the image:
93.356590 962.717100

# RAcent  DECcent POSerr Theta    Phi  PeakCts   SNR AngSep     Name
#  [deg]    [deg]    ['] [deg]  [deg]                   [']
 83.6423  21.9963    1.2  37.9   58.0  30.4852   9.3    1.2	Crab
 95.2701  60.7696    2.8  32.8  129.3   8.1617   4.1 ------	UNKNOWN
 98.3355  20.4023    3.2  26.9   42.1   5.0300   3.6 ------	UNKNOWN
124.6507  33.9904    1.3   0.0 -157.0  11.1924   9.0 ------	UNKNOWN
181.5906  36.0673    2.7  46.0 -134.1  12.5323   4.3 ------	UNKNOWN
Plot creation:
Sat Oct 19 18:14:55 EDT 2024