Estimated redshift from machine learning (Ukwatta et al. 2016) - may take a few minute to calcaulte
Image
Pre-slew 15.0-350.0 keV image (Event data)

#   RAcent    DECcent   POSerr    Theta     Phi              Peak Cts       SNR   Name
  304.7794   -40.8048   0.0150    24.5510    49.5344         1.6233681     12.827 TRIG_01258721

Foreground time interval of the image:
 -5.576  48.424 (delta_t =  54.000 [sec])
Background time interval of the image:
-239.576  -5.576 (delta_t = 234.000 [sec])
Lightcurves
Notes:
- 1) The mask-weighted light curves are using the flight position.
- 2) Multiple plots of different time binning/intervals are shown to cover all scenarios of short/long GRBs, rate/image triggers, and real/false positives.
- 3) For all the mask-weighted lightcurves, the y-axis units are counts/sec/det where a det is 0.4 x 0.4 = 0.16 sq cm.
- 4) The verticle lines correspond to following: green dotted lines are T50 interval, black dotted lines are T90 interval, blue solid line(s) is a spacecraft slew start time, and orange solid line(s) is a spacecraft slew end time.
- 5) Time of each bin is in the middle of the bin.
1 s binning
From T0-310 s to T0+310 s
From T100_start - 20 s to T100_end + 30 s
Full time interval

64 ms binning
Full time interval

From T100_start to T100_end
From T0-5 sec to T0+5 sec

16 ms binning
From T100_start-5 s to T100_start+5 s

8 ms binning
From T100_start-3 s to T100_start+3 s

2 ms binning
From T100_start-1 s to T100_start+1 s
SN=5 or 10 sec. binning (whichever binning is satisfied first)

SN=5 or 10 sec. binning (T < 200 sec)

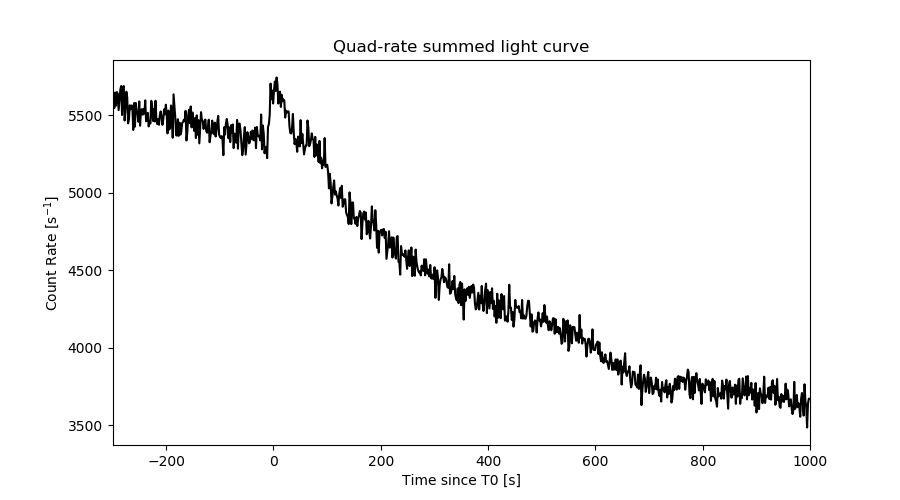
Quad-rate summed light curves (from T0-300s to T0+1000s)
Spectral Evolution

Spectra
Notes:
- 1) The fitting includes the systematic errors.
- 2) When the burst includes telescope slew time periods, the fitting uses an average response file made from multiple 5-s response files through out the slew time plus single time preiod for the non-slew times, and weighted by the total counts in the corresponding time period using addrmf. An average response file is needed becuase a spectral fit using the pre-slew DRM will introduce some errors in both a spectral shape and a normalization if the PHA file contains a lot of the slew/post-slew time interval.
- 3) For fits to more complicated models (e.g. a power-law over a cutoff power-law), the BAT team has decided to require a chi-square improvement of more than 6 for each extra dof.
Time averaged spectrum fit using the average DRM
Power-law model

Time interval is from   -5.576 sec. to   48.424 sec.

Spectral model in power-law:
------------------------------------------------------------
Parameters  : value       lower 90%   higher 90%
Photon index: 1.53708     ( -0.197038   0.199934 )
Norm@50keV  : 1.92829E-03    ( -0.000236609   0.000234608 )
------------------------------------------------------------
#Fit statistic  : Chi-Squared                   67.93     using 59 bins.
 Reduced chi-squared = 1.19175
# Null hypothesis probability of 1.52e-01 with 57 degrees of freedom

Photon flux (15-150 keV)    in 54 sec: 0.243214 ( -0.028706  0.028738 ) ph/cm2/s
Energy fluence (15-150 keV)             : 9.82233e-07 ( -1.30401e-07  1.32225e-07 ) ergs/cm2
Cutoff power-law model

Time interval is from   -5.576 sec. to   48.424 sec.
Spectral model in the cutoff power-law:
------------------------------------------------------------
Parameters  : value       lower 90%   higher 90%
Photon index: 0.724808     ( -1.00882   0.817926 )
Epeak [keV] : 74.1618      ( -20.1884 925.768 )
Norm@50keV  : 5.18183E-03    ( -0.00321946   0.0121787 )
------------------------------------------------------------
#Fit statistic  : Chi-Squared                   65.06     using 59 bins.
 Reduced chi-squared = 1.16179
# Null hypothesis probability of 1.90e-01 with 56 degrees of freedom

Photon flux (15-150 keV)    in 54 sec: 0.235508 ( -0.029817  0.029799 ) ph/cm2/s
Energy fluence (15-150 keV)             : 9.15489e-07 ( -1.43549e-07  1.47977e-07 ) ergs/cm2
Band function

Time interval is from   -5.576 sec. to   48.424 sec.


Spectral model in the Band function:
------------------------------------------------------------
Parameters  : value       lower 90%   higher 90%
alpha       :    (     )
beta        :     (     )
Epeak [keV] :       (   )
Norm@50keV   :     (     )
------------------------------------------------------------

Photon flux (15-150 keV)    in  sec:  (    ) ph/cm2/s
Energy fluence (15-150 keV)             : 0 ( 0  0 ) ergs/cm2
Single BB

Spectral model blackbody:
------------------------------------------------------------
Parameters  : value    Lower 90%  Upper 90%
kT [keV]    : 13.8782  (-1.83594  2.16765)
R^2/D10^2   : 3.66442E-02  (-0.0148337   0.0242087)
(R is the radius in km and D10 is the distance to the source in units of 10 kpc)
------------------------------------------------------------
#Fit statistic  : Chi-Squared                   75.27     using 59 bins.
 Reduced chi-squared =
# Null hypothesis probability of 5.29e-02 with 57 degrees of freedom

Energy  Fluence     90% Error
[keV]   [erg/cm2]   [erg/cm2]
15- 25  8.057e-08   2.028e-08
25- 50  2.971e-07   5.030e-08
50-150  3.750e-07   9.229e-08
15-150  7.527e-07   1.161e-07
Thermal bremsstrahlung (OTTB)
Spectral model: thermal bremsstrahlung
------------------------------------------------------------
Parameters  : value         Lower 90%    Upper 90%
kT [keV]    : 195.439       (-85.0009      -192.593)
Norm        : 0.998413       (-0.117735     0.134444)
------------------------------------------------------------
#Fit statistic  : Chi-Squared                   66.13     using 59 bins.
 Reduced chi-squared =
# Null hypothesis probability of 1.91e-01 with 57 degrees of freedom

Energy  Fluence     90% Error
[keV]   [erg/cm2]   [erg/cm2]
15- 25  1.346e-07   7.546e-08
25- 50  2.583e-07   1.396e-07
50-150  5.628e-07   3.081e-07
15-150  9.557e-07   5.211e-07
Double BB

Spectral model: bbodyrad<1> + bbodyrad<2>
------------------------------------------------------------
Parameters  : value         Lower 90%    Upper 90%
kT1 [keV]   : 6.76861        (-2.57662      3.9354)
R1^2/D10^2  : 0.252562        (-0.18289      1.07179)
kT2 [keV]   : 21.4142        (-5.66793      25.8963)
R2^2/D10^2  : 6.03171E-03    (-0.00568435   0.0146754)
------------------------------------------------------------
#Fit statistic  : Chi-Squared                   64.56     using 59 bins.
 Reduced chi-squared =
# Null hypothesis probability of 1.77e-01 with 55 degrees of freedom

Energy  Fluence     90% Error
[keV]   [erg/cm2]   [erg/cm2]
15- 25  1.248e-07   6.815e-08
25- 50  2.697e-07   1.390e-07
50-150  5.164e-07   2.859e-07
15-150  9.108e-07   4.801e-07
Peak spectrum fit
Power-law model

Time interval is from   10.424 sec. to   11.424 sec.

Spectral model in power-law:
------------------------------------------------------------
Parameters  : value       lower 90%   higher 90%
Photon index: 1.45495     ( -0.475114   0.493629 )
Norm@50keV  : 5.31255E-03    ( -0.00166566   0.00165189 )
------------------------------------------------------------
#Fit statistic  : Chi-Squared                   55.77     using 59 bins.
 Reduced chi-squared = 0.978421
# Null hypothesis probability of 5.21e-01 with 57 degrees of freedom

Photon flux (15-150 keV)    in 1 sec: 0.655465 ( -0.202649  0.203656 ) ph/cm2/s
Energy fluence (15-150 keV)             : 5.08089e-08 ( -1.69268e-08  1.74344e-08 ) ergs/cm2
Cutoff power-law model

Time interval is from   10.424 sec. to   11.424 sec.
Spectral model in the cutoff power-law:
------------------------------------------------------------
Parameters  : value       lower 90%   higher 90%
Photon index: -1.21245     ( -6.21936   2.44529 )
Epeak [keV] : 62.2346      ( -16.3922 101.32 )
Norm@50keV  : 0.102084    ( -0.102747   97.5164 )
------------------------------------------------------------
#Fit statistic  : Chi-Squared                   52.15     using 59 bins.
 Reduced chi-squared = 0.93125
# Null hypothesis probability of 6.21e-01 with 56 degrees of freedom

Photon flux (15-150 keV)    in 1 sec: 0.595144 ( -0.207177  0.211675 ) ph/cm2/s
Energy fluence (15-150 keV)             : 4.51825e-08 ( -1.62584e-08  1.78566e-08 ) ergs/cm2
Band function

Time interval is from   10.424 sec. to   11.424 sec.


Spectral model in the Band function:
------------------------------------------------------------
Parameters  : value       lower 90%   higher 90%
alpha       :    (     )
beta        :     (     )
Epeak [keV] :       (   )
Norm@50keV   :     (     )
------------------------------------------------------------

Photon flux (15-150 keV)    in  sec:  (    ) ph/cm2/s
Energy fluence (15-150 keV)             : 0 ( 0  0 ) ergs/cm2
Single BB

Spectral model blackbody:
------------------------------------------------------------
Parameters  : value    Lower 90%  Upper 90%
kT [keV]    : 15.7527  (-3.97034  5.64812)
R^2/D10^2   : 7.00200E-02  (-0.07002   0.122321)
(R is the radius in km and D10 is the distance to the source in units of 10 kpc)
------------------------------------------------------------
#Fit statistic  : Chi-Squared                   52.13     using 59 bins.
 Reduced chi-squared =
# Null hypothesis probability of 6.58e-01 with 57 degrees of freedom

Energy  Fluence     90% Error
[keV]   [erg/cm2]   [erg/cm2]
15- 25  3.605e-09   2.278e-09
25- 50  1.497e-08   8.256e-09
50-150  2.580e-08   1.705e-08
15-150  4.437e-08   2.341e-08
Thermal bremsstrahlung (OTTB)

Spectral model: thermal bremsstrahlung
------------------------------------------------------------
Parameters  : value         Lower 90%    Upper 90%
kT [keV]    : 199.315       (-131.048      -199.337)
Norm        : 2.73539       (-0.823932     0.964425)
------------------------------------------------------------
#Fit statistic  : Chi-Squared                   54.96     using 59 bins.
 Reduced chi-squared =
# Null hypothesis probability of 5.52e-01 with 57 degrees of freedom

Energy  Fluence     90% Error
[keV]   [erg/cm2]   [erg/cm2]
15- 25  6.812e-09   4.291e-09
25- 50  1.310e-08   8.200e-09
50-150  2.873e-08   1.740e-08
15-150  4.865e-08   2.971e-08
Double BB

Spectral model: bbodyrad<1> + bbodyrad<2>
------------------------------------------------------------
Parameters  : value         Lower 90%    Upper 90%
kT1 [keV]   : 2.51939        (-2.5263      41.4722)
R1^2/D10^2  : 22.1175        (-21.7913      -21.7913)
kT2 [keV]   : 16.2890        (-4.31424      -16.2898)
R2^2/D10^2  : 6.10179E-02    (-0.0610049   0.121602)
------------------------------------------------------------
#Fit statistic  : Chi-Squared                   51.86     using 59 bins.
 Reduced chi-squared =
# Null hypothesis probability of 5.95e-01 with 55 degrees of freedom

Energy  Fluence     90% Error
[keV]   [erg/cm2]   [erg/cm2]
15- 25  4.617e-09   2.331e-09
25- 50  1.434e-08   8.740e-09
50-150  2.659e-08   1.714e-08
15-150  4.555e-08   2.700e-08
Pre-slew spectrum (Pre-slew PHA with pre-slew DRM)
Power-law model

Spectral model in power-law:
------------------------------------------------------------
Parameters  : value       lower 90%   higher 90%
Photon index: 1.53708     ( -0.197038   0.199934 )
Norm@50keV  : 1.92829E-03    ( -0.000236609   0.000234608 )
------------------------------------------------------------
#Fit statistic  : Chi-Squared                   67.93     using 59 bins.
 Reduced chi-squared =
# Null hypothesis probability of 1.52e-01 with 57 degrees of freedom

Photon flux (15-150 keV)    in 54 sec: 0.243207 ( -0.028705  0.0287365 ) ph/cm2/s
Energy fluence (15-150 keV)             : 9.82109e-07 ( -1.30367e-07  1.32239e-07 ) ergs/cm2
Cutoff power-law model
Spectral model in the cutoff power-law:
------------------------------------------------------------
Parameters  : value       lower 90%   higher 90%
Photon index: 0.724795     ( -1.00882   0.817928 )
Epeak [keV] : 74.1613      ( -20.1883 925.649 )
Norm@50keV  : 5.18191E-03    ( -0.00321947   0.0121787 )
------------------------------------------------------------
#Fit statistic  : Chi-Squared                   65.06     using 59 bins.
 Reduced chi-squared =
# Null hypothesis probability of 1.90e-01 with 56 degrees of freedom

Photon flux (15-150 keV)    in 54 sec: 0.235484 ( -0.029811  0.02979 ) ph/cm2/s
Energy fluence (15-150 keV)             : 9.15824e-07 ( -1.43845e-07  1.48316e-07 ) ergs/cm2
Band function

Spectral model in the Band function:
------------------------------------------------------------
Parameters  : value       lower 90%   higher 90%
alpha       :    (     )
beta        :     (     )
Epeak [keV] :       (   )
Norm@50keV   :     (     )
------------------------------------------------------------

Photon flux (15-150 keV)    in  sec:  (    ) ph/cm2/s
Energy fluence (15-150 keV)             : 0 ( 0  0 ) ergs/cm2
S(25-50 keV) vs. S(50-100 keV) plot

S(25-50 keV)  = 2.47e-07
S(50-100 keV) = 3.41e-07
T90 vs. Hardness ratio plot
T90                                   = 47 sec.
Hardness ratio (energy fluence ratio) = 1.38057
Color vs. Color plot

Count Ratio  (25-50 keV) / (15-25 keV) = 1.35673
Count Ratio (50-100 keV) / (15-25 keV) = 1.07947
Mask shadow pattern

IMX = 2.964608070197683E-01, IMY = -3.475327571423499E-01
TIME vs. PHA plot around the trigger time

TIME vs. DetID plot around the trigger time

100 us light curve (15-350 keV)

Spacecraft aspect plot

Bright source in the pre-burst/pre-slew/post-slew images
Pre-burst image of 15-350 keV band
Time interval of the image:
-239.576000 -5.576000

# RAcent  DECcent POSerr Theta    Phi  PeakCts   SNR AngSep     Name
#  [deg]    [deg]    ['] [deg]  [deg]                   [']
170.3630 -60.5860    2.9  47.8 -141.6   4.8656   4.0    2.6	Cen X-3
186.4468 -62.8789    4.3  40.8 -136.2   2.2730   2.7    8.7	GX 301-2
255.8292 -37.9091    4.2  26.9  -45.9   1.4040   2.8    8.4	4U 1700-377
256.5098 -36.3616    4.1  28.0  -43.4   1.4356   2.8    5.1	GX 349+2
263.1889 -24.6486    7.6  37.2  -26.0   0.9559   1.5   11.4	GX 1+4
264.6508 -44.5007   24.7  18.0  -37.9   0.2121   0.5    5.0	4U 1735-44
268.4445  -1.4074   13.6  59.3  -13.7  -1.4416  -0.8    5.3	SW J1753.5-0127
270.3370 -25.0436    4.8  35.6  -15.4   1.3332   2.4    3.6	GX 5-1
270.2104 -25.6650    5.3  35.0  -15.8   1.2113   2.2    6.8	GRS 1758-258
273.8954 -14.1825    3.1  46.0   -8.5   2.7532   3.7   10.9	GX 17+2
275.8699 -30.4377   16.9  29.7   -7.5   0.3449   0.7    5.1	H1820-303
285.1004 -24.8919    7.8  35.3    7.8  -0.8993  -1.5    3.9	HT1900.1-2455
262.7772 -33.9459   43.9  28.4  -31.4  -0.1343  -0.3   12.5	GX 354-0
325.0609 -42.5640    2.6  32.2   77.6   4.2921   4.5 ------	UNKNOWN
294.8601 -22.9468    2.4  38.5   22.1   3.4933   4.8 ------	UNKNOWN
 91.7297 -64.1446    2.0  55.7  175.4   8.5242   5.7 ------	UNKNOWN
276.7153 -21.4308    4.2  38.6   -5.2   1.6840   2.7 ------	UNKNOWN
Pre-slew background subtracted image of 15-350 keV band
Time interval of the image:
-5.576000 48.424000

# RAcent  DECcent POSerr Theta    Phi  PeakCts   SNR AngSep     Name
#  [deg]    [deg]    ['] [deg]  [deg]                   [']
170.7089 -60.5029    0.0  47.8 -141.4  -0.4049  -1.4   13.6	Cen X-3
186.6003 -62.7057    3.4  40.9 -135.9   0.6949   3.4    4.2	GX 301-2
256.2289 -37.7498    0.0  26.9  -45.1   0.0154   0.1   12.8	4U 1700-377
256.2069 -36.5012    3.7  28.0  -44.0   0.3830   3.1   12.0	GX 349+2
262.9521 -24.5930    2.3  37.3  -26.3  -0.7200  -4.9    9.7	GX 1+4
264.8526 -44.3928    3.5  18.1  -37.3   0.3827   3.3    5.8	4U 1735-44
268.4089  -1.4010   43.7  59.3  -13.8   0.2040   0.3    3.9	SW J1753.5-0127
270.2134 -25.1854    6.8  35.5  -15.6   0.2266   1.7    7.4	GX 5-1
270.4712 -25.6062    0.0  35.0  -15.3   0.1873   1.5   12.3	GRS 1758-258
273.9432 -14.1838   10.5  46.0   -8.4  -0.2021  -1.1    9.6	GX 17+2
275.7600 -30.5110    0.0  29.6   -7.7  -0.1539  -1.3   12.1	H1820-303
285.1490 -24.9895    4.4  35.2    7.9   0.3679   2.6    7.4	HT1900.1-2455
262.8775 -33.9660    7.0  28.3  -31.2  -0.1982  -1.6    9.6	GX 354-0
329.5701 -35.4734    2.4  39.9   74.7   2.0549   4.8 ------	UNKNOWN
304.7794 -40.8048    0.9  24.6   49.5   1.6236  12.8 ------	UNKNOWN
 11.3935 -77.8240    2.4  32.5  156.6   0.7059   4.9 ------	UNKNOWN
Post-slew image of 15-350 keV band
Time interval of the image:
133.124600 715.224590

# RAcent  DECcent POSerr Theta    Phi  PeakCts   SNR AngSep     Name
#  [deg]    [deg]    ['] [deg]  [deg]                   [']
255.8820 -37.9493   88.7  37.4  -83.1   0.2789   0.1    8.0	4U 1700-377
256.2892 -36.2810    0.0  37.7  -80.3   2.4687   1.2   11.1	GX 349+2
262.8704 -24.8379    6.8  38.2  -59.5   2.7729   1.7    9.4	GX 1+4
264.5629 -44.2974    0.0  29.5  -91.4  -2.9410  -2.5   12.0	4U 1735-44
268.3941  -1.4115    4.9  51.3  -30.5  -5.3628  -2.4    2.9	SW J1753.5-0127
270.1848 -25.2218    6.4  32.6  -53.3   1.9385   1.8   10.1	GX 5-1
270.4309 -25.8704    6.9  32.1  -54.0   1.7537   1.7   10.3	GRS 1758-258
274.1408 -14.0075    5.6  37.8  -34.8   2.3829   2.1    8.0	GX 17+2
275.9271 -30.3727  170.7  25.5  -56.1   0.0644   0.1    0.4	H1820-303
284.8652 -24.7995    0.0  23.0  -33.2  -1.2518  -1.4   11.8	HT1900.1-2455
288.8820  10.9225    4.5  53.8   -0.5   4.4374   2.6    5.1	GRS 1915+105
262.7850 -33.9478  318.7  33.7  -73.1   0.0540   0.0   12.2	GX 354-0
349.3363 -23.6960    1.9  40.8   98.2  12.7558   5.9 ------	UNKNOWN
333.7551 -20.0446    2.7  32.2   77.6   7.3870   4.3 ------	UNKNOWN
328.5878 -19.2106    3.1  29.6   69.4   5.4628   3.7 ------	UNKNOWN
297.4153 -31.6355    2.9  10.9  -16.3   3.2186   4.1 ------	UNKNOWN
Plot creation:
Sat Oct 19 18:13:42 EDT 2024