Estimated redshift from machine learning (Ukwatta et al. 2016) - may take a few minute to calcaulte
Image
Pre-slew 15.0-350.0 keV image (Event data)

#   RAcent    DECcent   POSerr    Theta     Phi              Peak Cts       SNR   Name
   16.5778   -22.6590   0.0129    12.9581    44.4324         0.2599419     14.881 TRIG_01267501

Foreground time interval of the image:
 -0.020   2.188 (delta_t =   2.208 [sec])
Background time interval of the image:
-239.320  -0.020 (delta_t = 239.300 [sec])
Lightcurves
Notes:
- 1) The mask-weighted light curves are using the flight position.
- 2) Multiple plots of different time binning/intervals are shown to cover all scenarios of short/long GRBs, rate/image triggers, and real/false positives.
- 3) For all the mask-weighted lightcurves, the y-axis units are counts/sec/det where a det is 0.4 x 0.4 = 0.16 sq cm.
- 4) The verticle lines correspond to following: green dotted lines are T50 interval, black dotted lines are T90 interval, blue solid line(s) is a spacecraft slew start time, and orange solid line(s) is a spacecraft slew end time.
- 5) Time of each bin is in the middle of the bin.
1 s binning
From T0-310 s to T0+310 s
From T100_start - 20 s to T100_end + 30 s
Full time interval

64 ms binning
Full time interval
From T100_start to T100_end
From T0-5 sec to T0+5 sec
16 ms binning
From T100_start-5 s to T100_start+5 s
Blue+Cyan dotted lines: Time interval of the scaled map
From 0.000000 to 0.512000
8 ms binning
From T100_start-3 s to T100_start+3 s
Blue+Cyan dotted lines: Time interval of the scaled map
From 0.000000 to 0.512000
2 ms binning
From T100_start-1 s to T100_start+1 s

Blue+Cyan dotted lines: Time interval of the scaled map
From 0.000000 to 0.512000
SN=5 or 10 sec. binning (whichever binning is satisfied first)

SN=5 or 10 sec. binning (T < 200 sec)
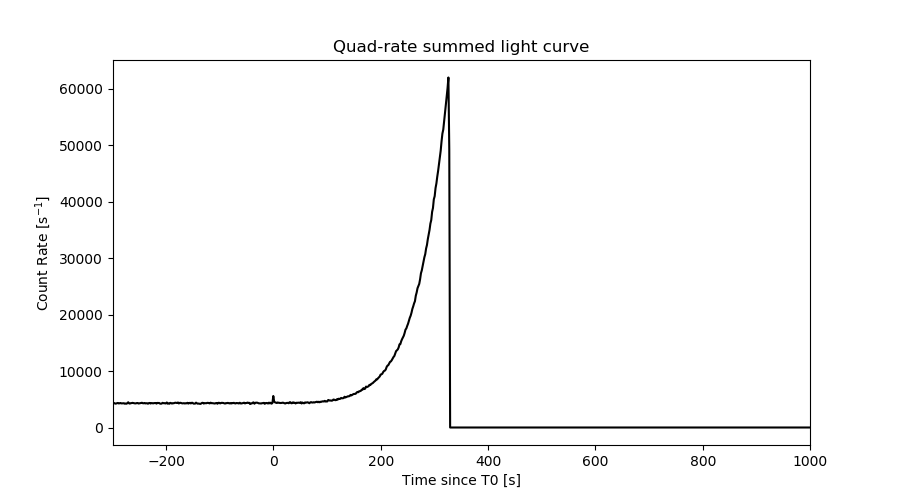
Quad-rate summed light curves (from T0-300s to T0+1000s)
Spectral Evolution

Spectra
Notes:
- 1) The fitting includes the systematic errors.
- 2) When the burst includes telescope slew time periods, the fitting uses an average response file made from multiple 5-s response files through out the slew time plus single time preiod for the non-slew times, and weighted by the total counts in the corresponding time period using addrmf. An average response file is needed becuase a spectral fit using the pre-slew DRM will introduce some errors in both a spectral shape and a normalization if the PHA file contains a lot of the slew/post-slew time interval.
- 3) For fits to more complicated models (e.g. a power-law over a cutoff power-law), the BAT team has decided to require a chi-square improvement of more than 6 for each extra dof.
Time averaged spectrum fit using the average DRM
Power-law model
Time interval is from   -0.020 sec. to    2.188 sec.

Spectral model in power-law:
------------------------------------------------------------
Parameters  : value       lower 90%   higher 90%
Photon index: 1.80742     ( -0.226591   0.237964 )
Norm@50keV  : 6.27370E-03    ( -0.000895979   0.000864851 )
------------------------------------------------------------
#Fit statistic  : Chi-Squared                   50.93     using 59 bins.
 Reduced chi-squared = 0.893509
# Null hypothesis probability of 7.01e-01 with 57 degrees of freedom

Photon flux (15-150 keV)    in 2.208 sec: 0.867048 ( -0.100758  0.100803 ) ph/cm2/s
Energy fluence (15-150 keV)             : 1.27511e-07 ( -1.8194e-08  1.85782e-08 ) ergs/cm2
Cutoff power-law model
Time interval is from   -0.020 sec. to    2.188 sec.
Spectral model in the cutoff power-law:
------------------------------------------------------------
Parameters  : value       lower 90%   higher 90%
Photon index: 2.30872     ( -0.777236   0.132784 )
Epeak [keV] : 114.390      (   )
Norm@50keV  : 3.54649E-03    (     )
------------------------------------------------------------
#Fit statistic  : Chi-Squared                   49.71     using 59 bins.
 Reduced chi-squared = 0.887679
# Null hypothesis probability of 7.10e-01 with 56 degrees of freedom

Photon flux (15-150 keV)    in 2.208 sec: 0.692381 ( -0.148593  0.176054 ) ph/cm2/s
Energy fluence (15-150 keV)             : 1.12331e-07 ( -2.28771e-08  1.95795e-08 ) ergs/cm2
Band function

Time interval is from   -0.020 sec. to    2.188 sec.


Spectral model in the Band function:
------------------------------------------------------------
Parameters  : value       lower 90%   higher 90%
alpha       :    (     )
beta        :     (     )
Epeak [keV] :       (   )
Norm@50keV   :     (     )
------------------------------------------------------------

Photon flux (15-150 keV)    in  sec:  (    ) ph/cm2/s
Energy fluence (15-150 keV)             : 0 ( 0  0 ) ergs/cm2
Single BB
Spectral model blackbody:
------------------------------------------------------------
Parameters  : value    Lower 90%  Upper 90%
kT [keV]    : 11.0592  (-2.04137  2.67255)
R^2/D10^2   : 0.264795  (-0.141532   0.299101)
(R is the radius in km and D10 is the distance to the source in units of 10 kpc)
------------------------------------------------------------
#Fit statistic  : Chi-Squared                   84.86     using 59 bins.
 Reduced chi-squared =
# Null hypothesis probability of 9.76e-03 with 57 degrees of freedom

Energy  Fluence     90% Error
[keV]   [erg/cm2]   [erg/cm2]
15- 25  1.496e-08   3.210e-09
25- 50  4.259e-08   6.834e-09
50-150  2.954e-08   9.349e-09
15-150  8.708e-08   1.624e-08
Thermal bremsstrahlung (OTTB)
Spectral model: thermal bremsstrahlung
------------------------------------------------------------
Parameters  : value         Lower 90%    Upper 90%
kT [keV]    : 114.870       (-46.4269      -114.034)
Norm        : 3.66471       (-0.480895     0.750092)
------------------------------------------------------------
#Fit statistic  : Chi-Squared                   54.34     using 59 bins.
 Reduced chi-squared =
# Null hypothesis probability of 5.75e-01 with 57 degrees of freedom

Energy  Fluence     90% Error
[keV]   [erg/cm2]   [erg/cm2]
15- 25  2.111e-08   3.570e-09
25- 50  3.747e-08   7.938e-09
50-150  6.543e-08   3.592e-08
15-150  1.240e-07   4.105e-08
Double BB

Spectral model: bbodyrad<1> + bbodyrad<2>
------------------------------------------------------------
Parameters  : value         Lower 90%    Upper 90%
kT1 [keV]   : 4.86508        (-1.20126      1.56005)
R1^2/D10^2  : 4.79811        (-3.22832      12.3604)
kT2 [keV]   : 24.5244        (-6.39534      12.5285)
R2^2/D10^2  : 1.27121E-02    (-0.00933524   0.0137412)
------------------------------------------------------------
#Fit statistic  : Chi-Squared                   49.45     using 59 bins.
 Reduced chi-squared =
# Null hypothesis probability of 6.86e-01 with 55 degrees of freedom

Energy  Fluence     90% Error
[keV]   [erg/cm2]   [erg/cm2]
15- 25  2.603e-08   1.324e-08
25- 50  3.071e-08   1.206e-08
50-150  7.490e-08   4.268e-08
15-150  1.316e-07   4.989e-08
Peak spectrum fit
Power-law model
Time interval is from   -0.020 sec. to    0.980 sec.

Spectral model in power-law:
------------------------------------------------------------
Parameters  : value       lower 90%   higher 90%
Photon index: 1.65293     ( -0.201765   0.208507 )
Norm@50keV  : 1.08713E-02    ( -0.00134321   0.00131497 )
------------------------------------------------------------
#Fit statistic  : Chi-Squared                   45.06     using 59 bins.
 Reduced chi-squared = 0.790526
# Null hypothesis probability of 8.74e-01 with 57 degrees of freedom

Photon flux (15-150 keV)    in 1 sec: 1.42095 ( -0.15708  0.15722 ) ph/cm2/s
Energy fluence (15-150 keV)             : 1.01093e-07 ( -1.32535e-08  1.34451e-08 ) ergs/cm2
Cutoff power-law model

Time interval is from   -0.020 sec. to    0.980 sec.
Spectral model in the cutoff power-law:
------------------------------------------------------------
Parameters  : value       lower 90%   higher 90%
Photon index: 1.64896     ( -0.570093   0.210783 )
Epeak [keV] : 9999.09      ( -9999.32 -9999.33 )
Norm@50keV  : 1.08955E-02    ( -0.00680552   0.0103005 )
------------------------------------------------------------
#Fit statistic  : Chi-Squared                   45.06     using 59 bins.
 Reduced chi-squared = 0.804643
# Null hypothesis probability of 8.52e-01 with 56 degrees of freedom

Photon flux (15-150 keV)    in 1 sec: 1.05186 ( -0.305792  0.28555 ) ph/cm2/s
Energy fluence (15-150 keV)             : 1.01503e-07 ( -1.47769e-08  1.39858e-08 ) ergs/cm2
Band function

Time interval is from   -0.020 sec. to    0.980 sec.


Spectral model in the Band function:
------------------------------------------------------------
Parameters  : value       lower 90%   higher 90%
alpha       :    (     )
beta        :     (     )
Epeak [keV] :       (   )
Norm@50keV   :     (     )
------------------------------------------------------------

Photon flux (15-150 keV)    in  sec:  (    ) ph/cm2/s
Energy fluence (15-150 keV)             : 0 ( 0  0 ) ergs/cm2
Single BB
Spectral model blackbody:
------------------------------------------------------------
Parameters  : value    Lower 90%  Upper 90%
kT [keV]    : 13.3243  (-2.31948  2.82324)
R^2/D10^2   : 0.230269  (-0.1113   0.223564)
(R is the radius in km and D10 is the distance to the source in units of 10 kpc)
------------------------------------------------------------
#Fit statistic  : Chi-Squared                   78.06     using 59 bins.
 Reduced chi-squared =
# Null hypothesis probability of 3.35e-02 with 57 degrees of freedom

Energy  Fluence     90% Error
[keV]   [erg/cm2]   [erg/cm2]
15- 25  8.665e-09   1.827e-09
25- 50  3.064e-08   4.780e-09
50-150  3.487e-08   9.465e-09
15-150  7.418e-08   1.120e-08
Thermal bremsstrahlung (OTTB)

Spectral model: thermal bremsstrahlung
------------------------------------------------------------
Parameters  : value         Lower 90%    Upper 90%
kT [keV]    : 162.157       (-67.3337      -161.869)
Norm        : 5.81204       (-0.692099     0.829568)
------------------------------------------------------------
#Fit statistic  : Chi-Squared                   46.56     using 59 bins.
 Reduced chi-squared =
# Null hypothesis probability of 8.37e-01 with 57 degrees of freedom

Energy  Fluence     90% Error
[keV]   [erg/cm2]   [erg/cm2]
15- 25  1.482e-08   7.870e-09
25- 50  2.778e-08   1.324e-08
50-150  5.657e-08   3.229e-08
15-150  9.916e-08   5.061e-08
Double BB
Spectral model: bbodyrad<1> + bbodyrad<2>
------------------------------------------------------------
Parameters  : value         Lower 90%    Upper 90%
kT1 [keV]   : 5.41390        (-1.35478      1.65911)
R1^2/D10^2  : 4.50329        (-2.87937      12.4247)
kT2 [keV]   : 25.3449        (-5.84578      10.5025)
R2^2/D10^2  : 2.00958E-02    (-0.0137041   0.0307421)
------------------------------------------------------------
#Fit statistic  : Chi-Squared                   43.15     using 59 bins.
 Reduced chi-squared =
# Null hypothesis probability of 8.77e-01 with 55 degrees of freedom

Energy  Fluence     90% Error
[keV]   [erg/cm2]   [erg/cm2]
15- 25  1.712e-08   8.535e-09
25- 50  2.450e-08   8.929e-09
50-150  6.114e-08   3.225e-08
15-150  1.028e-07   3.811e-08
Pre-slew spectrum (Pre-slew PHA with pre-slew DRM)
Power-law model

Spectral model in power-law:
------------------------------------------------------------
Parameters  : value       lower 90%   higher 90%
Photon index: 1.80742     ( -0.226591   0.237964 )
Norm@50keV  : 6.27370E-03    ( -0.000895979   0.000864851 )
------------------------------------------------------------
#Fit statistic  : Chi-Squared                   50.93     using 59 bins.
 Reduced chi-squared =
# Null hypothesis probability of 7.01e-01 with 57 degrees of freedom

Photon flux (15-150 keV)    in 2.208 sec: 0.867003 ( -0.100751  0.100795 ) ph/cm2/s
Energy fluence (15-150 keV)             : 1.27494e-07 ( -1.81908e-08  1.8572e-08 ) ergs/cm2
Cutoff power-law model
Spectral model in the cutoff power-law:
------------------------------------------------------------
Parameters  : value       lower 90%   higher 90%
Photon index: 2.58980     ( -1.10508   0.238633 )
Epeak [keV] : 197.529      (   )
Norm@50keV  : 2.66905E-03    (     )
------------------------------------------------------------
#Fit statistic  : Chi-Squared                   50.05     using 59 bins.
 Reduced chi-squared =
# Null hypothesis probability of 6.98e-01 with 56 degrees of freedom

Photon flux (15-150 keV)    in 2.208 sec: 0.867733 ( -0.101367  0.100358 ) ph/cm2/s
Energy fluence (15-150 keV)             : 1.27776e-07 ( -1.84955e-08  1.81036e-08 ) ergs/cm2
Band function
Spectral model in the Band function:
------------------------------------------------------------
Parameters  : value       lower 90%   higher 90%
alpha       :    (     )
beta        :     (     )
Epeak [keV] :       (   )
Norm@50keV   :     (     )
------------------------------------------------------------

Photon flux (15-150 keV)    in  sec:  (    ) ph/cm2/s
Energy fluence (15-150 keV)             : 0 ( 0  0 ) ergs/cm2
S(25-50 keV) vs. S(50-100 keV) plot
S(25-50 keV)  = 3.60e-08
S(50-100 keV) = 4.11e-08
T90 vs. Hardness ratio plot
T90                                   = 1.87199985980988 sec.
Hardness ratio (energy fluence ratio) = 1.14167
Color vs. Color plot

Count Ratio  (25-50 keV) / (15-25 keV) = 0.912437
Count Ratio (50-100 keV) / (15-25 keV) = 0.578175
Mask shadow pattern

IMX = 1.643081713956925E-01, IMY = -1.610843671840437E-01
TIME vs. PHA plot around the trigger time
Blue+Cyan dotted lines: Time interval of the scaled map
From 0.000000 to 0.512000
TIME vs. DetID plot around the trigger time
Blue+Cyan dotted lines: Time interval of the scaled map
From 0.000000 to 0.512000
100 us light curve (15-350 keV)
Blue+Cyan dotted lines: Time interval of the scaled map
From 0.000000 to 0.512000
Spacecraft aspect plot
Bright source in the pre-burst/pre-slew/post-slew images
Pre-burst image of 15-350 keV band
Time interval of the image:
-239.320000 -0.020000

# RAcent  DECcent POSerr Theta    Phi  PeakCts   SNR AngSep     Name
#  [deg]    [deg]    ['] [deg]  [deg]                   [']
 28.7962  -3.7142    3.4  32.2   77.5   2.1292   3.4 ------	UNKNOWN
  9.9962 -38.9569    2.6   9.6  -54.7   1.3749   4.5 ------	UNKNOWN
 49.2422 -51.2987    2.3  26.0 -159.9   1.5059   5.0 ------	UNKNOWN
Pre-slew background subtracted image of 15-350 keV band
Time interval of the image:
-0.020000 2.188000

# RAcent  DECcent POSerr Theta    Phi  PeakCts   SNR AngSep     Name
#  [deg]    [deg]    ['] [deg]  [deg]                   [']
 25.4646 -20.4193    2.1  15.2   79.1   0.0984   5.4 ------	UNKNOWN
 16.5778 -22.6590    0.8  13.0   44.4   0.2599  14.9 ------	UNKNOWN
336.8098   1.5721    2.3  55.1    4.6   0.3731   5.0 ------	UNKNOWN
Post-slew image of 15-350 keV band
Time interval of the image:
59.580600 311.951300
312.680000 362.860000

# RAcent  DECcent POSerr Theta    Phi  PeakCts   SNR AngSep     Name
#  [deg]    [deg]    ['] [deg]  [deg]                   [']
356.0824  26.1464    2.8  52.7   26.4  62.8968   4.1 ------	UNKNOWN
343.8369  17.0664    3.3  51.0    8.0  30.9678   3.5 ------	UNKNOWN
336.8878  18.9100    3.5  56.8    3.5  54.7838   3.3 ------	UNKNOWN
Plot creation:
Wed Dec 18 17:41:36 EST 2024