Estimated redshift from machine learning (Ukwatta et al. 2016) - may take a few minute to calcaulte
Image
Pre-slew 15.0-350.0 keV image (Event data)

#   RAcent    DECcent   POSerr    Theta     Phi              Peak Cts       SNR   Name
  190.1030    -2.8870   0.0052    26.8836    37.4443         4.1253786     37.300 TRIG_01273106

Foreground time interval of the image:
-15.120  15.181 (delta_t =  30.301 [sec])
Background time interval of the image:
-239.120 -15.120 (delta_t = 224.000 [sec])
Lightcurves
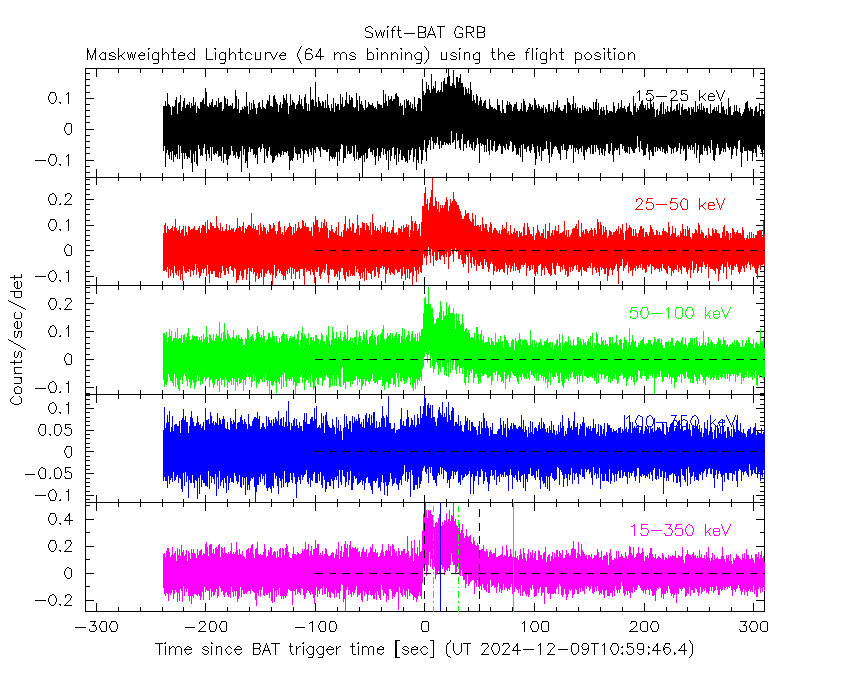
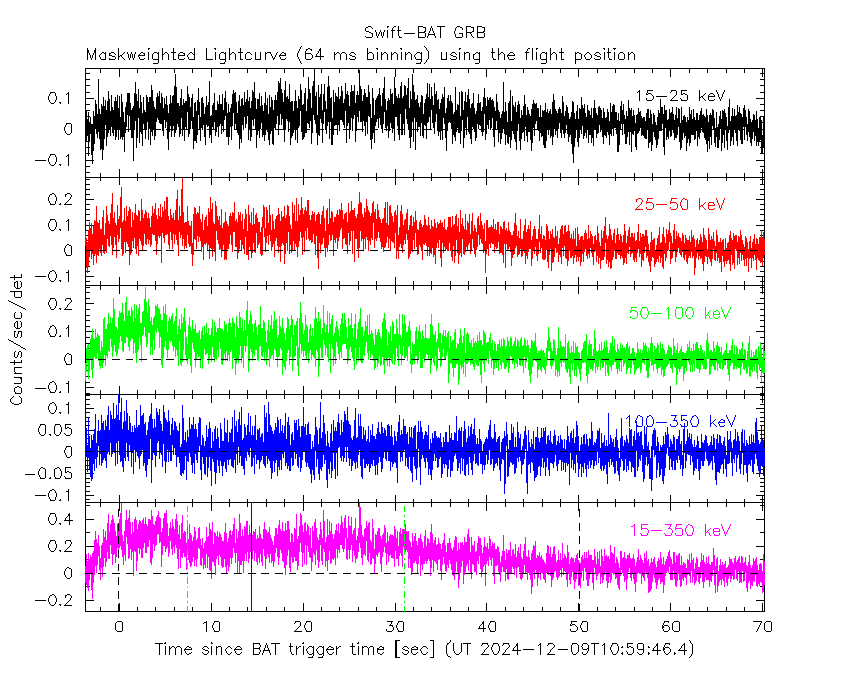
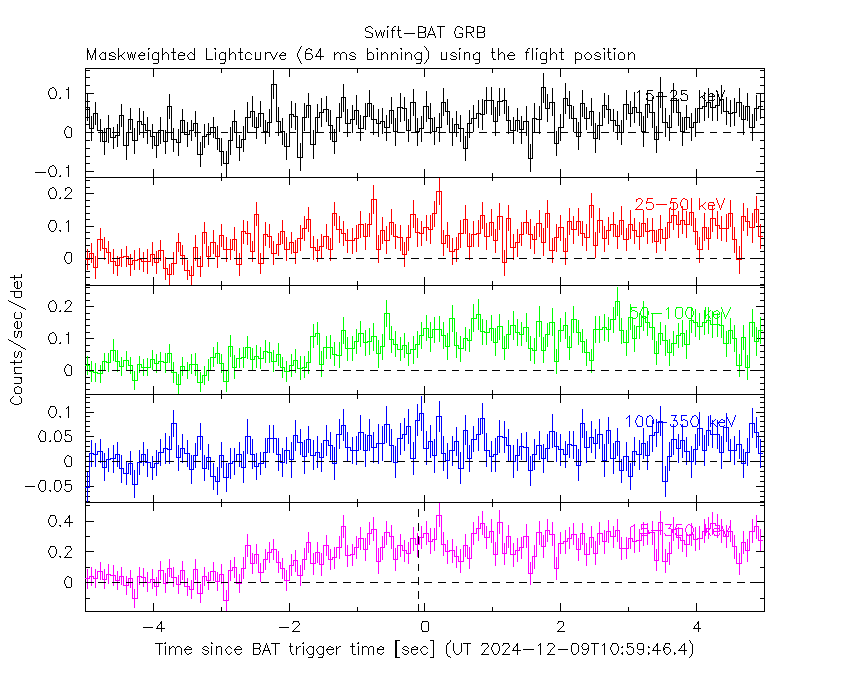
Notes:
- 1) The mask-weighted light curves are using the flight position.
- 2) Multiple plots of different time binning/intervals are shown to cover all scenarios of short/long GRBs, rate/image triggers, and real/false positives.
- 3) For all the mask-weighted lightcurves, the y-axis units are counts/sec/det where a det is 0.4 x 0.4 = 0.16 sq cm.
- 4) The verticle lines correspond to following: green dotted lines are T50 interval, black dotted lines are T90 interval, blue solid line(s) is a spacecraft slew start time, and orange solid line(s) is a spacecraft slew end time.
- 5) Time of each bin is in the middle of the bin.
1 s binning
From T0-310 s to T0+310 s

From T100_start - 20 s to T100_end + 30 s
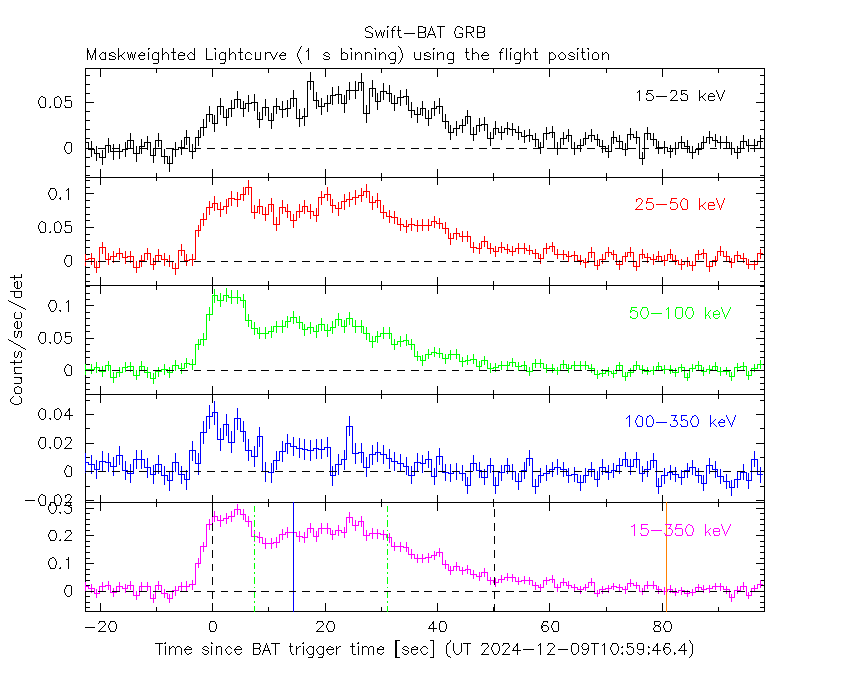
Full time interval

64 ms binning
Full time interval
From T100_start to T100_end
From T0-5 sec to T0+5 sec
16 ms binning
From T100_start-5 s to T100_start+5 s

Blue+Cyan dotted lines: Time interval of the scaled map
From 0.000000 to 1.024000
8 ms binning
From T100_start-3 s to T100_start+3 s

Blue+Cyan dotted lines: Time interval of the scaled map
From 0.000000 to 1.024000
2 ms binning
From T100_start-1 s to T100_start+1 s

Blue+Cyan dotted lines: Time interval of the scaled map
From 0.000000 to 1.024000
SN=5 or 10 sec. binning (whichever binning is satisfied first)

SN=5 or 10 sec. binning (T < 200 sec)

Quad-rate summed light curves (from T0-300s to T0+1000s)

Spectral Evolution

Spectra
Notes:
- 1) The fitting includes the systematic errors.
- 2) When the burst includes telescope slew time periods, the fitting uses an average response file made from multiple 5-s response files through out the slew time plus single time preiod for the non-slew times, and weighted by the total counts in the corresponding time period using addrmf. An average response file is needed becuase a spectral fit using the pre-slew DRM will introduce some errors in both a spectral shape and a normalization if the PHA file contains a lot of the slew/post-slew time interval.
- 3) For fits to more complicated models (e.g. a power-law over a cutoff power-law), the BAT team has decided to require a chi-square improvement of more than 6 for each extra dof.
Time averaged spectrum fit using the average DRM
Power-law model

Time interval is from  -15.120 sec. to   64.880 sec.

Spectral model in power-law:
------------------------------------------------------------
Parameters  : value       lower 90%   higher 90%
Photon index: 1.45122     ( -0.0471175   0.0471154 )
Norm@50keV  : 8.64605E-03    ( -0.000224301   0.000224296 )
------------------------------------------------------------
#Fit statistic  : Chi-Squared                   85.62     using 59 bins.
 Reduced chi-squared = 1.50211
# Null hypothesis probability of 8.42e-03 with 57 degrees of freedom

Photon flux (15-150 keV)    in 80 sec: 1.06585 ( -0.02997  0.03004 ) ph/cm2/s
Energy fluence (15-150 keV)             : 6.6182e-06 ( -1.8229e-07  1.82756e-07 ) ergs/cm2
Cutoff power-law model

Time interval is from  -15.120 sec. to   64.880 sec.
Spectral model in the cutoff power-law:
------------------------------------------------------------
Parameters  : value       lower 90%   higher 90%
Photon index: 0.874078     ( -0.213192   0.203585 )
Epeak [keV] : 106.093      ( -14.9112 28.2902 )
Norm@50keV  : 1.59799E-02    ( -0.00304008   0.00395268 )
------------------------------------------------------------
#Fit statistic  : Chi-Squared                   60.31     using 59 bins.
 Reduced chi-squared = 1.07696
# Null hypothesis probability of 3.23e-01 with 56 degrees of freedom

Photon flux (15-150 keV)    in 80 sec: 1.02640 ( -0.032496  0.03259 ) ph/cm2/s
Energy fluence (15-150 keV)             : 6.3772e-06 ( -2.02157e-07  2.0165e-07 ) ergs/cm2
Band function

Time interval is from  -15.120 sec. to   64.880 sec.


Spectral model in the Band function:
------------------------------------------------------------
Parameters  : value       lower 90%   higher 90%
alpha       :    (     )
beta        :     (     )
Epeak [keV] :       (   )
Norm@50keV   :     (     )
------------------------------------------------------------

Photon flux (15-150 keV)    in  sec:  (    ) ph/cm2/s
Energy fluence (15-150 keV)             : 0 ( 0  0 ) ergs/cm2
Single BB

Spectral model blackbody:
------------------------------------------------------------
Parameters  : value    Lower 90%  Upper 90%
kT [keV]    : 16.8708  (  )
R^2/D10^2   : 8.03613E-02  (   )
(R is the radius in km and D10 is the distance to the source in units of 10 kpc)
------------------------------------------------------------
#Fit statistic  : Chi-Squared                  270.18     using 59 bins.
 Reduced chi-squared =
# Null hypothesis probability of 1.83e-29 with 57 degrees of freedom

Energy  Fluence     90% Error
[keV]   [erg/cm2]   [erg/cm2]
15- 25  3.734e-07   1.744e-08
25- 50  1.642e-06   6.040e-08
50-150  3.329e-06   1.500e-07
15-150  5.345e-06   1.696e-07
Thermal bremsstrahlung (OTTB)

Spectral model: thermal bremsstrahlung
------------------------------------------------------------
Parameters  : value         Lower 90%    Upper 90%
kT [keV]    : 200.000       (-6.69312      -200)
Norm        : 4.42103       (-0.114637     0.114637)
------------------------------------------------------------
#Fit statistic  : Chi-Squared                   85.12     using 59 bins.
 Reduced chi-squared =
# Null hypothesis probability of 9.28e-03 with 57 degrees of freedom

Energy  Fluence     90% Error
[keV]   [erg/cm2]   [erg/cm2]
15- 25  8.809e-07   2.680e-08
25- 50  1.694e-06   4.600e-08
50-150  3.716e-06   1.084e-07
15-150  6.292e-06   1.880e-07
Double BB

Spectral model: bbodyrad<1> + bbodyrad<2>
------------------------------------------------------------
Parameters  : value         Lower 90%    Upper 90%
kT1 [keV]   : 7.75544        (-0.876558      0.963232)
R1^2/D10^2  : 0.655796        (-0.197287      0.313257)
kT2 [keV]   : 25.9031        (-2.27317      3.08305)
R2^2/D10^2  : 1.43608E-02    (-0.00500008   0.00613851)
------------------------------------------------------------
#Fit statistic  : Chi-Squared                   60.58     using 59 bins.
 Reduced chi-squared =
# Null hypothesis probability of 2.82e-01 with 55 degrees of freedom

Energy  Fluence     90% Error
[keV]   [erg/cm2]   [erg/cm2]
15- 25  6.884e-07   6.660e-08
25- 50  1.682e-06   1.028e-07
50-150  3.971e-06   3.068e-07
15-150  6.341e-06   3.756e-07
Peak spectrum fit
Power-law model

Time interval is from    8.380 sec. to    9.380 sec.

Spectral model in power-law:
------------------------------------------------------------
Parameters  : value       lower 90%   higher 90%
Photon index: 1.47461     ( -0.235545   0.241994 )
Norm@50keV  : 1.18151E-02    ( -0.00189051   0.00187467 )
------------------------------------------------------------
#Fit statistic  : Chi-Squared                   57.98     using 59 bins.
 Reduced chi-squared = 1.01719
# Null hypothesis probability of 4.39e-01 with 57 degrees of freedom

Photon flux (15-150 keV)    in 1 sec: 1.46518 ( -0.22561  0.22574 ) ph/cm2/s
Energy fluence (15-150 keV)             : 1.12582e-07 ( -1.95441e-08  1.98064e-08 ) ergs/cm2
Cutoff power-law model

Time interval is from    8.380 sec. to    9.380 sec.
Spectral model in the cutoff power-law:
------------------------------------------------------------
Parameters  : value       lower 90%   higher 90%
Photon index: -9.18361E-03     ( -1.46189   1.10763 )
Epeak [keV] : 65.6412      ( -14.3523 53.5449 )
Norm@50keV  : 7.00599E-02    ( -0.0700599   0.329264 )
------------------------------------------------------------
#Fit statistic  : Chi-Squared                   52.38     using 59 bins.
 Reduced chi-squared = 0.935357
# Null hypothesis probability of 6.13e-01 with 56 degrees of freedom

Photon flux (15-150 keV)    in 1 sec: 1.41956 ( -0.22771  0.22827 ) ph/cm2/s
Energy fluence (15-150 keV)             : 1.03727e-07 ( -2.0003e-08  2.08621e-08 ) ergs/cm2
Band function

Time interval is from    8.380 sec. to    9.380 sec.


Spectral model in the Band function:
------------------------------------------------------------
Parameters  : value       lower 90%   higher 90%
alpha       :    (     )
beta        :     (     )
Epeak [keV] :       (   )
Norm@50keV   :     (     )
------------------------------------------------------------

Photon flux (15-150 keV)    in  sec:  (    ) ph/cm2/s
Energy fluence (15-150 keV)             : 0 ( 0  0 ) ergs/cm2
Single BB

Spectral model blackbody:
------------------------------------------------------------
Parameters  : value    Lower 90%  Upper 90%
kT [keV]    : 14.5380  (-2.19751  2.62817)
R^2/D10^2   : 0.203064  (-0.0907071   0.156476)
(R is the radius in km and D10 is the distance to the source in units of 10 kpc)
------------------------------------------------------------
#Fit statistic  : Chi-Squared                   55.29     using 59 bins.
 Reduced chi-squared =
# Null hypothesis probability of 5.40e-01 with 57 degrees of freedom

Energy  Fluence     90% Error
[keV]   [erg/cm2]   [erg/cm2]
15- 25  9.027e-09   2.563e-09
25- 50  3.483e-08   7.345e-09
50-150  4.939e-08   1.421e-08
15-150  9.324e-08   1.929e-08
Thermal bremsstrahlung (OTTB)

Spectral model: thermal bremsstrahlung
------------------------------------------------------------
Parameters  : value         Lower 90%    Upper 90%
kT [keV]    : 199.363       (-91.212      -199.363)
Norm        : 6.07543       (-0.922317     0.922462)
------------------------------------------------------------
#Fit statistic  : Chi-Squared                   56.05     using 59 bins.
 Reduced chi-squared =
# Null hypothesis probability of 5.11e-01 with 57 degrees of freedom

Energy  Fluence     90% Error
[keV]   [erg/cm2]   [erg/cm2]
15- 25  1.513e-08   8.640e-09
25- 50  2.910e-08   1.618e-08
50-150  6.383e-08   3.612e-08
15-150  1.081e-07   6.115e-08
Double BB

Spectral model: bbodyrad<1> + bbodyrad<2>
------------------------------------------------------------
Parameters  : value         Lower 90%    Upper 90%
kT1 [keV]   : 8.36951        (-8.33821      -8.39865)
R1^2/D10^2  : 0.665933        (-0.575337      -0.663076)
kT2 [keV]   : 21.0716        (-21.1123      -21.1124)
R2^2/D10^2  : 3.83776E-02    (-0.0376217   0.170387)
------------------------------------------------------------
#Fit statistic  : Chi-Squared                   52.01     using 59 bins.
 Reduced chi-squared =
# Null hypothesis probability of 5.90e-01 with 55 degrees of freedom

Energy  Fluence     90% Error
[keV]   [erg/cm2]   [erg/cm2]
15- 25  1.192e-08   6.930e-09
25- 50  3.301e-08   1.876e-08
50-150  5.981e-08   3.485e-08
15-150  1.047e-07   5.370e-08
Pre-slew spectrum (Pre-slew PHA with pre-slew DRM)
Power-law model

Spectral model in power-law:
------------------------------------------------------------
Parameters  : value       lower 90%   higher 90%
Photon index: 1.07745     ( -0.0655463   0.0649345 )
Norm@50keV  : 9.35416E-03    ( -0.000357033   0.000356656 )
------------------------------------------------------------
#Fit statistic  : Chi-Squared                   69.79     using 59 bins.
 Reduced chi-squared =
# Null hypothesis probability of 1.19e-01 with 57 degrees of freedom

Photon flux (15-150 keV)    in 30.3 sec: 1.08277 ( -0.0427481  0.042814 ) ph/cm2/s
Energy fluence (15-150 keV)             : 2.98501e-06 ( -1.20423e-07  1.2063e-07 ) ergs/cm2
Cutoff power-law model

Spectral model in the cutoff power-law:
------------------------------------------------------------
Parameters  : value       lower 90%   higher 90%
Photon index: 0.450344     ( -0.299788   0.28024 )
Epeak [keV] : 141.714      ( -28.0072 66.0161 )
Norm@50keV  : 1.77633E-02    ( -0.00431033   0.00609579 )
------------------------------------------------------------
#Fit statistic  : Chi-Squared                   54.03     using 59 bins.
 Reduced chi-squared =
# Null hypothesis probability of 5.50e-01 with 56 degrees of freedom

Photon flux (15-150 keV)    in 30.3 sec: 1.05331 ( -0.04456  0.0446 ) ph/cm2/s
Energy fluence (15-150 keV)             : 2.89953e-06 ( -1.29269e-07  1.28539e-07 ) ergs/cm2
Band function

Spectral model in the Band function:
------------------------------------------------------------
Parameters  : value       lower 90%   higher 90%
alpha       :    (     )
beta        :     (     )
Epeak [keV] :       (   )
Norm@50keV   :     (     )
------------------------------------------------------------

Photon flux (15-150 keV)    in  sec:  (    ) ph/cm2/s
Energy fluence (15-150 keV)             : 0 ( 0  0 ) ergs/cm2
S(25-50 keV) vs. S(50-100 keV) plot

S(25-50 keV)  = 1.60e-06
S(50-100 keV) = 2.34e-06
T90 vs. Hardness ratio plot

T90                                   = 64 sec.
Hardness ratio (energy fluence ratio) = 1.4625
Color vs. Color plot
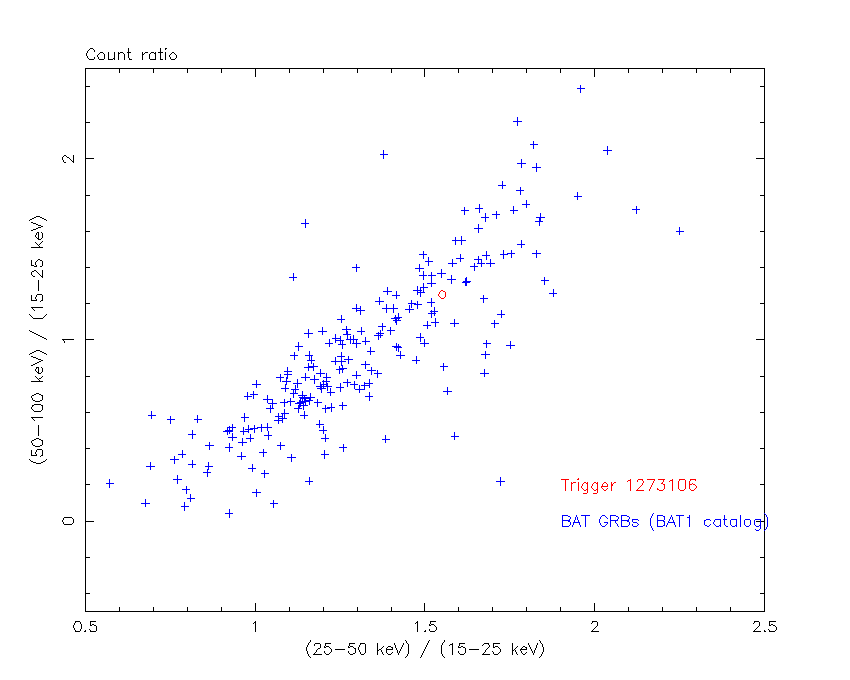
Count Ratio  (25-50 keV) / (15-25 keV) = 1.59557
Count Ratio (50-100 keV) / (15-25 keV) = 1.28203
Mask shadow pattern

IMX = 4.025049784344334E-01, IMY = -3.082318771517079E-01
TIME vs. PHA plot around the trigger time

Blue+Cyan dotted lines: Time interval of the scaled map
From 0.000000 to 1.024000
TIME vs. DetID plot around the trigger time

Blue+Cyan dotted lines: Time interval of the scaled map
From 0.000000 to 1.024000
100 us light curve (15-350 keV)

Blue+Cyan dotted lines: Time interval of the scaled map
From 0.000000 to 1.024000
Spacecraft aspect plot

Bright source in the pre-burst/pre-slew/post-slew images
Pre-burst image of 15-350 keV band
Time interval of the image:
-239.120000 -15.120000

# RAcent  DECcent POSerr Theta    Phi  PeakCts   SNR AngSep     Name
#  [deg]    [deg]    ['] [deg]  [deg]                   [']
244.9603 -15.6409    0.8  35.5  -90.0  13.8545  14.2    1.1	Sco X-1
254.3856  35.4301    9.6  46.8 -171.9  -0.9789  -1.2    6.3	Her X-1
185.4740 -23.3217    2.9  41.0    9.0   2.5151   3.9 ------	UNKNOWN
229.0037  -5.9994    3.3  17.1  -86.4   1.5023   3.5 ------	UNKNOWN
Pre-slew background subtracted image of 15-350 keV band
Time interval of the image:
-15.120000 15.180590

# RAcent  DECcent POSerr Theta    Phi  PeakCts   SNR AngSep     Name
#  [deg]    [deg]    ['] [deg]  [deg]                   [']
245.0403 -15.8244    0.0  35.6  -89.8   0.3556   1.7   11.6	Sco X-1
254.4078  35.1717    5.7  46.6 -171.6   0.3313   2.0   10.5	Her X-1
178.0105  23.3963    2.4  40.8   84.5   1.9219   4.9 ------	UNKNOWN
208.3882  53.3640    1.9  48.8  138.0   2.5433   6.0 ------	UNKNOWN
190.1030  -2.8870    0.3  26.9   37.4   4.1248  37.3 ------	UNKNOWN
255.3973  49.9603    2.2  55.9  173.6   2.3493   5.2 ------	UNKNOWN
Post-slew image of 15-350 keV band
Time interval of the image:
80.980600 284.180600

# RAcent  DECcent POSerr Theta    Phi  PeakCts   SNR AngSep     Name
#  [deg]    [deg]    ['] [deg]  [deg]                   [']
173.6514  30.6745    2.6  37.1  132.8   3.4762   4.4 ------	UNKNOWN
165.4177 -31.8699    2.8  37.1   12.6   2.1311   4.1 ------	UNKNOWN
162.1694 -49.2235    2.6  52.1   -0.6   3.2239   4.5 ------	UNKNOWN
Plot creation:
Fri Jun 20 02:01:53 EDT 2025