Estimated redshift from machine learning (Ukwatta et al. 2016) - may take a few minute to calcaulte
Image
Pre-slew 15.0-350.0 keV image (Event data)
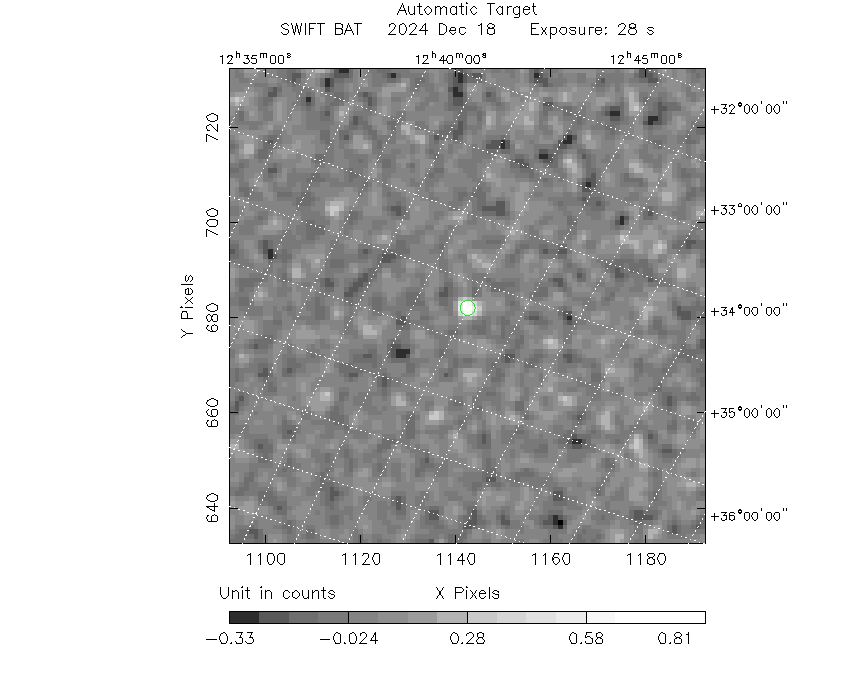
#   RAcent    DECcent   POSerr    Theta     Phi              Peak Cts       SNR   Name
  185.6864    29.9859   0.0181    35.0314  -141.9895         0.9653575     10.565 TRIG_01275005

Foreground time interval of the image:
 -1.824  26.160 (delta_t =  27.984 [sec])
Background time interval of the image:
-118.387  -1.824 (delta_t = 116.563 [sec])
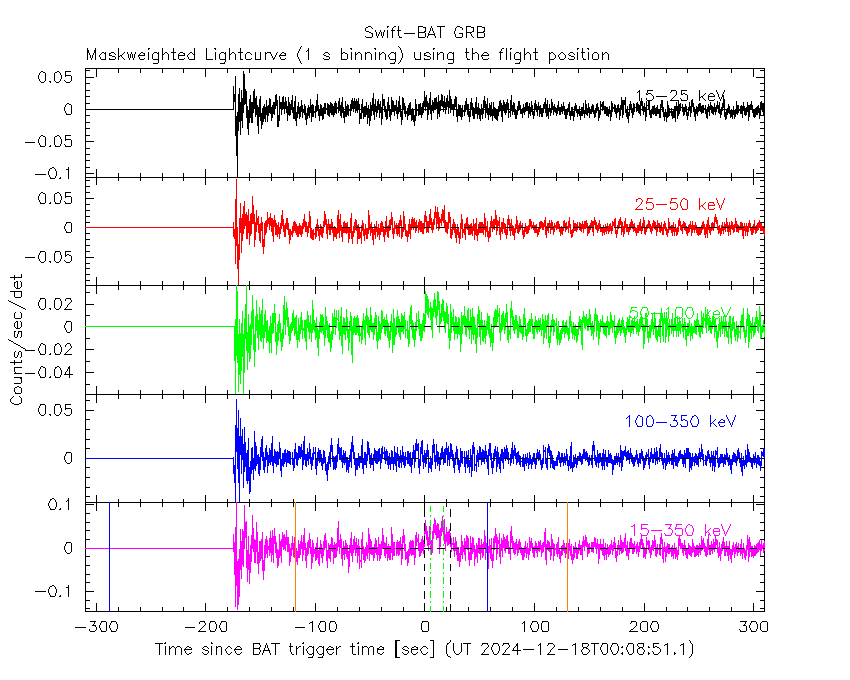
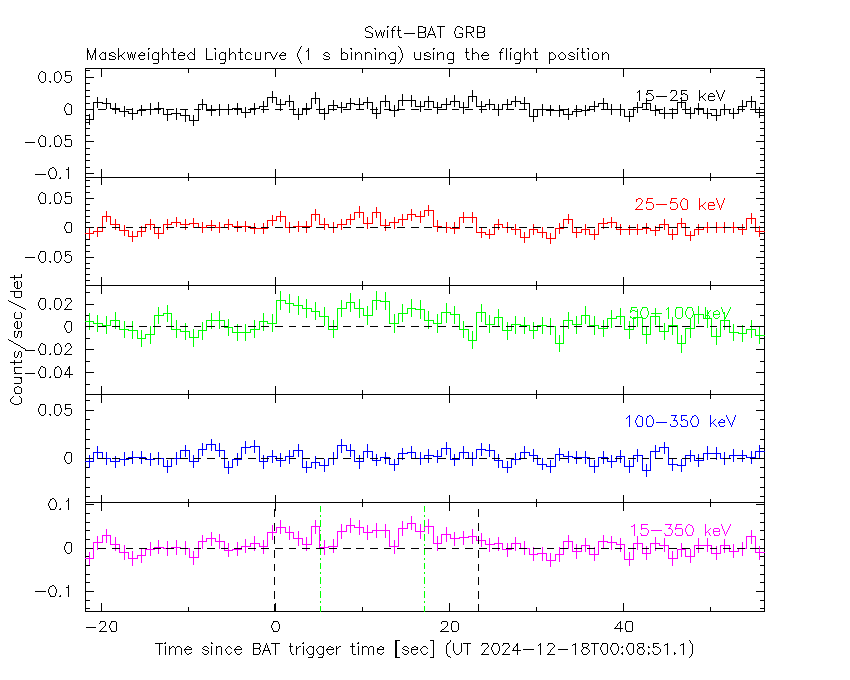
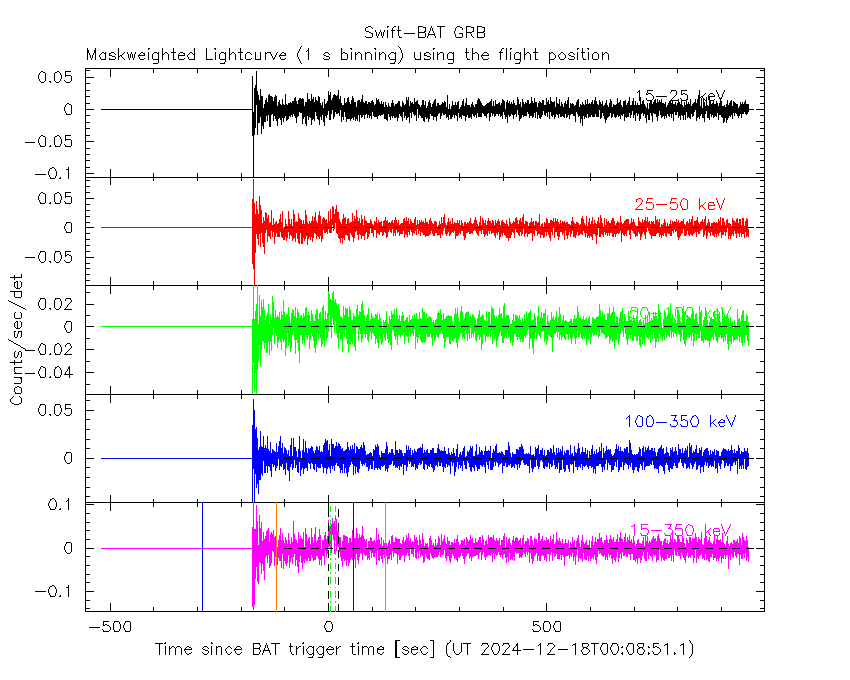
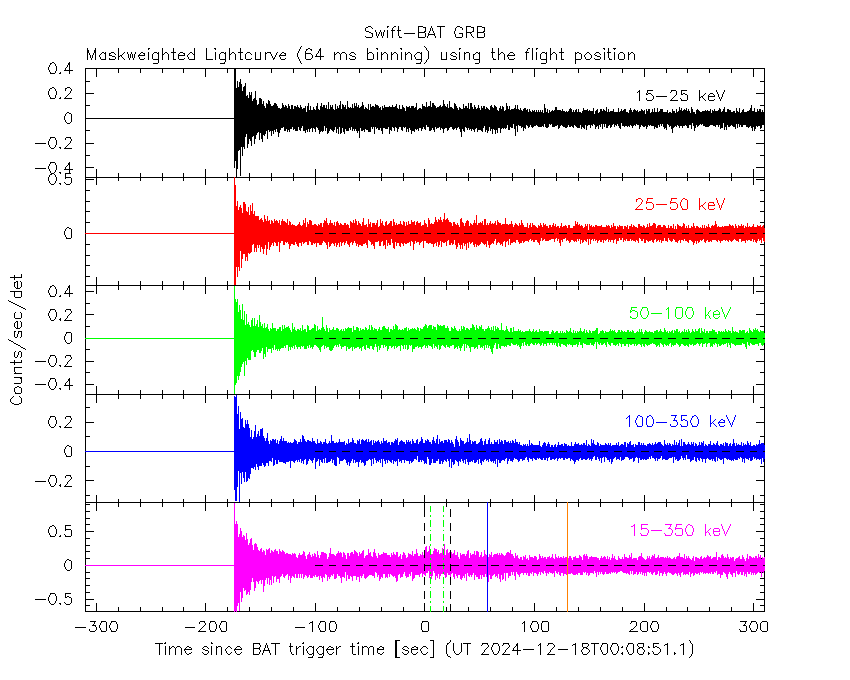
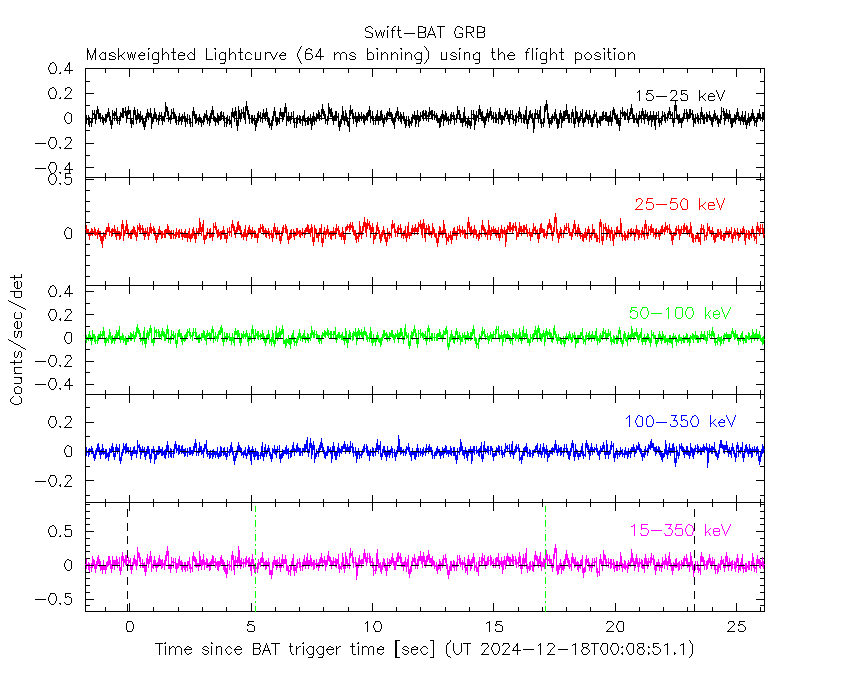
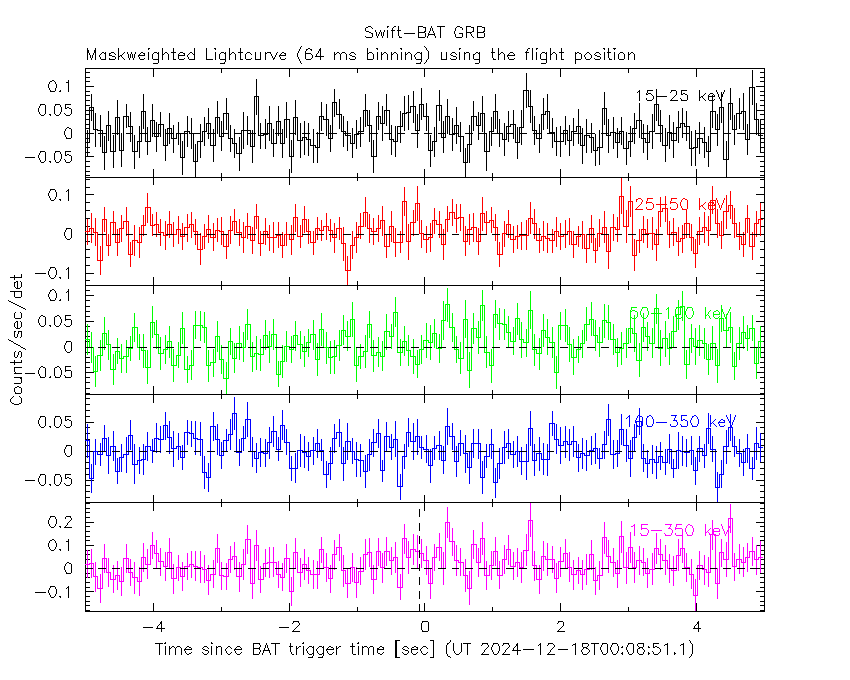
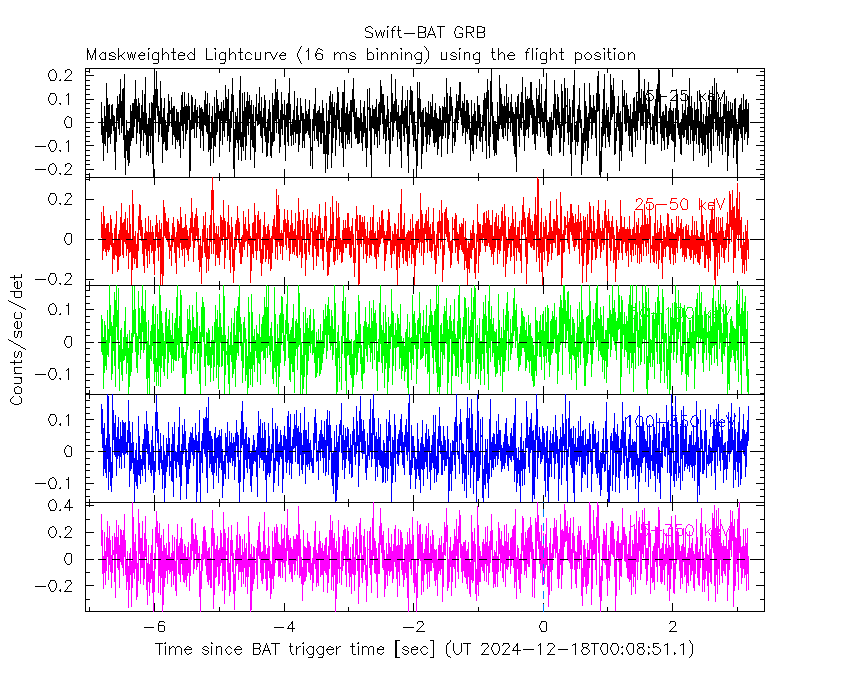
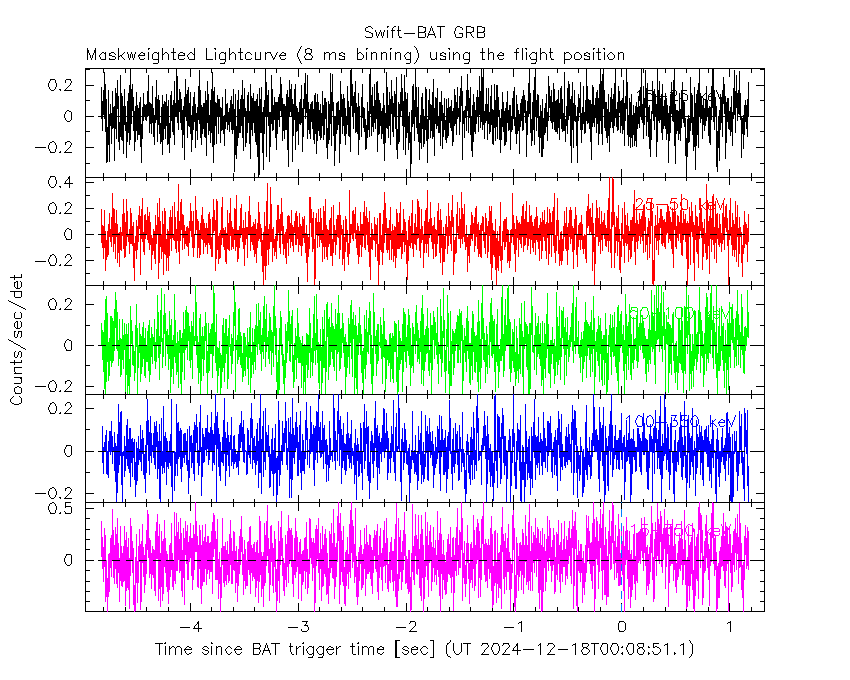
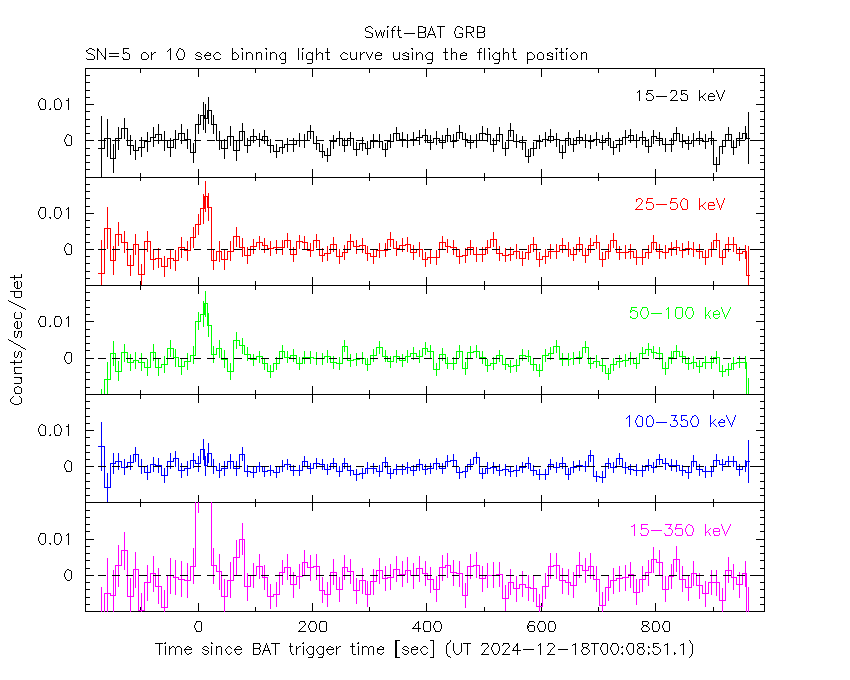
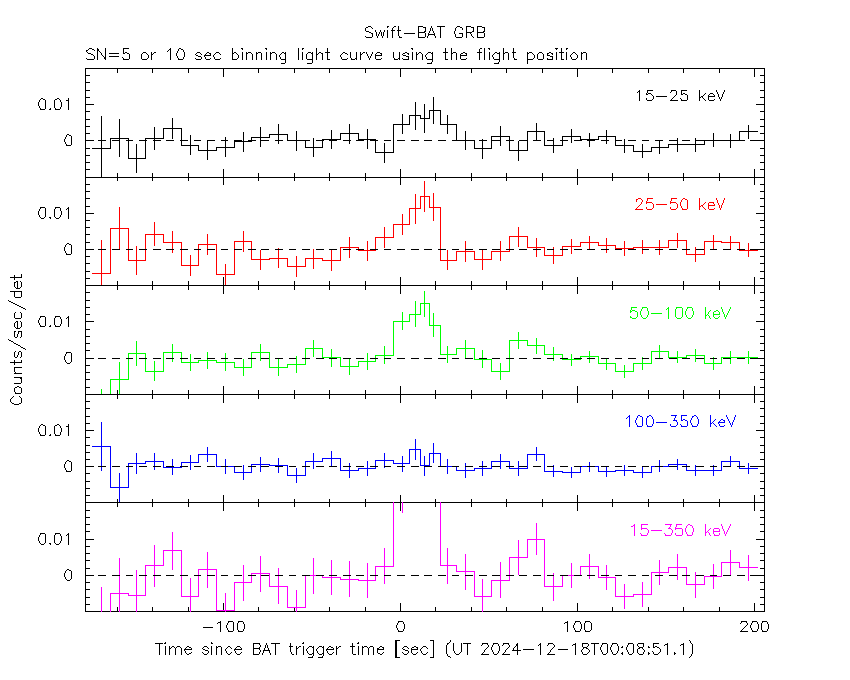
Lightcurves
Notes:
- 1) The mask-weighted light curves are using the flight position.
- 2) Multiple plots of different time binning/intervals are shown to cover all scenarios of short/long GRBs, rate/image triggers, and real/false positives.
- 3) For all the mask-weighted lightcurves, the y-axis units are counts/sec/det where a det is 0.4 x 0.4 = 0.16 sq cm.
- 4) The verticle lines correspond to following: green dotted lines are T50 interval, black dotted lines are T90 interval, blue solid line(s) is a spacecraft slew start time, and orange solid line(s) is a spacecraft slew end time.
- 5) Time of each bin is in the middle of the bin.
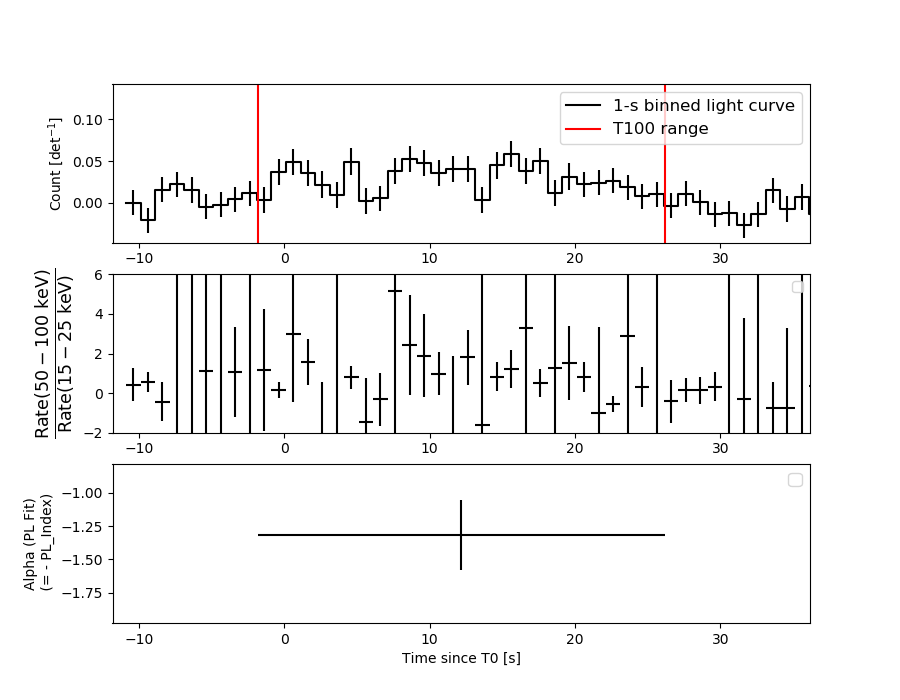
1 s binning
From T0-310 s to T0+310 s
From T100_start - 20 s to T100_end + 30 s
Full time interval
64 ms binning
Full time interval
From T100_start to T100_end
From T0-5 sec to T0+5 sec
16 ms binning
From T100_start-5 s to T100_start+5 s
Blue+Cyan dotted lines: Time interval of the scaled map
From 0.000000 to 12.160000
8 ms binning
From T100_start-3 s to T100_start+3 s
Blue+Cyan dotted lines: Time interval of the scaled map
From 0.000000 to 12.160000
2 ms binning
From T100_start-1 s to T100_start+1 s
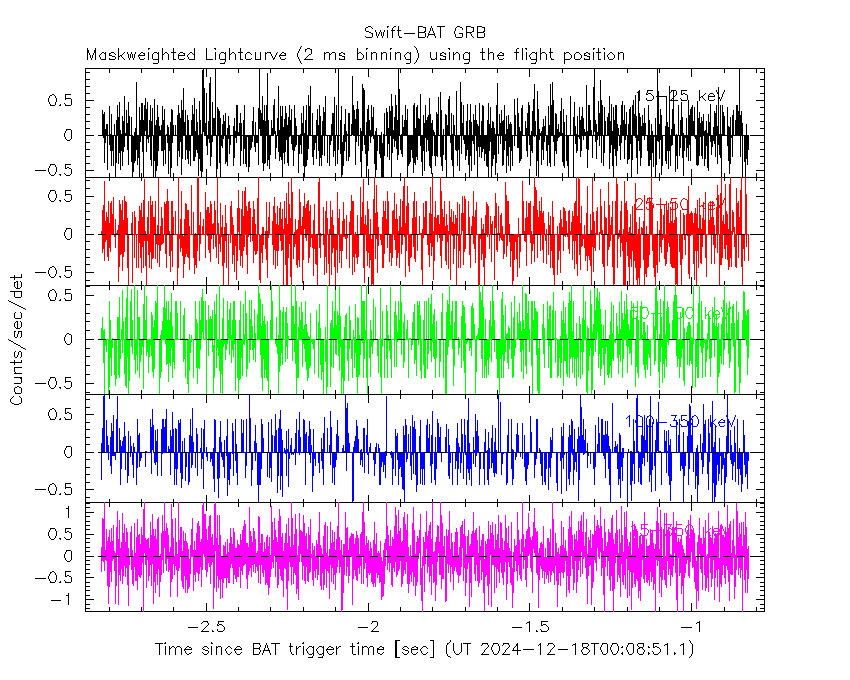
Blue+Cyan dotted lines: Time interval of the scaled map
From 0.000000 to 12.160000
SN=5 or 10 sec. binning (whichever binning is satisfied first)
SN=5 or 10 sec. binning (T < 200 sec)
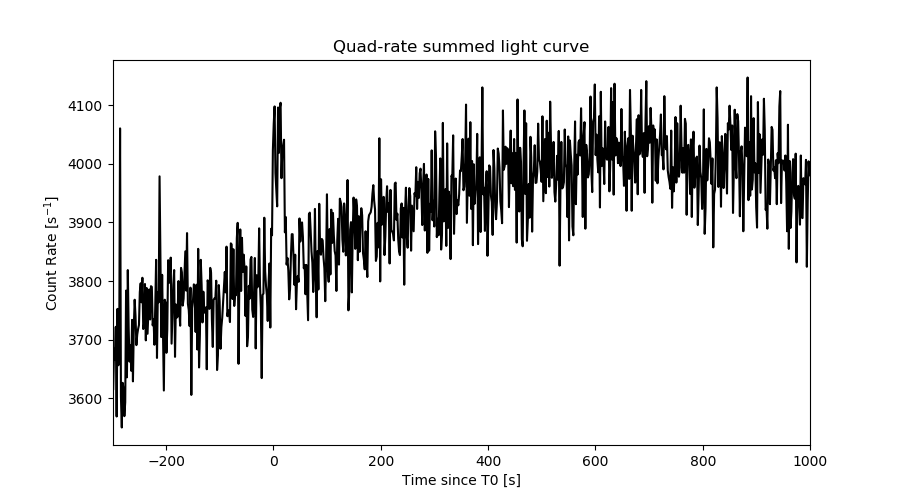
Quad-rate summed light curves (from T0-300s to T0+1000s)
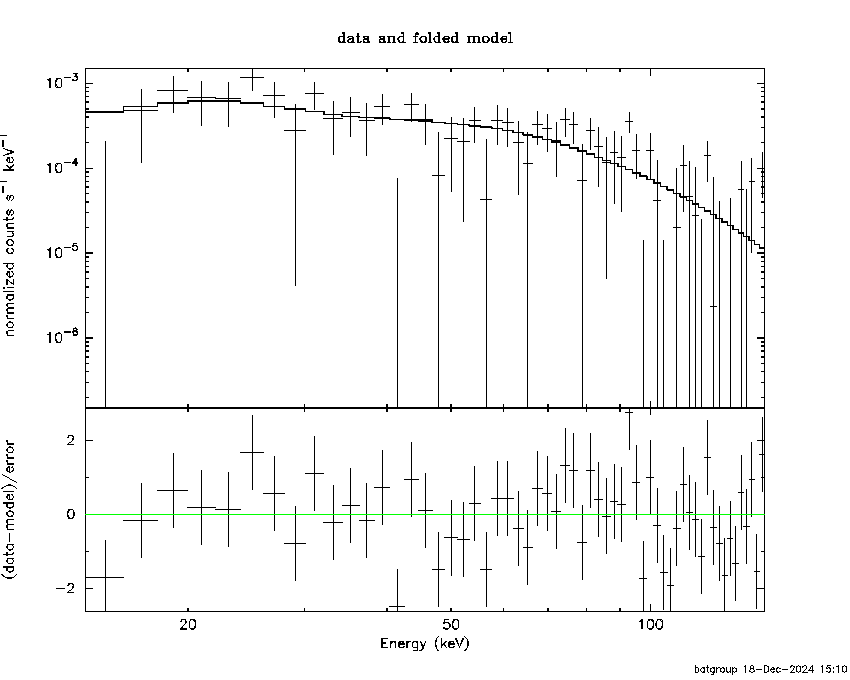
Spectral Evolution
Spectra
Notes:
- 1) The fitting includes the systematic errors.
- 2) When the burst includes telescope slew time periods, the fitting uses an average response file made from multiple 5-s response files through out the slew time plus single time preiod for the non-slew times, and weighted by the total counts in the corresponding time period using addrmf. An average response file is needed becuase a spectral fit using the pre-slew DRM will introduce some errors in both a spectral shape and a normalization if the PHA file contains a lot of the slew/post-slew time interval.
- 3) For fits to more complicated models (e.g. a power-law over a cutoff power-law), the BAT team has decided to require a chi-square improvement of more than 6 for each extra dof.
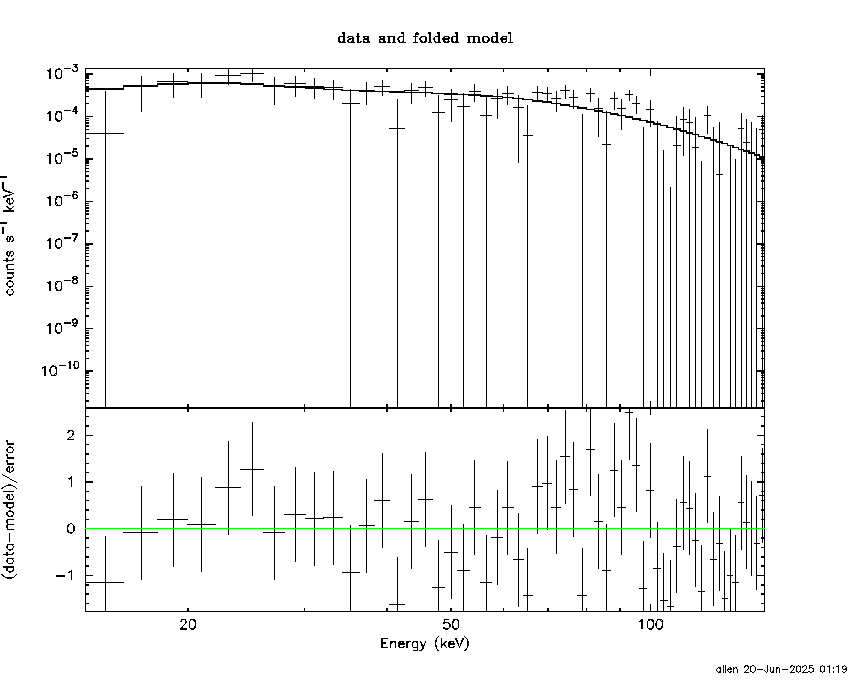
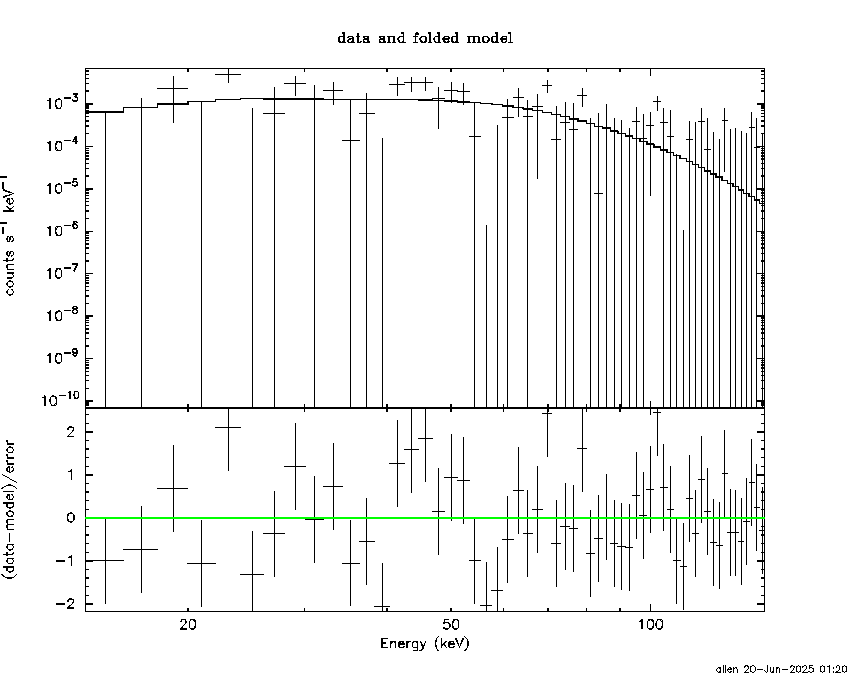
Time averaged spectrum fit using the average DRM
Power-law model

Time interval is from   -1.824 sec. to   26.160 sec.

Spectral model in power-law:
------------------------------------------------------------
Parameters  : value       lower 90%   higher 90%
Photon index: 1.31928     ( -0.267203   0.26188 )
Norm@50keV  : 2.01003E-03    ( -0.000325349   0.00032534 )
------------------------------------------------------------
#Fit statistic  : Chi-Squared                   56.11     using 59 bins.
 Reduced chi-squared = 0.984386
# Null hypothesis probability of 5.09e-01 with 57 degrees of freedom

Photon flux (15-150 keV)    in 27.98 sec: 0.240678 ( -0.040581  0.040772 ) ph/cm2/s
Energy fluence (15-150 keV)             : 5.53257e-07 ( -9.57078e-08  9.64205e-08 ) ergs/cm2
Cutoff power-law model
Time interval is from   -1.824 sec. to   26.160 sec.
Spectral model in the cutoff power-law:
------------------------------------------------------------
Parameters  : value       lower 90%   higher 90%
Photon index: 0.419933     ( -1.27725   0.983686 )
Epeak [keV] : 95.4890      ( -31.6993 -95.4821 )
Norm@50keV  : 5.32138E-03    ( -0.00532217   0.0136259 )
------------------------------------------------------------
#Fit statistic  : Chi-Squared                   53.72     using 59 bins.
 Reduced chi-squared = 0.959286
# Null hypothesis probability of 5.62e-01 with 56 degrees of freedom

Photon flux (15-150 keV)    in 27.98 sec: 0.232558 ( -0.041834  0.041882 ) ph/cm2/s
Energy fluence (15-150 keV)             : 5.31237e-07 ( -9.86354e-08  9.98626e-08 ) ergs/cm2
Band function

Time interval is from   -1.824 sec. to   26.160 sec.


Spectral model in the Band function:
------------------------------------------------------------
Parameters  : value       lower 90%   higher 90%
alpha       :    (     )
beta        :     (     )
Epeak [keV] :       (   )
Norm@50keV   :     (     )
------------------------------------------------------------

Photon flux (15-150 keV)    in  sec:  (    ) ph/cm2/s
Energy fluence (15-150 keV)             : 0 ( 0  0 ) ergs/cm2
Single BB

Spectral model blackbody:
------------------------------------------------------------
Parameters  : value    Lower 90%  Upper 90%
kT [keV]    : 18.8003  (-3.31992  4.14107)
R^2/D10^2   : 1.35247E-02  (-0.00668372   0.0128104)
(R is the radius in km and D10 is the distance to the source in units of 10 kpc)
------------------------------------------------------------
#Fit statistic  : Chi-Squared                   58.54     using 59 bins.
 Reduced chi-squared =
# Null hypothesis probability of 4.19e-01 with 57 degrees of freedom

Energy  Fluence     90% Error
[keV]   [erg/cm2]   [erg/cm2]
15- 25  2.639e-08   8.986e-09
25- 50  1.260e-07   4.191e-08
50-150  3.266e-07   1.012e-07
15-150  4.789e-07   1.238e-07
Thermal bremsstrahlung (OTTB)
Spectral model: thermal bremsstrahlung
------------------------------------------------------------
Parameters  : value         Lower 90%    Upper 90%
kT [keV]    : 200.000       (-65.0275      -200)
Norm        : 1.01293       (-0.164813     0.164813)
------------------------------------------------------------
#Fit statistic  : Chi-Squared                   57.12     using 59 bins.
 Reduced chi-squared =
# Null hypothesis probability of 4.71e-01 with 57 degrees of freedom

Energy  Fluence     90% Error
[keV]   [erg/cm2]   [erg/cm2]
15- 25  7.060e-08   4.078e-08
25- 50  1.358e-07   7.685e-08
50-150  2.979e-07   1.661e-07
15-150  5.043e-07   2.825e-07
Double BB

Spectral model: bbodyrad<1> + bbodyrad<2>
------------------------------------------------------------
Parameters  : value         Lower 90%    Upper 90%
kT1 [keV]   : 6.37573        (-2.38481      3.78809)
R1^2/D10^2  : 0.261390        (-0.212476      0.934405)
kT2 [keV]   : 24.2729        (-5.54378      10.3822)
R2^2/D10^2  : 4.91564E-03    (-0.00352202   0.00721972)
------------------------------------------------------------
#Fit statistic  : Chi-Squared                   51.45     using 59 bins.
 Reduced chi-squared =
# Null hypothesis probability of 6.11e-01 with 55 degrees of freedom

Energy  Fluence     90% Error
[keV]   [erg/cm2]   [erg/cm2]
15- 25  5.718e-08   3.356e-08
25- 50  1.285e-07   6.925e-08
50-150  3.559e-07   2.009e-07
15-150  5.416e-07   2.900e-07
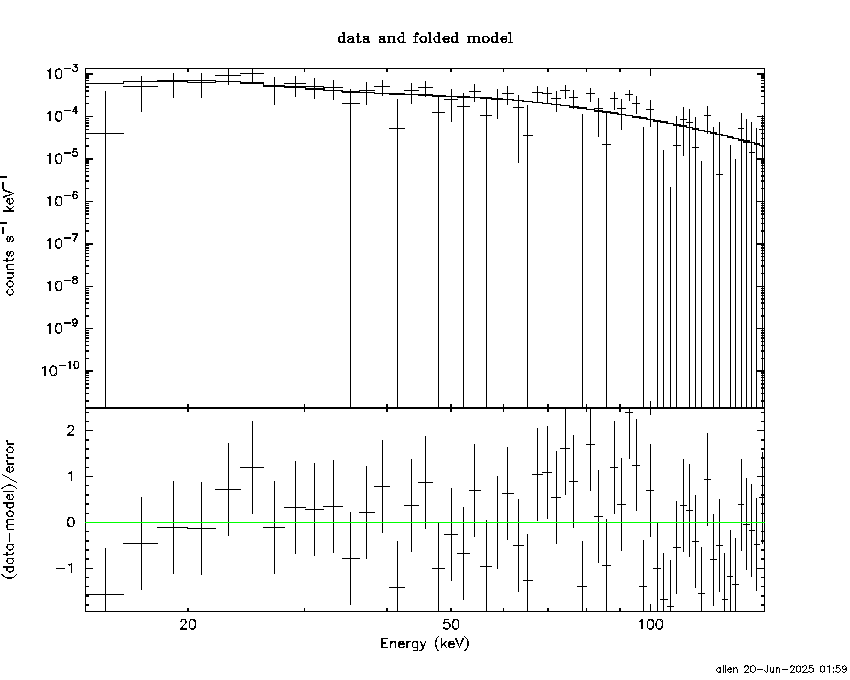
Peak spectrum fit
Power-law model

Time interval is from    8.888 sec. to    9.888 sec.

Spectral model in power-law:
------------------------------------------------------------
Parameters  : value       lower 90%   higher 90%
Photon index: 1.24983     ( -0.522468   0.483173 )
Norm@50keV  : 5.10991E-03    ( -0.00173475   0.00172901 )
------------------------------------------------------------
#Fit statistic  : Chi-Squared                   64.12     using 59 bins.
 Reduced chi-squared = 1.12491
# Null hypothesis probability of 2.41e-01 with 57 degrees of freedom

Photon flux (15-150 keV)    in 1 sec: 0.604118 ( -0.212708  0.216064 ) ph/cm2/s
Energy fluence (15-150 keV)             : 5.11635e-08 ( -1.77232e-08  1.79034e-08 ) ergs/cm2
Cutoff power-law model
Time interval is from    8.888 sec. to    9.888 sec.
Spectral model in the cutoff power-law:
------------------------------------------------------------
Parameters  : value       lower 90%   higher 90%
Photon index: -1.82019     ( -7.58462   2.78642 )
Epeak [keV] : 63.8289      ( -16.3918 77.5755 )
Norm@50keV  : 0.161638    ( -0.200615   864.772 )
------------------------------------------------------------
#Fit statistic  : Chi-Squared                   59.97     using 59 bins.
 Reduced chi-squared = 1.07089
# Null hypothesis probability of 3.34e-01 with 56 degrees of freedom

Photon flux (15-150 keV)    in 1 sec: 0.570559 ( -0.204505  0.215094 ) ph/cm2/s
Energy fluence (15-150 keV)             : 4.52262e-08 ( -1.70955e-08  1.86354e-08 ) ergs/cm2
Band function

Time interval is from    8.888 sec. to    9.888 sec.


Spectral model in the Band function:
------------------------------------------------------------
Parameters  : value       lower 90%   higher 90%
alpha       :    (     )
beta        :     (     )
Epeak [keV] :       (   )
Norm@50keV   :     (     )
------------------------------------------------------------

Photon flux (15-150 keV)    in  sec:  (    ) ph/cm2/s
Energy fluence (15-150 keV)             : 0 ( 0  0 ) ergs/cm2
Single BB

Spectral model blackbody:
------------------------------------------------------------
Parameters  : value    Lower 90%  Upper 90%
kT [keV]    : 16.7054  (-4.22647  6.42577)
R^2/D10^2   : 5.79071E-02  (-0.0579071   0.102078)
(R is the radius in km and D10 is the distance to the source in units of 10 kpc)
------------------------------------------------------------
#Fit statistic  : Chi-Squared                   60.10     using 59 bins.
 Reduced chi-squared =
# Null hypothesis probability of 3.64e-01 with 57 degrees of freedom

Energy  Fluence     90% Error
[keV]   [erg/cm2]   [erg/cm2]
15- 25  3.307e-09   2.108e-09
25- 50  1.443e-08   8.660e-09
50-150  2.858e-08   1.983e-08
15-150  4.631e-08   2.974e-08
Thermal bremsstrahlung (OTTB)

Spectral model: thermal bremsstrahlung
------------------------------------------------------------
Parameters  : value         Lower 90%    Upper 90%
kT [keV]    : 199.363       (-112.321      -199.363)
Norm        : 2.60872       (-0.883421     0.883449)
------------------------------------------------------------
#Fit statistic  : Chi-Squared                   64.36     using 59 bins.
 Reduced chi-squared =
# Null hypothesis probability of 2.35e-01 with 57 degrees of freedom

Energy  Fluence     90% Error
[keV]   [erg/cm2]   [erg/cm2]
15- 25  6.496e-09   4.217e-09
25- 50  1.250e-08   8.115e-09
50-150  2.741e-08   1.734e-08
15-150  4.640e-08   2.906e-08
Double BB
Spectral model: bbodyrad<1> + bbodyrad<2>
------------------------------------------------------------
Parameters  : value         Lower 90%    Upper 90%
kT1 [keV]   : 199.924        (-199.924      -199.924)
R1^2/D10^2  : 1.22929E-05        (-1.22929e-05      -1.22929e-05)
kT2 [keV]   : 16.0742        (-16.0742      6.96662)
R2^2/D10^2  : 6.39354E-02    (-0.0639354   0.0951793)
------------------------------------------------------------
#Fit statistic  : Chi-Squared                   60.07     using 59 bins.
 Reduced chi-squared =
# Null hypothesis probability of 2.97e-01 with 55 degrees of freedom

Energy  Fluence     90% Error
[keV]   [erg/cm2]   [erg/cm2]
15- 25  3.349e-09   8.310e-06
25- 50  1.443e-08   7.710e-05
50-150  2.875e-08   1.788e-03
15-150  4.652e-08   1.664e-03
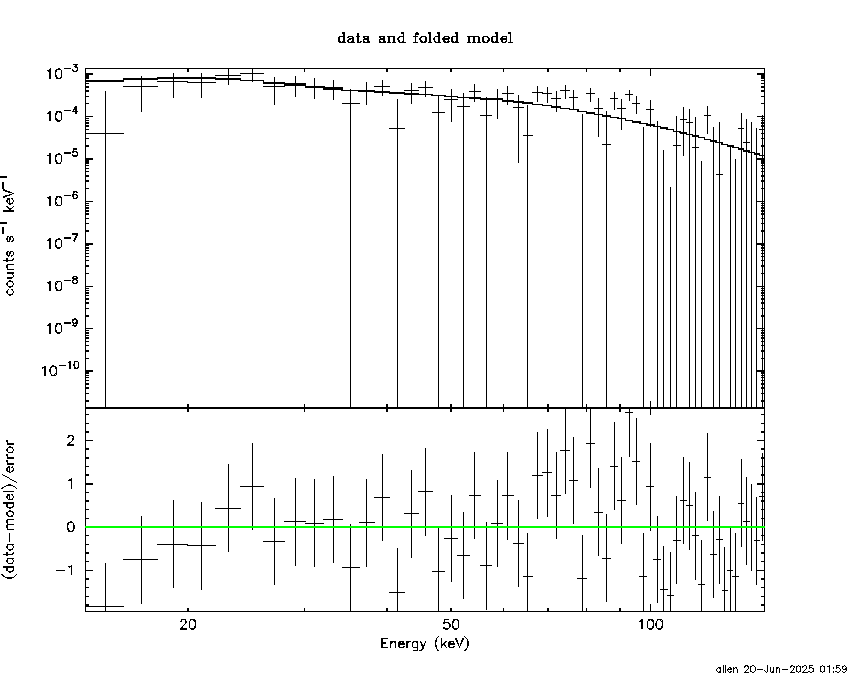
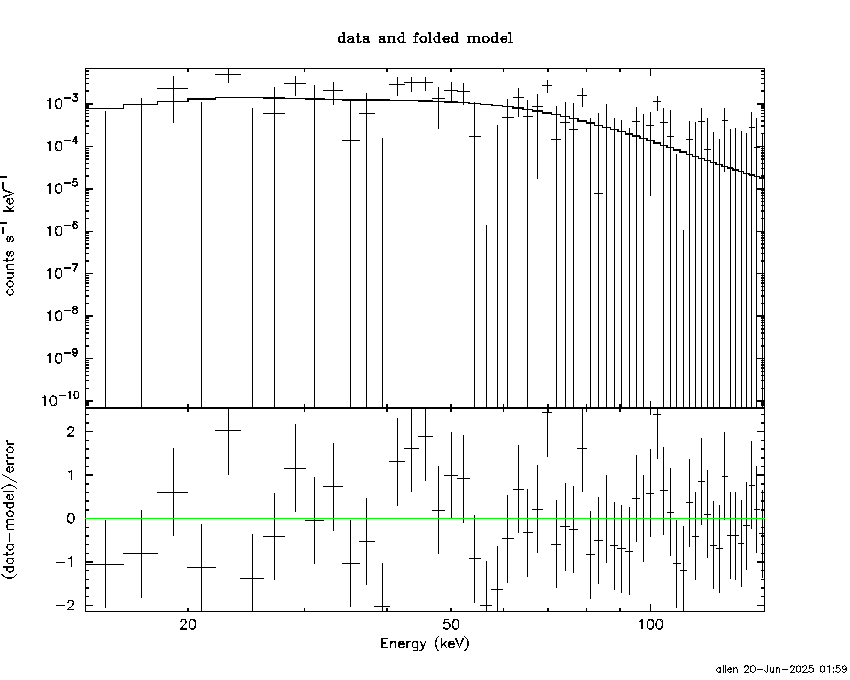
Pre-slew spectrum (Pre-slew PHA with pre-slew DRM)
Power-law model
Spectral model in power-law:
------------------------------------------------------------
Parameters  : value       lower 90%   higher 90%
Photon index: 1.31928     ( -0.267203   0.26188 )
Norm@50keV  : 2.01003E-03    ( -0.000325349   0.00032534 )
------------------------------------------------------------
#Fit statistic  : Chi-Squared                   56.11     using 59 bins.
 Reduced chi-squared =
# Null hypothesis probability of 5.09e-01 with 57 degrees of freedom

Photon flux (15-150 keV)    in 27.98 sec: 0.240675 ( -0.0405792  0.0407703 ) ph/cm2/s
Energy fluence (15-150 keV)             : 5.53187e-07 ( -9.56874e-08  9.64823e-08 ) ergs/cm2
Cutoff power-law model

Spectral model in the cutoff power-law:
------------------------------------------------------------
Parameters  : value       lower 90%   higher 90%
Photon index: 0.420405     ( -1.27714   0.983801 )
Epeak [keV] : 95.5162      ( -31.5911 -95.4839 )
Norm@50keV  : 5.31841E-03    ( -0.00532222   0.0136256 )
------------------------------------------------------------
#Fit statistic  : Chi-Squared                   53.72     using 59 bins.
 Reduced chi-squared =
# Null hypothesis probability of 5.62e-01 with 56 degrees of freedom

Photon flux (15-150 keV)    in 27.98 sec: 0.232549 ( -0.041828  0.041861 ) ph/cm2/s
Energy fluence (15-150 keV)             : 5.31455e-07 ( -9.86295e-08  1.00034e-07 ) ergs/cm2
Band function
Spectral model in the Band function:
------------------------------------------------------------
Parameters  : value       lower 90%   higher 90%
alpha       :    (     )
beta        :     (     )
Epeak [keV] :       (   )
Norm@50keV   :     (     )
------------------------------------------------------------

Photon flux (15-150 keV)    in  sec:  (    ) ph/cm2/s
Energy fluence (15-150 keV)             : 0 ( 0  0 ) ergs/cm2
S(25-50 keV) vs. S(50-100 keV) plot
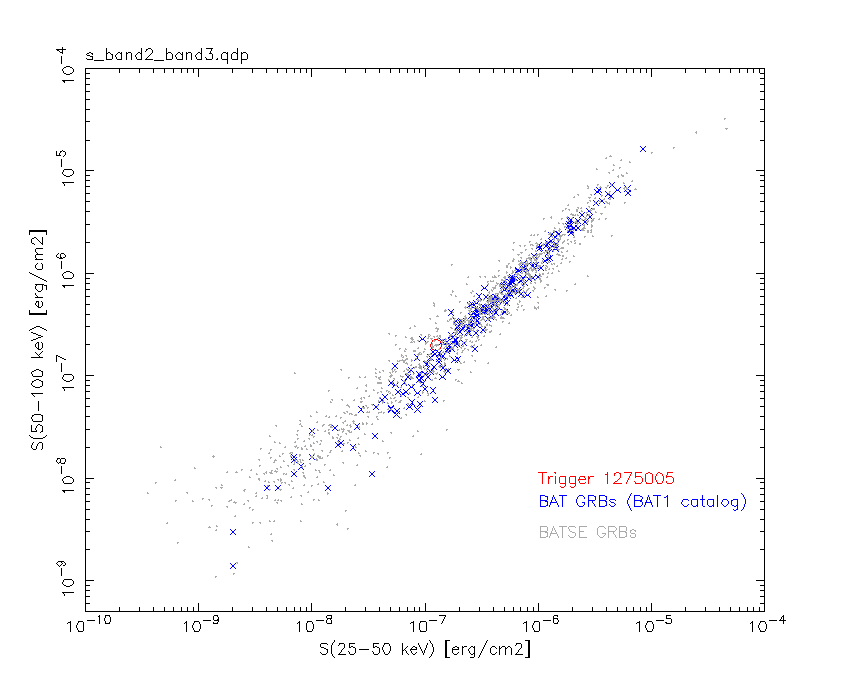
S(25-50 keV)  = 1.25e-07
S(50-100 keV) = 1.99e-07
T90 vs. Hardness ratio plot
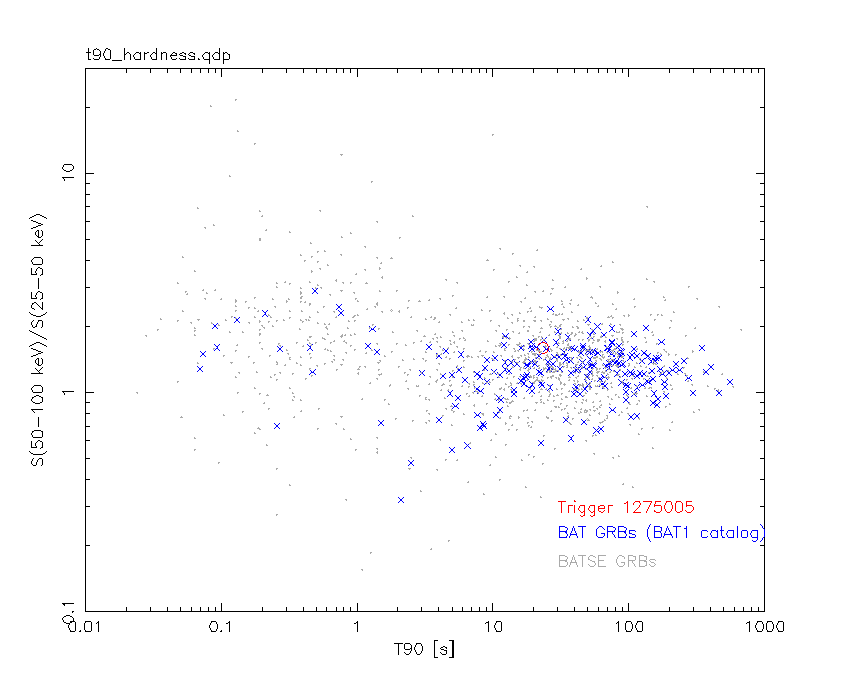
T90                                   = 23.3519998788834 sec.
Hardness ratio (energy fluence ratio) = 1.592
Color vs. Color plot
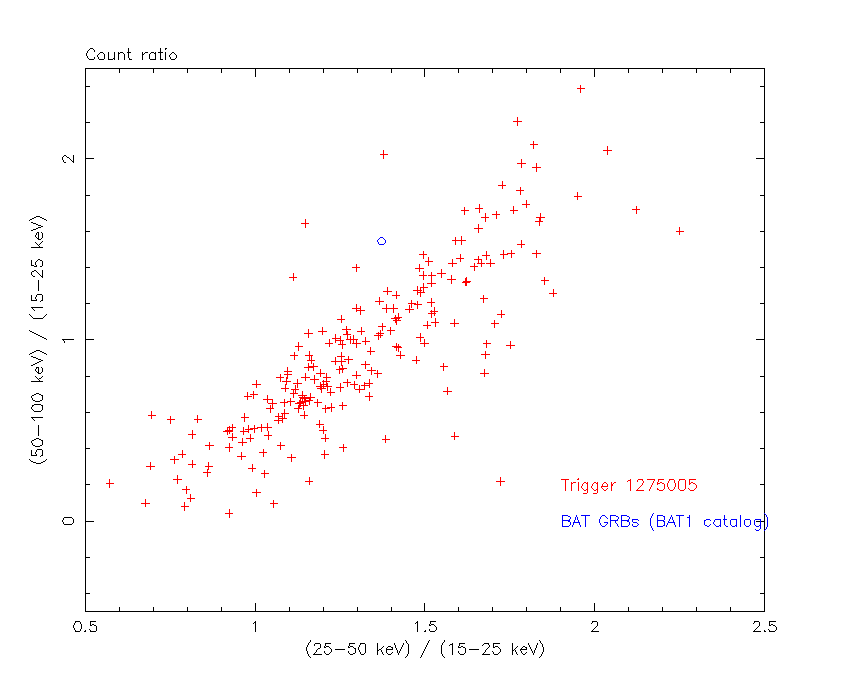
Count Ratio  (25-50 keV) / (15-25 keV) = 1.37192
Count Ratio (50-100 keV) / (15-25 keV) = 1.54536
Mask shadow pattern
IMX = -5.523357671686940E-01, IMY = 4.316954955359277E-01
TIME vs. PHA plot around the trigger time
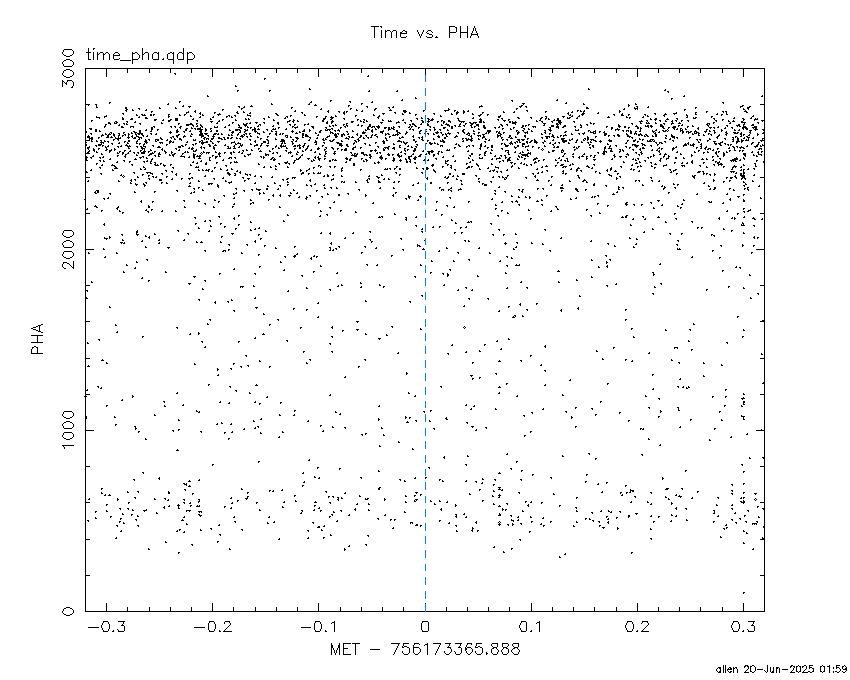
Blue+Cyan dotted lines: Time interval of the scaled map
From 0.000000 to 12.160000
TIME vs. DetID plot around the trigger time
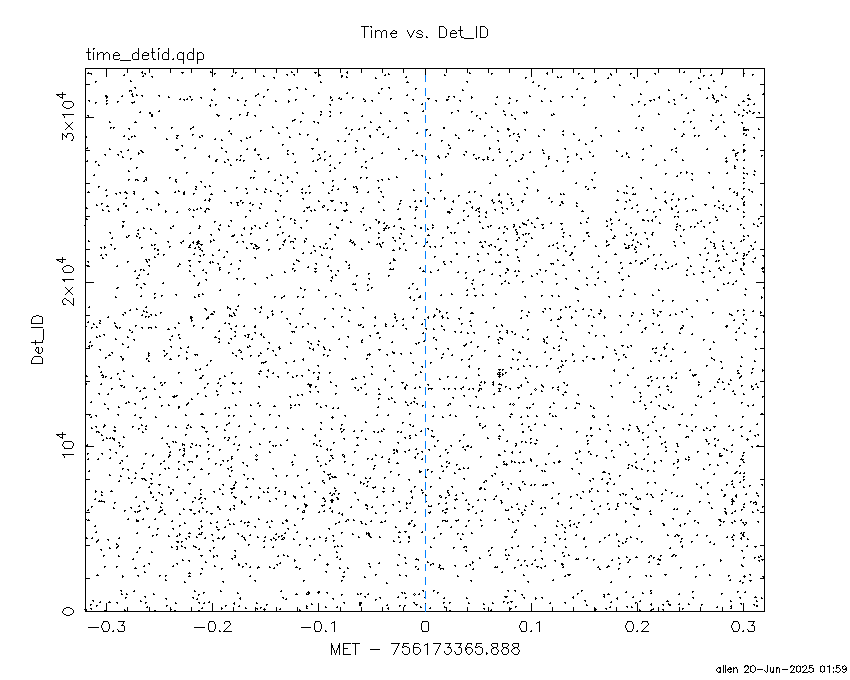
Blue+Cyan dotted lines: Time interval of the scaled map
From 0.000000 to 12.160000
100 us light curve (15-350 keV)
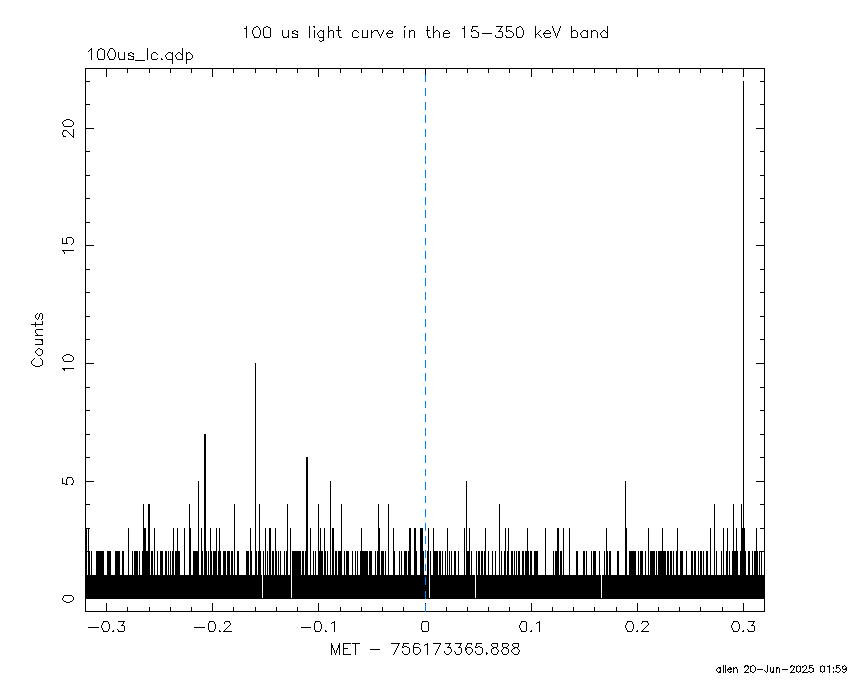
Blue+Cyan dotted lines: Time interval of the scaled map
From 0.000000 to 12.160000
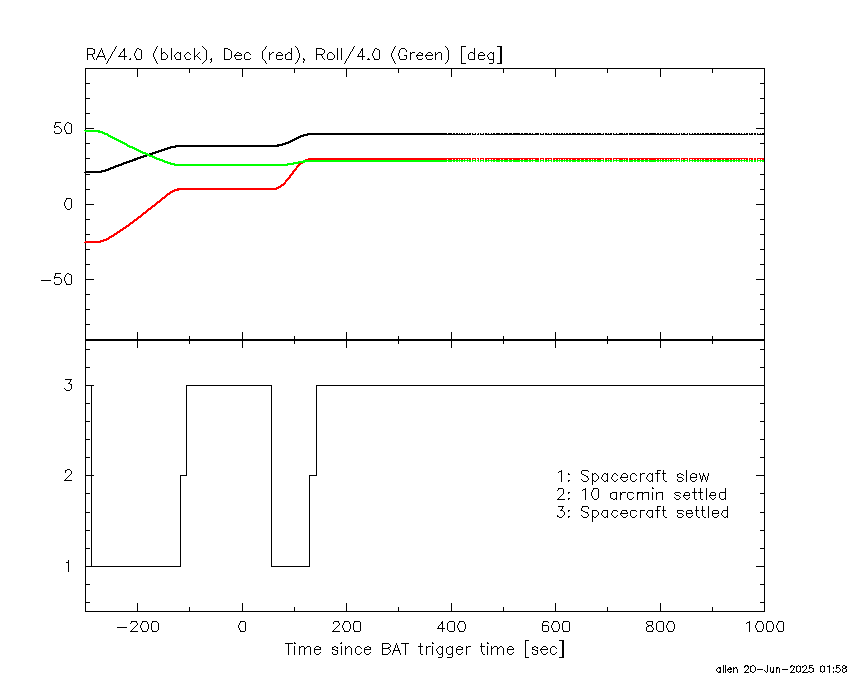
Spacecraft aspect plot
Bright source in the pre-burst/pre-slew/post-slew images
Pre-burst image of 15-350 keV band
Time interval of the image:
-118.387400 -1.824000

# RAcent  DECcent POSerr Theta    Phi  PeakCts   SNR AngSep     Name
#  [deg]    [deg]    ['] [deg]  [deg]                   [']
135.4365 -40.5504    3.5  53.7    5.1   1.5862   3.3    4.2	Vela X-1
116.3987  33.7638    3.1  42.3  117.0   3.3018   3.7 ------	UNKNOWN
141.0115  50.4746    2.6  41.9  154.0   1.7115   4.4 ------	UNKNOWN
179.4252 -38.7922    2.5  54.1  -36.7   4.8443   4.7 ------	UNKNOWN
Pre-slew background subtracted image of 15-350 keV band
Time interval of the image:
-1.824000 26.160000

# RAcent  DECcent POSerr Theta    Phi  PeakCts   SNR AngSep     Name
#  [deg]    [deg]    ['] [deg]  [deg]                   [']
135.6364 -40.5941    9.1  53.7    4.9   0.3002   1.3    5.5	Vela X-1
134.7620 -41.0358    2.1  54.4    5.5   1.4292   5.3 ------	UNKNOWN
185.6864  29.9859    1.1  35.0 -142.0   0.9653  10.6 ------	UNKNOWN
Post-slew image of 15-350 keV band
Time interval of the image:
129.812590 962.223900

# RAcent  DECcent POSerr Theta    Phi  PeakCts   SNR AngSep     Name
#  [deg]    [deg]    ['] [deg]  [deg]                   [']
186.5769  31.8750    2.9   2.0  177.1   4.0289   4.0 ------	UNKNOWN
189.7973  -2.8319    2.5  33.1  -32.2   6.3226   4.7 ------	UNKNOWN
Plot creation:
Fri Jun 20 01:59:32 EDT 2025