batgrbproduct analysis for trigger=1278865
batgrbproduct Analysis for Trigger=1278865
Analysis Summary
Notes:
- 1) No attempt has been made to eliminate the non-significant decimal places.
- 2) This batgrbproduct analysis is done of the amount of data for this trigger downloaded to date.
- 3) This batgrbproduct analysis is using the flight position for the mask-weighting calculation.
- 4) This page will be updated for up to 15 downlinks after the trigger.
======================================================================
                  BAT GRB EVENT DATA PROCESSING REPORT
    Process Script Ver: batgrbproduct v2.48
    Process Start Time (local time): Sun Jan  5 20:56:00 EST 2025
             Host Name: batproc1
   Current Working Dir: /local/data/bat1/prebascript/trigger1278865/batgroup_hand_proc
======================================================================

  Trigger: 01278865      Segment: 000

  BAT Trigger Time: 757611892.544   [s; MET]
      Trigger Stop: 757611908.928   [s; MET]
               UTC: 2025-01-03T15:44:17.714260    [includes UTCF correction]
       Where From?: TDRSS position message

  BAT
    RA: 54.651507189025   Dec: -33.7719895589748  [deg; J2000]

     Catalogged Source?: NO
     Point Source?:      YES
     GRB Indicated?:     YES    [ by BAT flight software ]
     Image S/N Ratio:    8.16
     Image Trigger?:     NO
     Rate S/N Ratio:     11.4017542509914  [ if not an image trigger ]
     Image S/N Ratio:    8.16

  Flight Position:   [ source = BAT ]
    RA: 54.651507189025   Dec: -33.7719895589748  [deg; J2000]


  Partial Coding Fraction:     [ including projection effects ]


  Angular difference between Flight and Ground position is 0.000000 arcmin

  Partial Coding Fraction:     [ including projection effects ]

  Duration
     T90: 16.3839999437332 +/-
        Measured from: 0
                   to: 16.3839999437332     [s; relative to TRIGTIME]
     T50: 16.3839999437332 +/-
        Measured from: 0
                   to: 16.3839999437332     [s; relative to TRIGTIME]

    WARNING: battblocks failed.  Used TDRSS fore/background intervals

  Fluence
     Peak Flux  (peak 16.3839999437332 second)
        Measured from: 5.96046447753906e-08
                   to: 16.3840000033379     [s; relative to TRIGTIME]
     Total Fluence
        Measured from: 0
                   to: 16.3839999437332     [s; relative to TRIGTIME]

             Band 1     Band 2     Band 3     Band 4
              15-25      25-50     50-100    100-350     keV
 Total     WARNING: could not be found
 Peak      WARNING: could not be found

     [ fluence units of on-axis counts / fully illuminated detector ]

======================================================================

=== Fluence/Peak Flux Summary ===

              Model    Band1    Band2    Band3    Band4    Band5    Total
                       15-25    25-50   50-100  100-350   15-150   15-350   keV
Fluence   Power-law -------- -------- -------- -------- -------- --------   erg/cm2
              Error -------- -------- -------- -------- -------- --------   erg/cm2
Peak flux Power-law -------- -------- -------- -------- -------- --------   ph/cm2/s
              Error -------- -------- -------- -------- -------- --------   ph/cm2/s

Fluence   Cutoff-PL -------- -------- -------- -------- -------- --------   erg/cm2
              Error -------- -------- -------- -------- -------- --------   erg/cm2
Peak flux Cutoff-PL -------- -------- -------- -------- -------- --------   ph/cm2/s
              Error -------- -------- -------- -------- -------- --------   ph/cm2/s

Fluence        Band -------- -------- -------- -------- -------- --------   erg/cm2
              Error -------- -------- -------- -------- -------- --------   erg/cm2
Peak flux      Band -------- -------- -------- -------- -------- --------   ph/cm2/s
              Error -------- -------- -------- -------- -------- --------   ph/cm2/s
=== Time-averaged spectral analysis ===

Model Ph_index Ph_90err Epeak  Epeak_90err Norm     Nomr_90err chi2   dof
PL    0.000    0.000    -      -           0.00e+00 0.00e+00    0.000  0
CPL   0.000    0.000       0.0    0.0      0.00e+00 0.00e+00    0.000  0


=== 1-s peak spectral analysis ===

Model Ph_index Ph_90err Epeak  Epeak_90err Norm     Nomr_90err chi2   dof
PL    0.000    0.000    -      -           0.00e+00 0.00e+00    0.000  0
CPL   0.000    0.000       0.0    0.0      0.00e+00 0.00e+00    0.000  0

Model      : spectral model: simple power-law (PL) and cutoff power-law (CPL)
Ph_index   : photon index: E^-{Ph_index} (minus sign is not included in the index)
Ph_90err   : 90% error of the photon index
Epeak      : Epeak in keV
Epeak_90err: 90% error of Epeak
Norm       : normalization at 50 keV in PL model and at 1 keV in CPL model
Nomr_90err : 90% error of the normalization
chi2       : Chi-Squared
dof        : degree of freedom
=== T90/T50 calculation in the 50-300 keV band (BATSE band) using 64 ms lc ===

T90 in the 50-300 keV band: 0.000000 sec.
T50 in the 50-300 keV band: 0.000000 sec.
=== Table of the duration information ==

        Value   tstart    tstop
T100   16.384    0.000   16.384
T90    16.384    0.000   16.384
T50    16.384    0.000   16.384
Peak   16.384    0.000   16.384
Click here for the BAT GCN circular template
Special notes of this burst
Estimated redshift from machine learning (Ukwatta et al. 2016) - may take a few minutes to calcaulte
Image
Pre-slew 15-350 keV image (Event data; bkg subtracted)

Foreground time interval of the image:
Background time interval of the image:
Lightcurves
Notes:
- 1) All plots contain as much data as has been downloaded to date.
- 2) The mask-weighted light curves are using the flight position.
- 3) Multiple plots of different time binning/intervals are shown to cover all scenarios of short/long GRBs, rate/image triggers, and real/false positives.
- 4) For all the mask-weighted lightcurves, the y-axis units are counts/sec/det where a det is 0.4 x 0.4 = 0.16 sq cm.
- 5) The verticle lines correspond to following: green dotted lines are T50 interval, black dotted lines are T90 interval, blue solid line(s) is a spacecraft slew start time, and orange solid line(s) is a spacecraft slew end time.
- 6) Time of each bin is in the middle of the bin.
1 s binning
From T0-310 s to T0+310 s
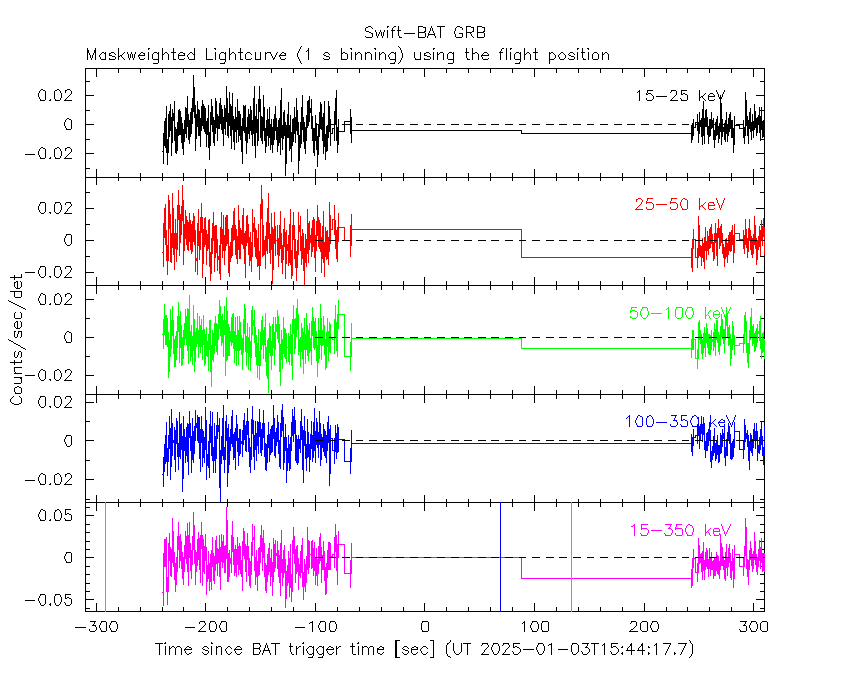
From T100_start - 20 s to T100_end + 30 s
Full time interval
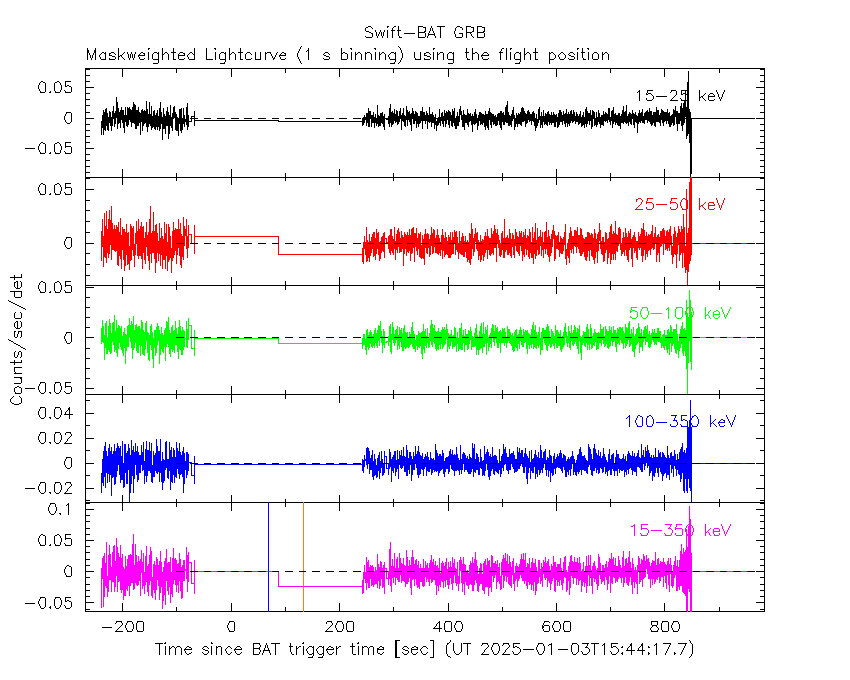
64 ms binning
Full time interval

From T100_start to T100_end
From T0-5 sec to T0+5 sec

16 ms binning
From T100_start-5 s to T100_start+5 s

8 ms binning
From T100_start-3 s to T100_start+3 s

2 ms binning
From T100_start-1 s to T100_start+1 s

SN=5 or 10 sec. binning (whichever binning is satisfied first)

SN=5 or 10 sec. binning (T < 200 sec)

Spectra
Notes:
- 1) The fitting includes the systematic errors.
- 2) For long bursts, a spectral fit of the pre-slew DRM will introduce some errors in both a spectral shape and a normalization if the PHA file contains a lot of the slew/post-slew time interval.
- 3) For fits to more complicated models (e.g. a power-law over a cutoff power-law), the BAT team has decided to require a chi-square improvement of more than 6 for each extra dof.
- 4) For short bursts (T90<1sec), the specrtum is also fit with Blackbody, OTTB, and Double Blackbody.
Time averaged spectrum fit using the pre-slew DRM
Power-law model

Multiple GTIs in the spectrum
tstart tstop
Cutoff power-law model

Multiple GTIs in the spectrum
tstart tstop
Band function

Multiple GTIs in the spectrum
tstart tstop
Single BB

Thermal bremsstrahlung (OTTB)

Double BB

Peak spectrum fit
Power-law model

Time interval is from 0.000 sec. to 0.000 sec.
Cutoff power-law model

Time interval is from 0.000 sec. to 0.000 sec.
Band function

Time interval is from 0.000 sec. to 0.000 sec.
Single BB

Thermal bremsstrahlung (OTTB)

Double BB

Pre-slew spectrum (Pre-slew PHA with pre-slew DRM)
Power-law model

Cutoff power-law model

Band function

S(25-50 keV) vs. S(50-100 keV) plot

S(25-50 keV)  = --------
S(50-100 keV) = --------
T90 vs. Hardness ratio plot

T90                                   = 16.3839999437332 sec.
Hardness ratio (energy fluence ratio) =
Color vs. Color plot

Count Ratio  (25-50 keV) / (15-25 keV) =
Count Ratio (50-100 keV) / (15-25 keV) =
Mask shadow pattern

IMX = 0, IMY = 0
TIME vs. PHA plot around the trigger time

TIME vs. DetID plot around the trigger time

100 us light curve (15-350 keV)

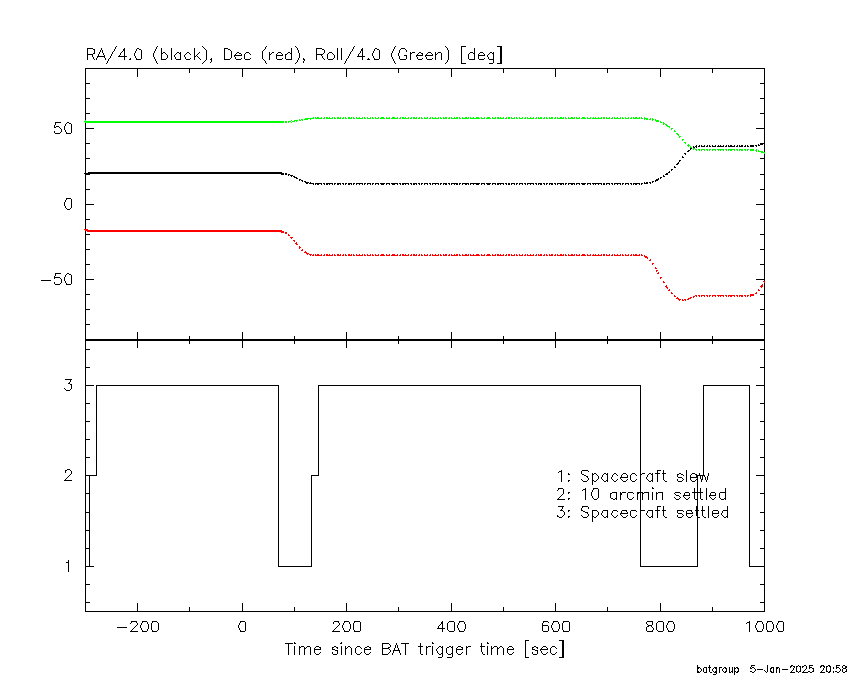
Spacecraft aspect plot
Bright source in the pre-burst/pre-slew/post-slew images
Pre-burst image of 15-350 keV band
Time interval of the image:
-239.544000 -85.507500
-83.544000 -77.833500
-76.544000 -76.417500
-75.544000 -75.273800
-71.544000 -71.049900
-68.544000 -66.668800

# RAcent  DECcent POSerr Theta    Phi  PeakCts   SNR AngSep     Name
#  [deg]    [deg]    ['] [deg]  [deg]                   [']
 83.6196  22.0287    1.5  40.0   55.3   5.5682   7.9    1.1	Crab
135.4422 -40.5802    6.5  51.2 -179.5   1.2650   1.8    4.2	Vela X-1
124.3686  -2.4855    2.2  44.6  127.2   6.4510   5.3 ------	UNKNOWN
130.5065 -38.8193    3.5  47.1  179.2   1.9403   3.4 ------	UNKNOWN
 95.7811 -58.0642    2.4  41.5 -138.9   1.9892   4.8 ------	UNKNOWN
Pre-slew background subtracted image of 15-350 keV band
Time interval of the image:
Post-slew image of 15-350 keV band
Time interval of the image:
242.456000 246.085200
248.456000 283.686400
284.456000 285.110700
290.456000 762.656590

# RAcent  DECcent POSerr Theta    Phi  PeakCts   SNR AngSep     Name
#  [deg]    [deg]    ['] [deg]  [deg]                   [']
 72.3515  -6.1546    2.9  32.1   77.5   5.2228   4.0 ------	UNKNOWN
 41.3105   8.3831    2.5  44.0   23.7   4.6412   4.6 ------	UNKNOWN
 24.5521  -1.4064    2.6  42.9   -4.6   4.7406   4.4 ------	UNKNOWN
117.4975 -71.0923    2.4  49.6 -159.5   6.4637   4.8 ------	UNKNOWN
 11.7935 -43.7442    2.7  34.4  -76.9   4.7478   4.4 ------	UNKNOWN
Plot creation:
Sun Jan  5 20:58:15 EST 2025


