Estimated redshift from machine learning (Ukwatta et al. 2016) - may take a few minute to calcaulte
Image
Pre-slew 15.0-350.0 keV image (Event data)
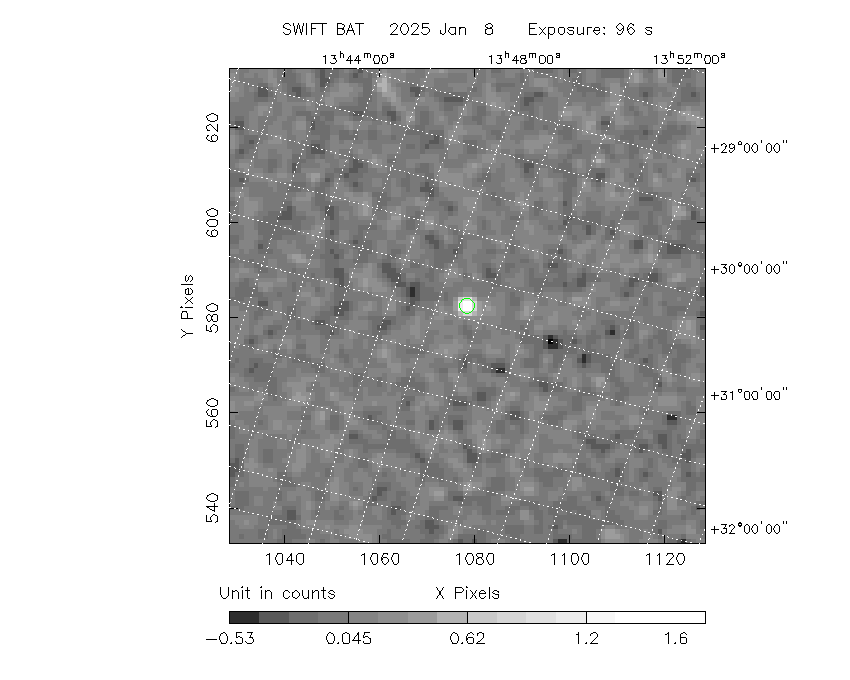
#   RAcent    DECcent   POSerr    Theta     Phi              Peak Cts       SNR   Name
  201.3113    25.6239   0.0147    25.3208  -151.9481         1.8900647     13.074 TRIG_01280056

Foreground time interval of the image:
-63.136  34.645 (delta_t =  97.781 [sec])
Background time interval of the image:
-239.056 -63.136 (delta_t = 175.920 [sec])
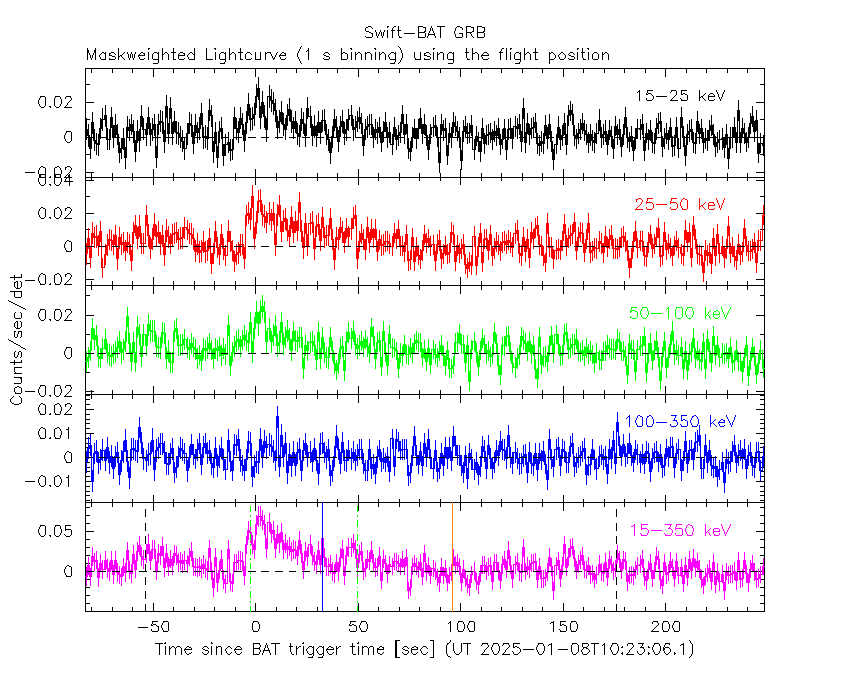
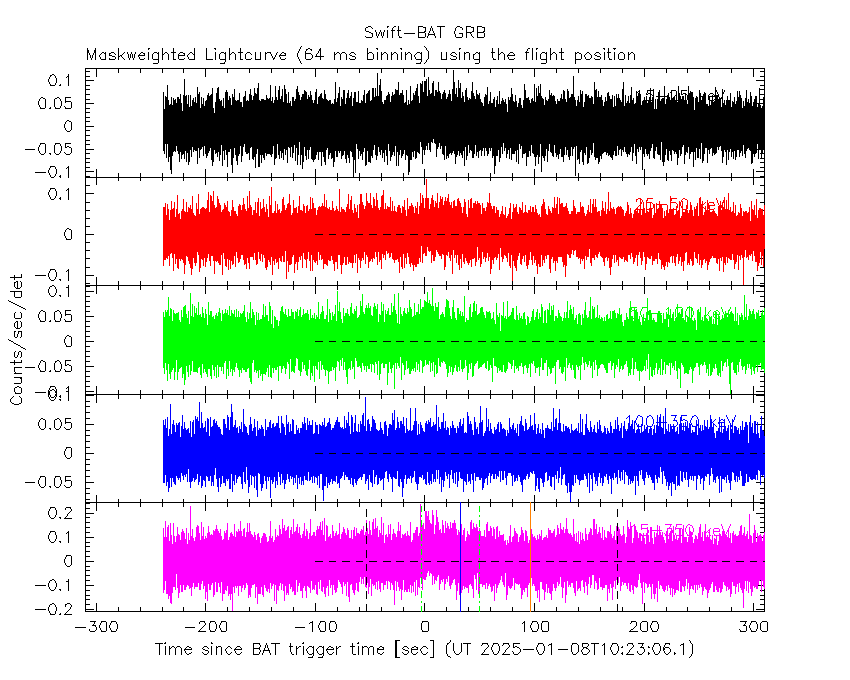
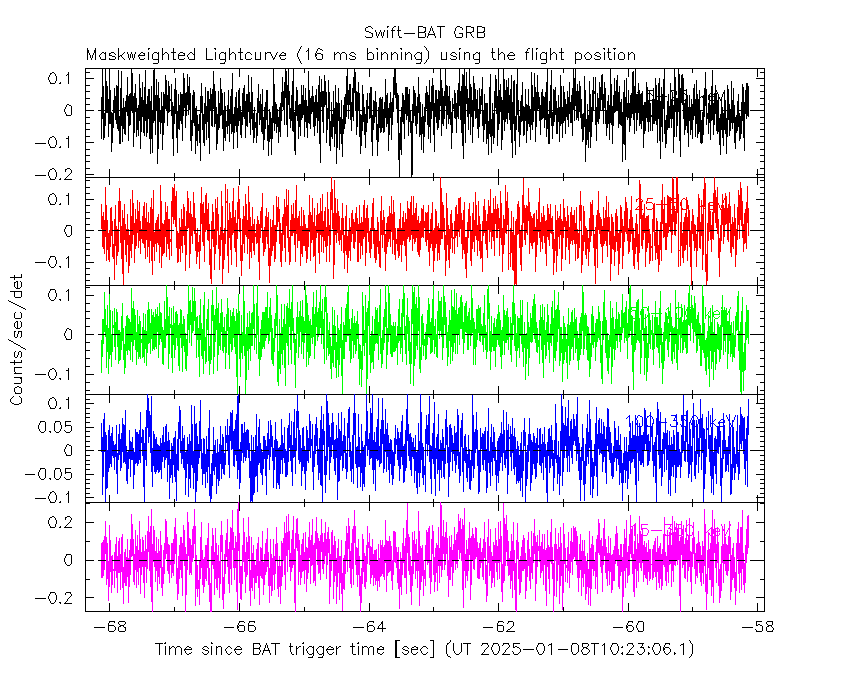
Lightcurves
Notes:
- 1) The mask-weighted light curves are using the flight position.
- 2) Multiple plots of different time binning/intervals are shown to cover all scenarios of short/long GRBs, rate/image triggers, and real/false positives.
- 3) For all the mask-weighted lightcurves, the y-axis units are counts/sec/det where a det is 0.4 x 0.4 = 0.16 sq cm.
- 4) The verticle lines correspond to following: green dotted lines are T50 interval, black dotted lines are T90 interval, blue solid line(s) is a spacecraft slew start time, and orange solid line(s) is a spacecraft slew end time.
- 5) Time of each bin is in the middle of the bin.
1 s binning
From T0-310 s to T0+310 s

From T100_start - 20 s to T100_end + 30 s
Full time interval

64 ms binning
Full time interval
From T100_start to T100_end

From T0-5 sec to T0+5 sec

16 ms binning
From T100_start-5 s to T100_start+5 s
Blue+Cyan dotted lines: Time interval of the scaled map
From 0.000000 to 4.096000
8 ms binning
From T100_start-3 s to T100_start+3 s

Blue+Cyan dotted lines: Time interval of the scaled map
From 0.000000 to 4.096000
2 ms binning
From T100_start-1 s to T100_start+1 s
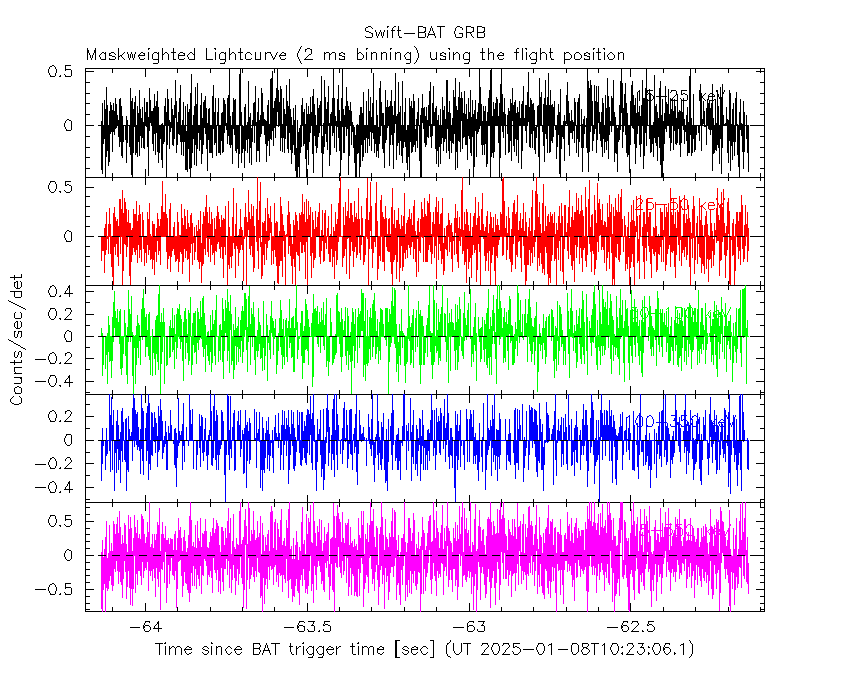
Blue+Cyan dotted lines: Time interval of the scaled map
From 0.000000 to 4.096000
SN=5 or 10 sec. binning (whichever binning is satisfied first)

SN=5 or 10 sec. binning (T < 200 sec)

Quad-rate summed light curves (from T0-300s to T0+1000s)

Spectral Evolution

Spectra
Notes:
- 1) The fitting includes the systematic errors.
- 2) When the burst includes telescope slew time periods, the fitting uses an average response file made from multiple 5-s response files through out the slew time plus single time preiod for the non-slew times, and weighted by the total counts in the corresponding time period using addrmf. An average response file is needed becuase a spectral fit using the pre-slew DRM will introduce some errors in both a spectral shape and a normalization if the PHA file contains a lot of the slew/post-slew time interval.
- 3) For fits to more complicated models (e.g. a power-law over a cutoff power-law), the BAT team has decided to require a chi-square improvement of more than 6 for each extra dof.
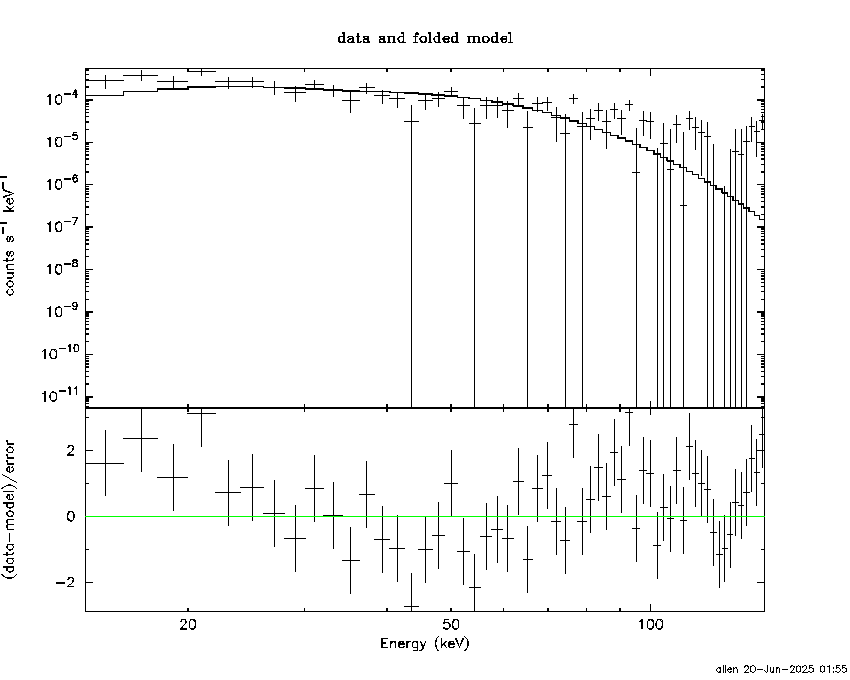
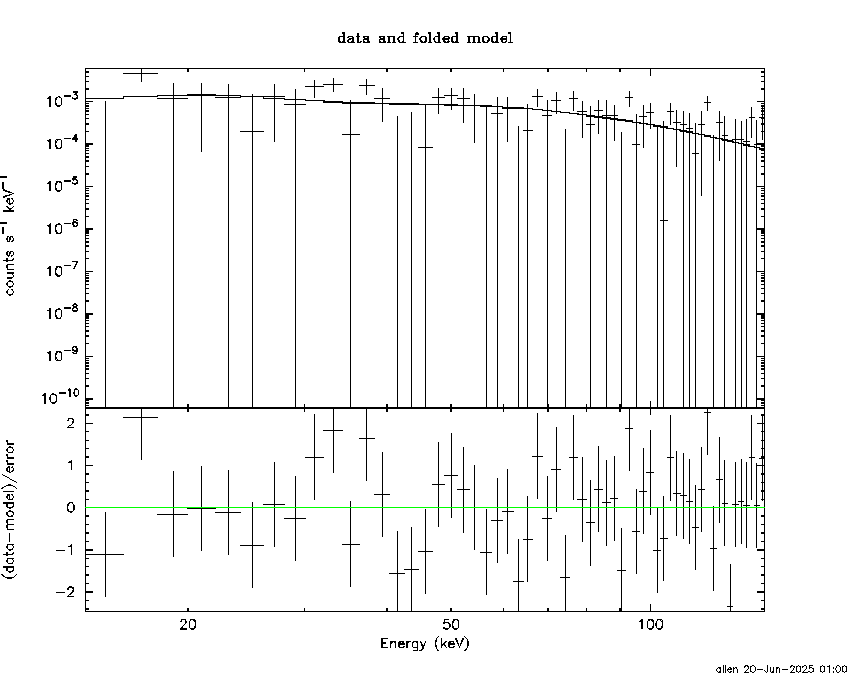
Time averaged spectrum fit using the average DRM
Power-law model

Time interval is from  -63.136 sec. to  218.208 sec.

Spectral model in power-law:
------------------------------------------------------------
Parameters  : value       lower 90%   higher 90%
Photon index: 1.62411     ( -0.188932   0.192729 )
Norm@50keV  : 6.42983E-04    ( -7.12043e-05   7.00916e-05 )
------------------------------------------------------------
#Fit statistic  : Chi-Squared                   62.96     using 59 bins.
 Reduced chi-squared = 1.10456
# Null hypothesis probability of 2.74e-01 with 57 degrees of freedom

Photon flux (15-150 keV)    in 281.3 sec: 8.32582E-02 ( -0.0085896  0.0086034 ) ph/cm2/s
Energy fluence (15-150 keV)             : 1.68702e-06 ( -2.00056e-07  2.02494e-07 ) ergs/cm2
Cutoff power-law model

Time interval is from  -63.136 sec. to  218.208 sec.
Spectral model in the cutoff power-law:
------------------------------------------------------------
Parameters  : value       lower 90%   higher 90%
Photon index: 1.62913     ( -0.19618   0.187791 )
Epeak [keV] : 9999.36      ( -9999.35 -9999.36 )
Norm@50keV  : 6.43321E-04    ( -0.000249105   0.000401045 )
------------------------------------------------------------
#Fit statistic  : Chi-Squared                   62.97     using 59 bins.
 Reduced chi-squared = 1.12446
# Null hypothesis probability of 2.43e-01 with 56 degrees of freedom

Photon flux (15-150 keV)    in 281.3 sec: 8.32551E-02 ( -0.008597  0.0085979 ) ph/cm2/s
Energy fluence (15-150 keV)             : 1.68659e-06 ( -2.00211e-07  2.02443e-07 ) ergs/cm2
Band function

Time interval is from  -63.136 sec. to  218.208 sec.


Spectral model in the Band function:
------------------------------------------------------------
Parameters  : value       lower 90%   higher 90%
alpha       :    (     )
beta        :     (     )
Epeak [keV] :       (   )
Norm@50keV   :     (     )
------------------------------------------------------------

Photon flux (15-150 keV)    in  sec:  (    ) ph/cm2/s
Energy fluence (15-150 keV)             : 0 ( 0  0 ) ergs/cm2
Single BB
Spectral model blackbody:
------------------------------------------------------------
Parameters  : value    Lower 90%  Upper 90%
kT [keV]    : 13.5219  (-2.1404  2.63978)
R^2/D10^2   : 1.27176E-02  (-0.00586944   0.0108742)
(R is the radius in km and D10 is the distance to the source in units of 10 kpc)
------------------------------------------------------------
#Fit statistic  : Chi-Squared                  102.74     using 59 bins.
 Reduced chi-squared =
# Null hypothesis probability of 1.96e-04 with 57 degrees of freedom

Energy  Fluence     90% Error
[keV]   [erg/cm2]   [erg/cm2]
15- 25  1.385e-07   2.989e-08
25- 50  4.974e-07   7.848e-08
50-150  5.879e-07   1.238e-07
15-150  1.224e-06   1.871e-07
Thermal bremsstrahlung (OTTB)
Spectral model: thermal bremsstrahlung
------------------------------------------------------------
Parameters  : value         Lower 90%    Upper 90%
kT [keV]    : 181.684       (-75.8447      -181.445)
Norm        : 0.336682       (-0.0358854     0.0431951)
------------------------------------------------------------
#Fit statistic  : Chi-Squared                   65.16     using 59 bins.
 Reduced chi-squared =
# Null hypothesis probability of 2.14e-01 with 57 degrees of freedom

Energy  Fluence     90% Error
[keV]   [erg/cm2]   [erg/cm2]
15- 25  2.386e-07   1.321e-07
25- 50  4.538e-07   2.423e-07
50-150  9.641e-07   5.304e-07
15-150  1.656e-06   8.876e-07
Double BB
Spectral model: bbodyrad<1> + bbodyrad<2>
------------------------------------------------------------
Parameters  : value         Lower 90%    Upper 90%
kT1 [keV]   : 5.84236        (-1.33472      1.60427)
R1^2/D10^2  : 0.200287        (-0.119106      0.368447)
kT2 [keV]   : 27.9265        (-6.75191      13.6899)
R2^2/D10^2  : 8.46773E-04    (-0.000599814   0.00134754)
------------------------------------------------------------
#Fit statistic  : Chi-Squared                   61.51     using 59 bins.
 Reduced chi-squared =
# Null hypothesis probability of 2.54e-01 with 55 degrees of freedom

Energy  Fluence     90% Error
[keV]   [erg/cm2]   [erg/cm2]
15- 25  2.760e-07   1.159e-07
25- 50  4.126e-07   1.295e-07
50-150  1.043e-06   5.020e-07
15-150  1.732e-06   6.512e-07
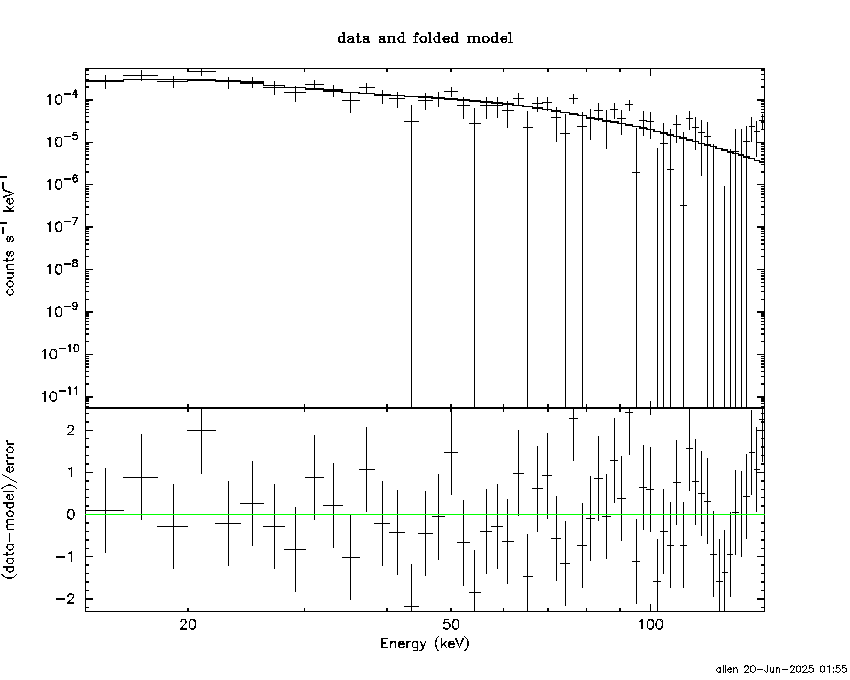
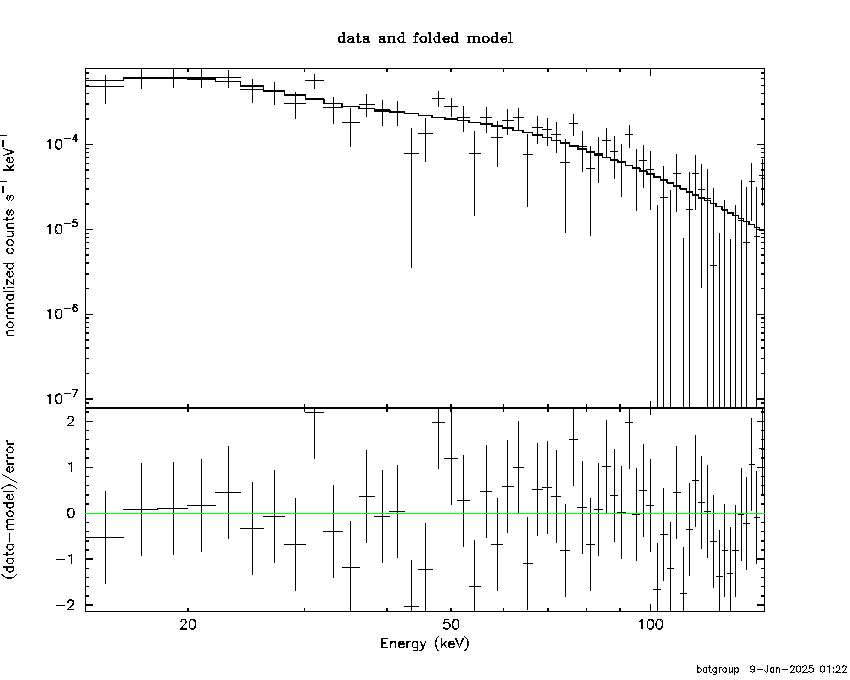
Peak spectrum fit
Power-law model

Time interval is from    1.556 sec. to    2.556 sec.

Spectral model in power-law:
------------------------------------------------------------
Parameters  : value       lower 90%   higher 90%
Photon index: 0.930293     ( -0.516423   0.447196 )
Norm@50keV  : 5.18943E-03    ( -0.00135007   0.0012785 )
------------------------------------------------------------
#Fit statistic  : Chi-Squared                   58.81     using 59 bins.
 Reduced chi-squared = 1.03175
# Null hypothesis probability of 4.09e-01 with 57 degrees of freedom

Photon flux (15-150 keV)    in 1 sec: 0.595897 ( -0.150571  0.151414 ) ph/cm2/s
Energy fluence (15-150 keV)             : 5.75732e-08 ( -1.43278e-08  1.43767e-08 ) ergs/cm2
Cutoff power-law model
Time interval is from    1.556 sec. to    2.556 sec.
Spectral model in the cutoff power-law:
------------------------------------------------------------
Parameters  : value       lower 90%   higher 90%
Photon index: 0.941807     ( -0.753484   0.434345 )
Epeak [keV] : 9999.36      ( -9999.36 -9999.36 )
Norm@50keV  : 5.23858E-03    ( -0.0012242   0.00805731 )
------------------------------------------------------------
#Fit statistic  : Chi-Squared                   58.83     using 59 bins.
 Reduced chi-squared = 1.05054
# Null hypothesis probability of 3.72e-01 with 56 degrees of freedom

Photon flux (15-150 keV)    in 1 sec: 0.595880 ( -0.150685  0.151283 ) ph/cm2/s
Energy fluence (15-150 keV)             : 5.75771e-08 ( -1.43556e-08  1.43661e-08 ) ergs/cm2
Band function

Time interval is from    1.556 sec. to    2.556 sec.


Spectral model in the Band function:
------------------------------------------------------------
Parameters  : value       lower 90%   higher 90%
alpha       :    (     )
beta        :     (     )
Epeak [keV] :       (   )
Norm@50keV   :     (     )
------------------------------------------------------------

Photon flux (15-150 keV)    in  sec:  (    ) ph/cm2/s
Energy fluence (15-150 keV)             : 0 ( 0  0 ) ergs/cm2
Single BB

Spectral model blackbody:
------------------------------------------------------------
Parameters  : value    Lower 90%  Upper 90%
kT [keV]    : 28.4696  (-9.9604  23.2802)
R^2/D10^2   : 9.48442E-03  (-0.00939005   0.0260057)
(R is the radius in km and D10 is the distance to the source in units of 10 kpc)
------------------------------------------------------------
#Fit statistic  : Chi-Squared                   65.14     using 59 bins.
 Reduced chi-squared =
# Null hypothesis probability of 2.15e-01 with 57 degrees of freedom

Energy  Fluence     90% Error
[keV]   [erg/cm2]   [erg/cm2]
15- 25  1.241e-09   7.880e-10
25- 50  7.489e-09   4.477e-09
50-150  4.368e-08   2.550e-08
15-150  5.241e-08   3.085e-08
Thermal bremsstrahlung (OTTB)

Spectral model: thermal bremsstrahlung
------------------------------------------------------------
Parameters  : value         Lower 90%    Upper 90%
kT [keV]    : 200.000       (-72.5222      -200)
Norm        : 2.48387       (-0.619327     0.619327)
------------------------------------------------------------
#Fit statistic  : Chi-Squared                   64.70     using 59 bins.
 Reduced chi-squared =
# Null hypothesis probability of 2.26e-01 with 57 degrees of freedom

Energy  Fluence     90% Error
[keV]   [erg/cm2]   [erg/cm2]
15- 25  6.189e-09   3.691e-09
25- 50  1.191e-08   7.130e-09
50-150  2.611e-08   1.512e-08
15-150  4.420e-08   2.668e-08
Double BB

Spectral model: bbodyrad<1> + bbodyrad<2>
------------------------------------------------------------
Parameters  : value         Lower 90%    Upper 90%
kT1 [keV]   : 8.10134        (-3.90176      6.83685)
R1^2/D10^2  : 0.357712        (-0.298234      3.32375)
kT2 [keV]   : 65.9258        (-45.5436      -69.6769)
R2^2/D10^2  : 9.73120E-04    (-0.000763035   0.00625812)
------------------------------------------------------------
#Fit statistic  : Chi-Squared                   57.29     using 59 bins.
 Reduced chi-squared =
# Null hypothesis probability of 3.90e-01 with 55 degrees of freedom

Energy  Fluence     90% Error
[keV]   [erg/cm2]   [erg/cm2]
15- 25  4.654e-09   3.096e-09
25- 50  1.048e-08   5.885e-09
50-150  4.557e-08   2.409e-08
15-150  6.071e-08   3.064e-08
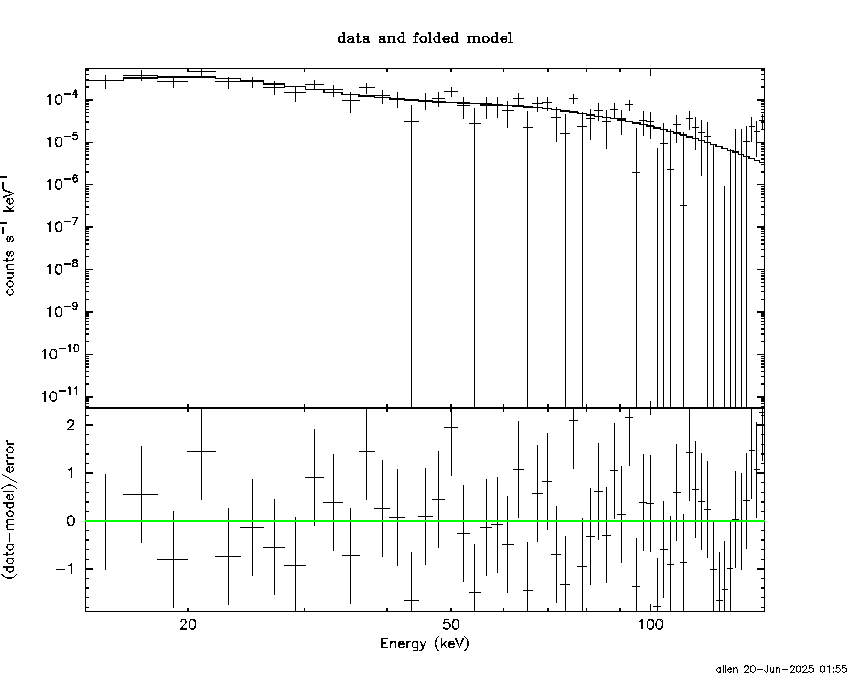
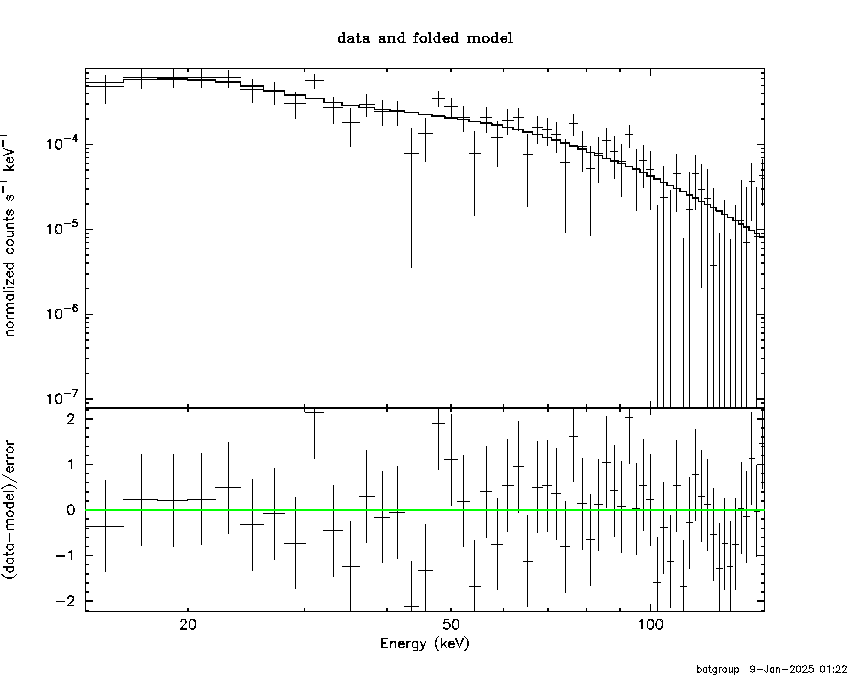
Pre-slew spectrum (Pre-slew PHA with pre-slew DRM)
Power-law model
Spectral model in power-law:
------------------------------------------------------------
Parameters  : value       lower 90%   higher 90%
Photon index: 1.56124     ( -0.156073   0.157967 )
Norm@50keV  : 1.35624E-03    ( -0.00012504   0.000124086 )
------------------------------------------------------------
#Fit statistic  : Chi-Squared                   47.85     using 59 bins.
 Reduced chi-squared =
# Null hypothesis probability of 8.01e-01 with 57 degrees of freedom

Photon flux (15-150 keV)    in 97.78 sec: 0.172257 ( -0.0154326  0.0154573 ) ph/cm2/s
Energy fluence (15-150 keV)             : 1.24646e-06 ( -1.2445e-07  1.25596e-07 ) ergs/cm2
Cutoff power-law model
Spectral model in the cutoff power-law:
------------------------------------------------------------
Parameters  : value       lower 90%   higher 90%
Photon index: 1.39302     ( -0.613821   0.309832 )
Epeak [keV] : 178.483      ( -178.482 -178.482 )
Norm@50keV  : 1.65438E-03    ( -0.000562324   0.00168417 )
------------------------------------------------------------
#Fit statistic  : Chi-Squared                   47.59     using 59 bins.
 Reduced chi-squared =
# Null hypothesis probability of 7.81e-01 with 56 degrees of freedom

Photon flux (15-150 keV)    in 97.78 sec: 0.170968 ( -0.016  0.015797 ) ph/cm2/s
Energy fluence (15-150 keV)             : 1.23094e-06 ( -6.88176e-08  1.3522e-07 ) ergs/cm2
Band function

Spectral model in the Band function:
------------------------------------------------------------
Parameters  : value       lower 90%   higher 90%
alpha       :    (     )
beta        :     (     )
Epeak [keV] :       (   )
Norm@50keV   :     (     )
------------------------------------------------------------

Photon flux (15-150 keV)    in  sec:  (    ) ph/cm2/s
Energy fluence (15-150 keV)             : 0 ( 0  0 ) ergs/cm2
S(25-50 keV) vs. S(50-100 keV) plot

S(25-50 keV)  = 4.42e-07
S(50-100 keV) = 5.74e-07
T90 vs. Hardness ratio plot

T90                                   = 218.111999988556 sec.
Hardness ratio (energy fluence ratio) = 1.29864
Color vs. Color plot

Count Ratio  (25-50 keV) / (15-25 keV) = 1.04545
Count Ratio (50-100 keV) / (15-25 keV) = 0.784496
Mask shadow pattern

IMX = -4.175576600804364E-01, IMY = 2.225047426076106E-01
TIME vs. PHA plot around the trigger time

Blue+Cyan dotted lines: Time interval of the scaled map
From 0.000000 to 4.096000
TIME vs. DetID plot around the trigger time

Blue+Cyan dotted lines: Time interval of the scaled map
From 0.000000 to 4.096000
100 us light curve (15-350 keV)

Blue+Cyan dotted lines: Time interval of the scaled map
From 0.000000 to 4.096000
Spacecraft aspect plot

Bright source in the pre-burst/pre-slew/post-slew images
Pre-burst image of 15-350 keV band
Time interval of the image:
-239.056000 -63.136000

# RAcent  DECcent POSerr Theta    Phi  PeakCts   SNR AngSep     Name
#  [deg]    [deg]    ['] [deg]  [deg]                   [']
180.8333 -37.8027    2.6  44.9   -9.8   1.6485   4.4 ------	UNKNOWN
212.8918  38.3743    2.2  41.2 -156.6   1.9574   5.2 ------	UNKNOWN
203.8480 -45.7546    2.8  55.9  -29.8   5.1248   4.1 ------	UNKNOWN
230.2548  24.3532    3.0  48.1 -129.2   3.9254   3.9 ------	UNKNOWN
Pre-slew background subtracted image of 15-350 keV band
Time interval of the image:
-63.136000 34.644600

# RAcent  DECcent POSerr Theta    Phi  PeakCts   SNR AngSep     Name
#  [deg]    [deg]    ['] [deg]  [deg]                   [']
154.1209 -17.8547    2.7  38.1   36.3   1.0532   4.3 ------	UNKNOWN
201.3113  25.6239    0.9  25.3 -151.9   1.8896  13.1 ------	UNKNOWN
206.2216  -4.5894    2.3  25.6  -76.3   0.8496   5.0 ------	UNKNOWN
Post-slew image of 15-350 keV band
Time interval of the image:
96.044590 963.058300

# RAcent  DECcent POSerr Theta    Phi  PeakCts   SNR AngSep     Name
#  [deg]    [deg]    ['] [deg]  [deg]                   [']
254.3997  35.4475    5.4  46.2 -136.1  -5.5506  -2.1    6.9	Her X-1
255.9716  30.2195    2.7  48.1 -129.2  21.0531   4.3 ------	UNKNOWN
Plot creation:
Fri Jun 20 01:55:38 EDT 2025