Estimated redshift from machine learning (Ukwatta et al. 2016) - may take a few minute to calcaulte
Image
Pre-slew 15.0-350.0 keV image (Event data)

#   RAcent    DECcent   POSerr    Theta     Phi              Peak Cts       SNR   Name
  231.4229    -0.5465   0.0175    18.2395   -15.6573         0.1071848     11.043 TRIG_01285677

Foreground time interval of the image:
 -0.020   0.564 (delta_t =   0.584 [sec])
Background time interval of the image:
-239.696  -0.020 (delta_t = 239.676 [sec])
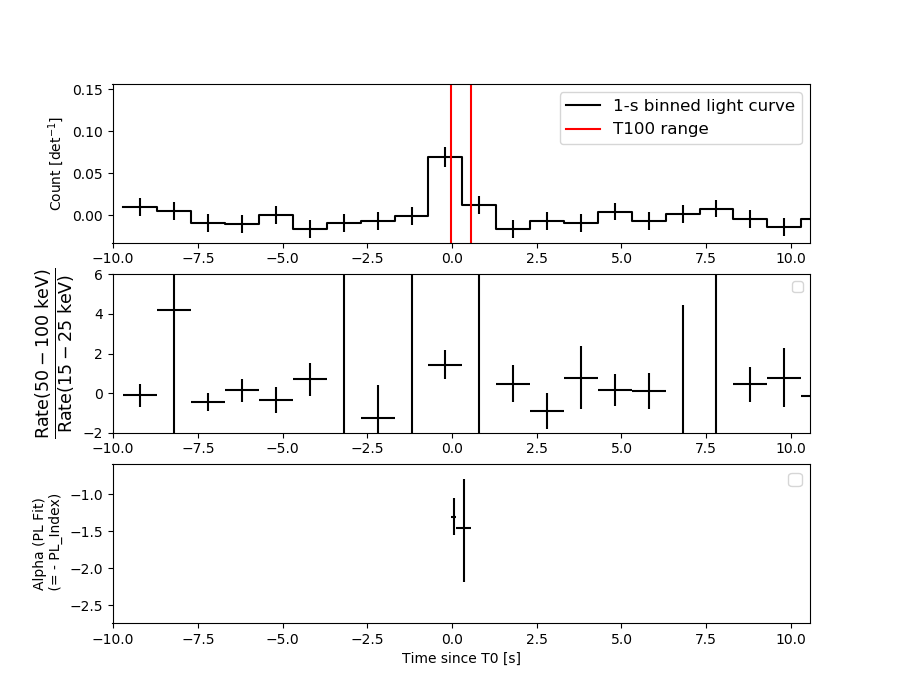
Lightcurves
Notes:
- 1) The mask-weighted light curves are using the flight position.
- 2) Multiple plots of different time binning/intervals are shown to cover all scenarios of short/long GRBs, rate/image triggers, and real/false positives.
- 3) For all the mask-weighted lightcurves, the y-axis units are counts/sec/det where a det is 0.4 x 0.4 = 0.16 sq cm.
- 4) The verticle lines correspond to following: green dotted lines are T50 interval, black dotted lines are T90 interval, blue solid line(s) is a spacecraft slew start time, and orange solid line(s) is a spacecraft slew end time.
- 5) Time of each bin is in the middle of the bin.
1 s binning
From T0-310 s to T0+310 s

From T100_start - 20 s to T100_end + 30 s

Full time interval

64 ms binning
Full time interval

From T100_start to T100_end

From T0-5 sec to T0+5 sec

16 ms binning
From T100_start-5 s to T100_start+5 s

Blue+Cyan dotted lines: Time interval of the scaled map
From 0.000000 to 0.064000
8 ms binning
From T100_start-3 s to T100_start+3 s

Blue+Cyan dotted lines: Time interval of the scaled map
From 0.000000 to 0.064000
2 ms binning
From T100_start-1 s to T100_start+1 s

Blue+Cyan dotted lines: Time interval of the scaled map
From 0.000000 to 0.064000
SN=5 or 10 sec. binning (whichever binning is satisfied first)

SN=5 or 10 sec. binning (T < 200 sec)
Quad-rate summed light curves (from T0-300s to T0+1000s)

Spectral Evolution
Spectra
Notes:
- 1) The fitting includes the systematic errors.
- 2) When the burst includes telescope slew time periods, the fitting uses an average response file made from multiple 5-s response files through out the slew time plus single time preiod for the non-slew times, and weighted by the total counts in the corresponding time period using addrmf. An average response file is needed becuase a spectral fit using the pre-slew DRM will introduce some errors in both a spectral shape and a normalization if the PHA file contains a lot of the slew/post-slew time interval.
- 3) For fits to more complicated models (e.g. a power-law over a cutoff power-law), the BAT team has decided to require a chi-square improvement of more than 6 for each extra dof.
Time averaged spectrum fit using the average DRM
Power-law model

Time interval is from   -0.020 sec. to    0.564 sec.

Spectral model in power-law:
------------------------------------------------------------
Parameters  : value       lower 90%   higher 90%
Photon index: 1.30271     ( -0.272629   0.274668 )
Norm@50keV  : 1.13863E-02    ( -0.0017251   0.00172233 )
------------------------------------------------------------
#Fit statistic  : Chi-Squared                   54.13     using 59 bins.
 Reduced chi-squared = 0.949649
# Null hypothesis probability of 5.83e-01 with 57 degrees of freedom

Photon flux (15-150 keV)    in 0.584 sec: 1.35912 ( -0.21049  0.21108 ) ph/cm2/s
Energy fluence (15-150 keV)             : 6.56737e-08 ( -1.11265e-08  1.12275e-08 ) ergs/cm2
Cutoff power-law model

Time interval is from   -0.020 sec. to    0.564 sec.
Spectral model in the cutoff power-law:
------------------------------------------------------------
Parameters  : value       lower 90%   higher 90%
Photon index: 1.30143     ( -0.429267   0.274201 )
Epeak [keV] : 9999.28      ( -9999.36 -9999.36 )
Norm@50keV  : 1.14248E-02    ( -0.00173417   0.0212233 )
------------------------------------------------------------
#Fit statistic  : Chi-Squared                   54.13     using 59 bins.
 Reduced chi-squared = 0.966607
# Null hypothesis probability of 5.46e-01 with 56 degrees of freedom

Photon flux (15-150 keV)    in 0.584 sec: 1.35890 ( -0.21048  0.21092 ) ph/cm2/s
Energy fluence (15-150 keV)             : 6.57584e-08 ( -1.15454e-08  9.59845e-09 ) ergs/cm2
Band function

Time interval is from   -0.020 sec. to    0.564 sec.


Spectral model in the Band function:
------------------------------------------------------------
Parameters  : value       lower 90%   higher 90%
alpha       :    (     )
beta        :     (     )
Epeak [keV] :       (   )
Norm@50keV   :     (     )
------------------------------------------------------------

Photon flux (15-150 keV)    in  sec:  (    ) ph/cm2/s
Energy fluence (15-150 keV)             : 0 ( 0  0 ) ergs/cm2
Single BB

Spectral model blackbody:
------------------------------------------------------------
Parameters  : value    Lower 90%  Upper 90%
kT [keV]    : 18.7110  (-3.64528  4.78153)
R^2/D10^2   : 7.55299E-02  (-0.0397788   0.0799717)
(R is the radius in km and D10 is the distance to the source in units of 10 kpc)
------------------------------------------------------------
#Fit statistic  : Chi-Squared                   65.83     using 59 bins.
 Reduced chi-squared =
# Null hypothesis probability of 1.98e-01 with 57 degrees of freedom

Energy  Fluence     90% Error
[keV]   [erg/cm2]   [erg/cm2]
15- 25  3.052e-09   9.969e-10
25- 50  1.452e-08   3.895e-09
50-150  3.724e-08   1.121e-08
15-150  5.482e-08   1.430e-08
Thermal bremsstrahlung (OTTB)

Spectral model: thermal bremsstrahlung
------------------------------------------------------------
Parameters  : value         Lower 90%    Upper 90%
kT [keV]    : 200.000       (-59.697      -200)
Norm        : 5.60833       (-0.85637     0.85637)
------------------------------------------------------------
#Fit statistic  : Chi-Squared                   57.11     using 59 bins.
 Reduced chi-squared =
# Null hypothesis probability of 4.71e-01 with 57 degrees of freedom

Energy  Fluence     90% Error
[keV]   [erg/cm2]   [erg/cm2]
15- 25  8.158e-09   4.637e-09
25- 50  1.569e-08   8.938e-09
50-150  3.442e-08   1.946e-08
15-150  5.827e-08   3.238e-08
Double BB

Spectral model: bbodyrad<1> + bbodyrad<2>
------------------------------------------------------------
Parameters  : value         Lower 90%    Upper 90%
kT1 [keV]   : 3.96313        (-2.4132      3.97314)
R1^2/D10^2  : 11.9346        (-11.1354      5425.94)
kT2 [keV]   : 24.2205        (-6.11927      22.1678)
R2^2/D10^2  : 2.97721E-02    (-0.0258743   0.0509678)
------------------------------------------------------------
#Fit statistic  : Chi-Squared                   54.42     using 59 bins.
 Reduced chi-squared =
# Null hypothesis probability of 4.97e-01 with 55 degrees of freedom

Energy  Fluence     90% Error
[keV]   [erg/cm2]   [erg/cm2]
15- 25  7.861e-09   4.150e-09
25- 50  1.218e-08   5.587e-09
50-150  4.392e-08   2.109e-08
15-150  6.397e-08   2.752e-08
Peak spectrum fit
Power-law model

Time interval is from   -0.226 sec. to    0.774 sec.

Spectral model in power-law:
------------------------------------------------------------
Parameters  : value       lower 90%   higher 90%
Photon index: 1.24759     ( -0.381345   0.375283 )
Norm@50keV  : 5.87643E-03    ( -0.00122446   0.00122444 )
------------------------------------------------------------
#Fit statistic  : Chi-Squared                   65.64     using 59 bins.
 Reduced chi-squared = 1.15158
# Null hypothesis probability of 2.02e-01 with 57 degrees of freedom

Photon flux (15-150 keV)    in 1 sec: 0.694757 ( -0.150371  0.151285 ) ph/cm2/s
Energy fluence (15-150 keV)             : 5.88545e-08 ( -1.34342e-08  1.35607e-08 ) ergs/cm2
Cutoff power-law model

Time interval is from   -0.226 sec. to    0.774 sec.
Spectral model in the cutoff power-law:
------------------------------------------------------------
Parameters  : value       lower 90%   higher 90%
Photon index: 2.48973     ( -3.22277   0.111546 )
Epeak [keV] : 159.304      (   )
Norm@50keV  : 1.27274E-03    (     )
------------------------------------------------------------
#Fit statistic  : Chi-Squared                   65.58     using 59 bins.
 Reduced chi-squared = 1.17107
# Null hypothesis probability of 1.79e-01 with 56 degrees of freedom

Photon flux (15-150 keV)    in 1 sec: 0.690232 ( -0.158075  0.154661 ) ph/cm2/s
Energy fluence (15-150 keV)             : 5.85113e-08 ( -1.4041e-08  1.37956e-08 ) ergs/cm2
Band function

Time interval is from   -0.226 sec. to    0.774 sec.


Spectral model in the Band function:
------------------------------------------------------------
Parameters  : value       lower 90%   higher 90%
alpha       :    (     )
beta        :     (     )
Epeak [keV] :       (   )
Norm@50keV   :     (     )
------------------------------------------------------------

Photon flux (15-150 keV)    in  sec:  (    ) ph/cm2/s
Energy fluence (15-150 keV)             : 0 ( 0  0 ) ergs/cm2
Single BB

Spectral model blackbody:
------------------------------------------------------------
Parameters  : value    Lower 90%  Upper 90%
kT [keV]    : 19.5689  (-4.68437  6.89944)
R^2/D10^2   : 3.40688E-02  (-0.0214033   0.0508804)
(R is the radius in km and D10 is the distance to the source in units of 10 kpc)
------------------------------------------------------------
#Fit statistic  : Chi-Squared                   69.86     using 59 bins.
 Reduced chi-squared =
# Null hypothesis probability of 1.18e-01 with 57 degrees of freedom

Energy  Fluence     90% Error
[keV]   [erg/cm2]   [erg/cm2]
15- 25  2.536e-09   1.107e-09
25- 50  1.245e-08   4.426e-09
50-150  3.523e-08   1.711e-08
15-150  5.022e-08   2.158e-08
Thermal bremsstrahlung (OTTB)

Spectral model: thermal bremsstrahlung
------------------------------------------------------------
Parameters  : value         Lower 90%    Upper 90%
kT [keV]    : 200.000       (-79.7122      -200)
Norm        : 2.89058       (-0.612979     0.612979)
------------------------------------------------------------
#Fit statistic  : Chi-Squared                   67.74     using 59 bins.
 Reduced chi-squared =
# Null hypothesis probability of 1.56e-01 with 57 degrees of freedom

Energy  Fluence     90% Error
[keV]   [erg/cm2]   [erg/cm2]
15- 25  7.198e-09   4.229e-09
25- 50  1.385e-08   8.045e-09
50-150  3.037e-08   1.733e-08
15-150  5.141e-08   3.005e-08
Double BB

Spectral model: bbodyrad<1> + bbodyrad<2>
------------------------------------------------------------
Parameters  : value         Lower 90%    Upper 90%
kT1 [keV]   : 1.69839        (-1.1613      4.16815)
R1^2/D10^2  : 1635.33        (-1633      -1633.92)
kT2 [keV]   : 21.5291        (-5.29984      8.42275)
R2^2/D10^2  : 2.40918E-02    (-0.0157841   0.0354536)
------------------------------------------------------------
#Fit statistic  : Chi-Squared                   63.31     using 59 bins.
 Reduced chi-squared =
# Null hypothesis probability of 2.07e-01 with 55 degrees of freedom

Energy  Fluence     90% Error
[keV]   [erg/cm2]   [erg/cm2]
15- 25  5.296e-09   2.383e-09
25- 50  1.093e-08   6.388e-09
50-150  3.769e-08   1.947e-08
15-150  5.392e-08   2.341e-08
Pre-slew spectrum (Pre-slew PHA with pre-slew DRM)
Power-law model

Spectral model in power-law:
------------------------------------------------------------
Parameters  : value       lower 90%   higher 90%
Photon index: 1.30271     ( -0.272629   0.274668 )
Norm@50keV  : 1.13863E-02    ( -0.0017251   0.00172233 )
------------------------------------------------------------
#Fit statistic  : Chi-Squared                   54.13     using 59 bins.
 Reduced chi-squared =
# Null hypothesis probability of 5.83e-01 with 57 degrees of freedom

Photon flux (15-150 keV)    in 0.584 sec: 1.35910 ( -0.210484  0.211072 ) ph/cm2/s
Energy fluence (15-150 keV)             : 6.56679e-08 ( -1.11266e-08  1.123e-08 ) ergs/cm2
Cutoff power-law model
Spectral model in the cutoff power-law:
------------------------------------------------------------
Parameters  : value       lower 90%   higher 90%
Photon index: 1.30029     ( -0.426514   0.274673 )
Epeak [keV] : 9999.28      ( -9999.36 -9999.36 )
Norm@50keV  : 1.14269E-02    ( -0.00173394   0.0212228 )
------------------------------------------------------------
#Fit statistic  : Chi-Squared                   54.13     using 59 bins.
 Reduced chi-squared =
# Null hypothesis probability of 5.46e-01 with 56 degrees of freedom

Photon flux (15-150 keV)    in 0.584 sec: 1.35984 ( -0.21257  0.20941 ) ph/cm2/s
Energy fluence (15-150 keV)             : 6.55844e-08 ( -1.1238e-08  1.12753e-08 ) ergs/cm2
Band function

Spectral model in the Band function:
------------------------------------------------------------
Parameters  : value       lower 90%   higher 90%
alpha       :    (     )
beta        :     (     )
Epeak [keV] :       (   )
Norm@50keV   :     (     )
------------------------------------------------------------

Photon flux (15-150 keV)    in  sec:  (    ) ph/cm2/s
Energy fluence (15-150 keV)             : 0 ( 0  0 ) ergs/cm2
S(25-50 keV) vs. S(50-100 keV) plot

S(25-50 keV)  = 1.47e-08
S(50-100 keV) = 2.37e-08
T90 vs. Hardness ratio plot

T90                                   = 0.483999967575073 sec.
Hardness ratio (energy fluence ratio) = 1.61224
Color vs. Color plot

Count Ratio  (25-50 keV) / (15-25 keV) = 1.50775
Count Ratio (50-100 keV) / (15-25 keV) = 1.29388
Mask shadow pattern

IMX = 3.173179519661429E-01, IMY = 8.893923559529868E-02
TIME vs. PHA plot around the trigger time

Blue+Cyan dotted lines: Time interval of the scaled map
From 0.000000 to 0.064000
TIME vs. DetID plot around the trigger time

Blue+Cyan dotted lines: Time interval of the scaled map
From 0.000000 to 0.064000
100 us light curve (15-350 keV)

Blue+Cyan dotted lines: Time interval of the scaled map
From 0.000000 to 0.064000
Spacecraft aspect plot

Bright source in the pre-burst/pre-slew/post-slew images
Pre-burst image of 15-350 keV band
Time interval of the image:
-239.696000 -0.020000

# RAcent  DECcent POSerr Theta    Phi  PeakCts   SNR AngSep     Name
#  [deg]    [deg]    ['] [deg]  [deg]                   [']
244.9653 -15.6139    0.7  35.9  -38.3   7.4206  16.1    1.8	Sco X-1
254.4526  35.3770    2.0  27.0 -151.1   2.1396   5.9    2.1	Her X-1
190.4125  41.7204    2.8  42.4  117.7   8.1128   4.1 ------	UNKNOWN
208.6265  13.2670    2.6  22.4   66.1   1.6731   4.5 ------	UNKNOWN
211.2108  10.6144    2.8  20.8   57.1   1.4870   4.1 ------	UNKNOWN
211.1897 -18.6552    2.7  41.4   14.0   2.4152   4.3 ------	UNKNOWN
266.0223   0.7583    2.6  38.0  -83.0   4.1684   4.5 ------	UNKNOWN
Pre-slew background subtracted image of 15-350 keV band
Time interval of the image:
-0.020000 0.564000

# RAcent  DECcent POSerr Theta    Phi  PeakCts   SNR AngSep     Name
#  [deg]    [deg]    ['] [deg]  [deg]                   [']
244.9728 -15.5537    5.0  35.8  -38.4  -0.0308  -2.3    5.2	Sco X-1
254.5484  35.1666    4.1  27.0 -150.7  -0.0286  -2.8   11.5	Her X-1
231.4230  -0.5465    1.0  18.2  -15.7   0.1072  11.0 ------	UNKNOWN
224.3981 -39.6229    2.3  57.7   -9.3   0.2446   5.1 ------	UNKNOWN
Post-slew image of 15-350 keV band
Time interval of the image:
61.804600 962.343900

# RAcent  DECcent POSerr Theta    Phi  PeakCts   SNR AngSep     Name
#  [deg]    [deg]    ['] [deg]  [deg]                   [']
244.9698 -15.6420    0.6  20.2  -58.9  28.3538  20.2    0.6	Sco X-1
254.4155  35.3876    5.7  41.8 -169.5   3.8080   2.0    3.4	Her X-1
255.7991 -37.9715    7.3  43.6  -46.1   4.8879   1.6   11.7	4U 1700-377
256.3950 -36.5521    9.9  42.8  -47.9   3.2943   1.2    8.0	GX 349+2
263.1782 -24.7344   87.8  39.1  -67.3  -0.3900  -0.1    9.2	GX 1+4
268.4963  -1.5489   15.0  37.1 -106.1   2.4761   0.8    9.6	SW J1753.5-0127
262.9341 -33.8593   64.9  44.5  -56.3  -0.8567  -0.2    3.1	GX 354-0
199.0337  28.3517    2.6  42.4  117.6  32.8256   4.5 ------	UNKNOWN
201.6871  -1.8943    3.0  29.7   69.1   8.4220   3.8 ------	UNKNOWN
223.3815 -51.9339    2.5  51.8  -11.7  11.5457   4.6 ------	UNKNOWN
227.8000 -56.1899    2.1  55.7  -15.6  16.6849   5.5 ------	UNKNOWN
Plot creation:
Fri Jun 20 01:53:55 EDT 2025