Estimated redshift from machine learning (Ukwatta et al. 2016) - may take a few minute to calcaulte
Image
Pre-slew 15.0-350.0 keV image (Event data)
#   RAcent    DECcent   POSerr    Theta     Phi              Peak Cts       SNR   Name
  198.7003     5.0262   0.0137    27.3282     1.1866         2.6138861     14.061 TRIG_01285812

Foreground time interval of the image:
-62.544  74.301 (delta_t = 136.845 [sec])
Background time interval of the image:
-239.000 -62.544 (delta_t = 176.456 [sec])
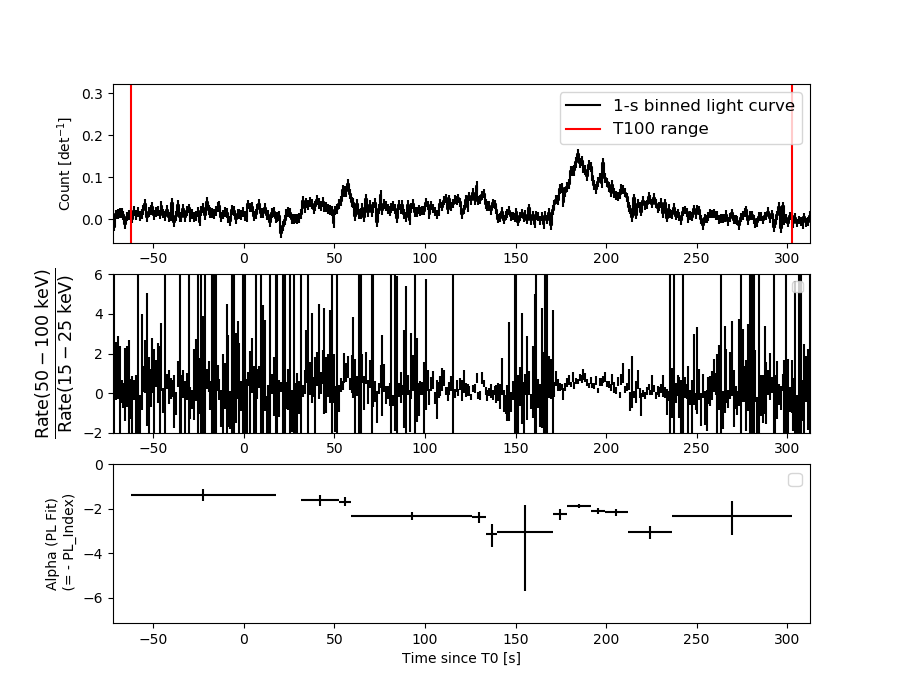
Lightcurves
Notes:
- 1) The mask-weighted light curves are using the flight position.
- 2) Multiple plots of different time binning/intervals are shown to cover all scenarios of short/long GRBs, rate/image triggers, and real/false positives.
- 3) For all the mask-weighted lightcurves, the y-axis units are counts/sec/det where a det is 0.4 x 0.4 = 0.16 sq cm.
- 4) The verticle lines correspond to following: green dotted lines are T50 interval, black dotted lines are T90 interval, blue solid line(s) is a spacecraft slew start time, and orange solid line(s) is a spacecraft slew end time.
- 5) Time of each bin is in the middle of the bin.
1 s binning
From T0-310 s to T0+310 s
From T100_start - 20 s to T100_end + 30 s
Full time interval
64 ms binning
Full time interval
From T100_start to T100_end
From T0-5 sec to T0+5 sec
16 ms binning
From T100_start-5 s to T100_start+5 s
8 ms binning
From T100_start-3 s to T100_start+3 s
2 ms binning
From T100_start-1 s to T100_start+1 s
SN=5 or 10 sec. binning (whichever binning is satisfied first)
SN=5 or 10 sec. binning (T < 200 sec)
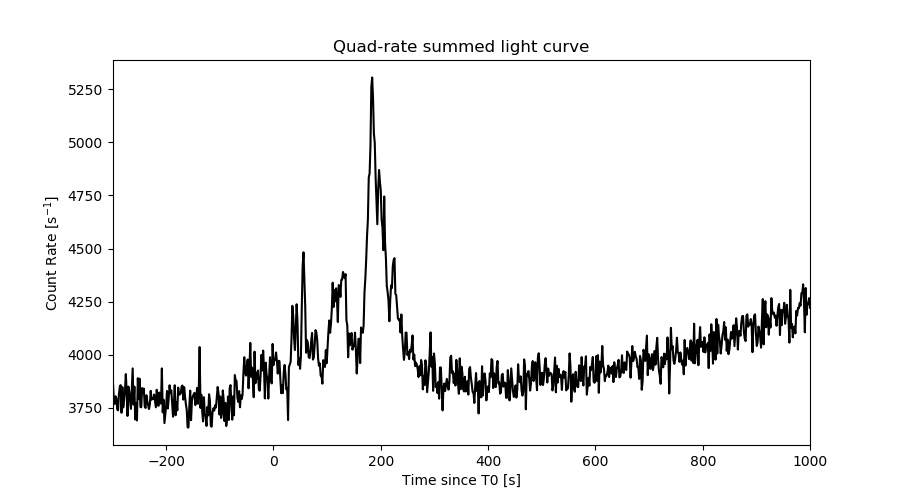
Quad-rate summed light curves (from T0-300s to T0+1000s)
Spectral Evolution
Spectra
Notes:
- 1) The fitting includes the systematic errors.
- 2) When the burst includes telescope slew time periods, the fitting uses an average response file made from multiple 5-s response files through out the slew time plus single time preiod for the non-slew times, and weighted by the total counts in the corresponding time period using addrmf. An average response file is needed becuase a spectral fit using the pre-slew DRM will introduce some errors in both a spectral shape and a normalization if the PHA file contains a lot of the slew/post-slew time interval.
- 3) For fits to more complicated models (e.g. a power-law over a cutoff power-law), the BAT team has decided to require a chi-square improvement of more than 6 for each extra dof.
Time averaged spectrum fit using the average DRM
Power-law model
Time interval is from  -62.544 sec. to  302.624 sec.

Spectral model in power-law:
------------------------------------------------------------
Parameters  : value       lower 90%   higher 90%
Photon index: 2.13848     ( -0.0870656   0.0887688 )
Norm@50keV  : 1.42137E-03    ( -7.34603e-05   7.27364e-05 )
------------------------------------------------------------
#Fit statistic  : Chi-Squared                   55.99     using 59 bins.
 Reduced chi-squared = 0.982281
# Null hypothesis probability of 5.13e-01 with 57 degrees of freedom

Photon flux (15-150 keV)    in 365.2 sec: 0.227981 ( -0.010137  0.010167 ) ph/cm2/s
Energy fluence (15-150 keV)             : 4.84328e-06 ( -2.23721e-07  2.2535e-07 ) ergs/cm2
Cutoff power-law model
Time interval is from  -62.544 sec. to  302.624 sec.
Spectral model in the cutoff power-law:
------------------------------------------------------------
Parameters  : value       lower 90%   higher 90%
Photon index: 1.98570     ( -0.375234   0.014793 )
Epeak [keV] : 4.03456      ( -1.75172 31.6958 )
Norm@50keV  : 1.72848E-03    ( -0.000148797   0.00103778 )
------------------------------------------------------------
#Fit statistic  : Chi-Squared                   55.25     using 59 bins.
 Reduced chi-squared = 0.986607
# Null hypothesis probability of 5.03e-01 with 56 degrees of freedom

Photon flux (15-150 keV)    in 365.2 sec: 0.227787 ( -0.010019  0.010428 ) ph/cm2/s
Energy fluence (15-150 keV)             : 4.7572e-06 ( -2.85009e-07  2.47988e-07 ) ergs/cm2
Band function

Time interval is from  -62.544 sec. to  302.624 sec.


Spectral model in the Band function:
------------------------------------------------------------
Parameters  : value       lower 90%   higher 90%
alpha       :    (     )
beta        :     (     )
Epeak [keV] :       (   )
Norm@50keV   :     (     )
------------------------------------------------------------

Photon flux (15-150 keV)    in  sec:  (    ) ph/cm2/s
Energy fluence (15-150 keV)             : 0 ( 0  0 ) ergs/cm2
Single BB
Spectral model blackbody:
------------------------------------------------------------
Parameters  : value    Lower 90%  Upper 90%
kT [keV]    : 9.61500  (  )
R^2/D10^2   : 0.113172  (   )
(R is the radius in km and D10 is the distance to the source in units of 10 kpc)
------------------------------------------------------------
#Fit statistic  : Chi-Squared                  176.60     using 59 bins.
 Reduced chi-squared =
# Null hypothesis probability of 3.68e-14 with 57 degrees of freedom

Energy  Fluence     90% Error
[keV]   [erg/cm2]   [erg/cm2]
15- 25  7.669e-07   5.934e-08
25- 50  1.802e-06   8.619e-08
50-150  8.384e-07   1.024e-07
15-150  3.407e-06   1.534e-07
Thermal bremsstrahlung (OTTB)
Spectral model: thermal bremsstrahlung
------------------------------------------------------------
Parameters  : value         Lower 90%    Upper 90%
kT [keV]    : 57.6360       (-7.23873      8.68922)
Norm        : 1.17680       (-0.0968148     0.0955108)
------------------------------------------------------------
#Fit statistic  : Chi-Squared                   63.18     using 59 bins.
 Reduced chi-squared =
# Null hypothesis probability of 2.67e-01 with 57 degrees of freedom

Energy  Fluence     90% Error
[keV]   [erg/cm2]   [erg/cm2]
15- 25  1.073e-06   7.359e-08
25- 50  1.612e-06   7.176e-08
50-150  1.774e-06   1.751e-07
15-150  4.459e-06   2.100e-07
Double BB
Spectral model: bbodyrad<1> + bbodyrad<2>
------------------------------------------------------------
Parameters  : value         Lower 90%    Upper 90%
kT1 [keV]   : 6.35679        (-0.655476      0.661803)
R1^2/D10^2  : 0.465425        (-0.143462      0.237691)
kT2 [keV]   : 23.5717        (-3.98073      5.84609)
R2^2/D10^2  : 2.32817E-03    (-0.00128495   0.00247013)
------------------------------------------------------------
#Fit statistic  : Chi-Squared                   52.90     using 59 bins.
 Reduced chi-squared =
# Null hypothesis probability of 5.55e-01 with 55 degrees of freedom

Energy  Fluence     90% Error
[keV]   [erg/cm2]   [erg/cm2]
15- 25  1.072e-06   1.150e-07
25- 50  1.579e-06   1.691e-07
50-150  2.057e-06   5.602e-07
15-150  4.707e-06   8.033e-07
Peak spectrum fit
Power-law model
Time interval is from  184.120 sec. to  185.120 sec.

Spectral model in power-law:
------------------------------------------------------------
Parameters  : value       lower 90%   higher 90%
Photon index: 1.77816     ( -0.188559   0.196723 )
Norm@50keV  : 9.78167E-03    ( -0.00132999   0.00130887 )
------------------------------------------------------------
#Fit statistic  : Chi-Squared                   48.42     using 59 bins.
 Reduced chi-squared = 0.849474
# Null hypothesis probability of 7.84e-01 with 57 degrees of freedom

Photon flux (15-150 keV)    in 1 sec: 1.33672 ( -0.15652  0.15653 ) ph/cm2/s
Energy fluence (15-150 keV)             : 9.01467e-08 ( -1.24326e-08  1.26502e-08 ) ergs/cm2
Cutoff power-law model
Time interval is from  184.120 sec. to  185.120 sec.
Spectral model in the cutoff power-law:
------------------------------------------------------------
Parameters  : value       lower 90%   higher 90%
Photon index: 0.414605     ( -1.24024   0.925078 )
Epeak [keV] : 48.9428      ( -8.82353 21.0138 )
Norm@50keV  : 5.97234E-02    ( -0.0599955   0.262276 )
------------------------------------------------------------
#Fit statistic  : Chi-Squared                   41.38     using 59 bins.
 Reduced chi-squared = 0.738929
# Null hypothesis probability of 9.28e-01 with 56 degrees of freedom

Photon flux (15-150 keV)    in 1 sec: 1.29350 ( -0.15868  0.15905 ) ph/cm2/s
Energy fluence (15-150 keV)             : 8.01512e-08 ( -1.30052e-08  1.39467e-08 ) ergs/cm2
Band function

Time interval is from  184.120 sec. to  185.120 sec.


Spectral model in the Band function:
------------------------------------------------------------
Parameters  : value       lower 90%   higher 90%
alpha       :    (     )
beta        :     (     )
Epeak [keV] :       (   )
Norm@50keV   :     (     )
------------------------------------------------------------

Photon flux (15-150 keV)    in  sec:  (    ) ph/cm2/s
Energy fluence (15-150 keV)             : 0 ( 0  0 ) ergs/cm2
Single BB
Spectral model blackbody:
------------------------------------------------------------
Parameters  : value    Lower 90%  Upper 90%
kT [keV]    : 10.9492  (-1.28657  1.48961)
R^2/D10^2   : 0.477489  (-0.181324   0.281608)
(R is the radius in km and D10 is the distance to the source in units of 10 kpc)
------------------------------------------------------------
#Fit statistic  : Chi-Squared                   47.33     using 59 bins.
 Reduced chi-squared =
# Null hypothesis probability of 8.16e-01 with 57 degrees of freedom

Energy  Fluence     90% Error
[keV]   [erg/cm2]   [erg/cm2]
15- 25  1.195e-08   2.360e-09
25- 50  3.359e-08   4.970e-09
50-150  2.266e-08   6.045e-09
15-150  6.820e-08   9.590e-09
Thermal bremsstrahlung (OTTB)
Spectral model: thermal bremsstrahlung
------------------------------------------------------------
Parameters  : value         Lower 90%    Upper 90%
kT [keV]    : 92.9279       (-29.3704      57.2869)
Norm        : 6.12614       (-0.910551     1.08894)
------------------------------------------------------------
#Fit statistic  : Chi-Squared                   43.76     using 59 bins.
 Reduced chi-squared =
# Null hypothesis probability of 9.01e-01 with 57 degrees of freedom

Energy  Fluence     90% Error
[keV]   [erg/cm2]   [erg/cm2]
15- 25  1.600e-08   2.870e-09
25- 50  2.725e-08   4.030e-09
50-150  4.230e-08   2.102e-08
15-150  8.555e-08   2.089e-08
Double BB
Spectral model: bbodyrad<1> + bbodyrad<2>
------------------------------------------------------------
Parameters  : value         Lower 90%    Upper 90%
kT1 [keV]   : 8.10692        (-3.26789      2.38923)
R1^2/D10^2  : 1.05757        (-0.558092      1.83828)
kT2 [keV]   : 23.0101        (-9.88115      92.9464)
R2^2/D10^2  : 1.55977E-02    (-0.0154167   0.106203)
------------------------------------------------------------
#Fit statistic  : Chi-Squared                   40.24     using 59 bins.
 Reduced chi-squared =
# Null hypothesis probability of 9.32e-01 with 55 degrees of freedom

Energy  Fluence     90% Error
[keV]   [erg/cm2]   [erg/cm2]
15- 25  1.419e-08   6.796e-09
25- 50  3.085e-08   1.516e-08
50-150  3.835e-08   2.124e-08
15-150  8.338e-08   4.246e-08
Pre-slew spectrum (Pre-slew PHA with pre-slew DRM)
Power-law model

Spectral model in power-law:
------------------------------------------------------------
Parameters  : value       lower 90%   higher 90%
Photon index: 1.56911     ( -0.157855   0.159187 )
Norm@50keV  : 1.20945E-03    ( -0.000111782   0.000111039 )
------------------------------------------------------------
#Fit statistic  : Chi-Squared                   59.05     using 59 bins.
 Reduced chi-squared =
# Null hypothesis probability of 4.01e-01 with 57 degrees of freedom

Photon flux (15-150 keV)    in 136.8 sec: 0.153969 ( -0.0140337  0.0140623 ) ph/cm2/s
Energy fluence (15-150 keV)             : 1.55346e-06 ( -1.54658e-07  1.55908e-07 ) ergs/cm2
Cutoff power-law model
Spectral model in the cutoff power-law:
------------------------------------------------------------
Parameters  : value       lower 90%   higher 90%
Photon index: 1.56699     ( -0.616435   0.902297 )
Epeak [keV] : 10000.00      ( -10000 -10000 )
Norm@50keV  : 1.21260E-03    ( -0.00011242   0.000107405 )
------------------------------------------------------------
#Fit statistic  : Chi-Squared                   59.04     using 59 bins.
 Reduced chi-squared =
# Null hypothesis probability of 3.65e-01 with 56 degrees of freedom

Photon flux (15-150 keV)    in 136.8 sec: 0.153751 ( -0.014378  0.014194 ) ph/cm2/s
Energy fluence (15-150 keV)             : 1.55714e-06 ( -1.75131e-07  1.51752e-07 ) ergs/cm2
Band function
Spectral model in the Band function:
------------------------------------------------------------
Parameters  : value       lower 90%   higher 90%
alpha       :    (     )
beta        :     (     )
Epeak [keV] :       (   )
Norm@50keV   :     (     )
------------------------------------------------------------

Photon flux (15-150 keV)    in  sec:  (    ) ph/cm2/s
Energy fluence (15-150 keV)             : 0 ( 0  0 ) ergs/cm2
S(25-50 keV) vs. S(50-100 keV) plot
S(25-50 keV)  = 1.51e-06
S(50-100 keV) = 1.37e-06
T90 vs. Hardness ratio plot
T90                                   = 272.183999896049 sec.
Hardness ratio (energy fluence ratio) = 0.907285
Color vs. Color plot
Count Ratio  (25-50 keV) / (15-25 keV) = 0.990798
Count Ratio (50-100 keV) / (15-25 keV) = 0.449781
Mask shadow pattern
IMX = 5.166513247353672E-01, IMY = -1.070140368864476E-02
TIME vs. PHA plot around the trigger time
TIME vs. DetID plot around the trigger time
100 us light curve (15-350 keV)
Spacecraft aspect plot
Bright source in the pre-burst/pre-slew/post-slew images
Pre-burst image of 15-350 keV band
Time interval of the image:
-239.000000 -62.544000

# RAcent  DECcent POSerr Theta    Phi  PeakCts   SNR AngSep     Name
#  [deg]    [deg]    ['] [deg]  [deg]                   [']
145.3641  38.9356    2.4  42.4  117.7   6.8603   4.7 ------	UNKNOWN
247.4973  33.4358    2.5  41.5 -102.1   5.3904   4.6 ------	UNKNOWN
Pre-slew background subtracted image of 15-350 keV band
Time interval of the image:
-62.544000 74.300590

# RAcent  DECcent POSerr Theta    Phi  PeakCts   SNR AngSep     Name
#  [deg]    [deg]    ['] [deg]  [deg]                   [']
198.7003   5.0262    0.8  27.3    1.2   2.6131  14.1 ------	UNKNOWN
249.2819  67.4893    2.1  46.0 -151.8   1.7769   5.4 ------	UNKNOWN
Post-slew image of 15-350 keV band
Time interval of the image:
146.500600 530.188100
531.000000 963.055100

# RAcent  DECcent POSerr Theta    Phi  PeakCts   SNR AngSep     Name
#  [deg]    [deg]    ['] [deg]  [deg]                   [']
164.1195  32.5298    3.2  42.4  117.7  22.4674   3.7 ------	UNKNOWN
186.5460 -44.2251    3.8  50.4   -5.9   5.4272   3.0 ------	UNKNOWN
228.6390 -12.2125    2.7  34.4  -76.9   7.9010   4.2 ------	UNKNOWN
242.8632  12.9359    3.0  44.3 -120.5  17.2613   3.9 ------	UNKNOWN
Plot creation:
Fri Jun 20 01:52:58 EDT 2025