Estimated redshift from machine learning (Ukwatta et al. 2016) - may take a few minute to calcaulte
Image
Pre-slew 15.0-350.0 keV image (Event data)
#   RAcent    DECcent   POSerr    Theta     Phi              Peak Cts       SNR   Name
   29.5153   -42.3435   0.0293    37.9761   -14.5892         0.9199883      6.541 TRIG_01294765

Foreground time interval of the image:
 -0.916  29.837 (delta_t =  30.753 [sec])
Background time interval of the image:
-119.864  -0.916 (delta_t = 118.948 [sec])
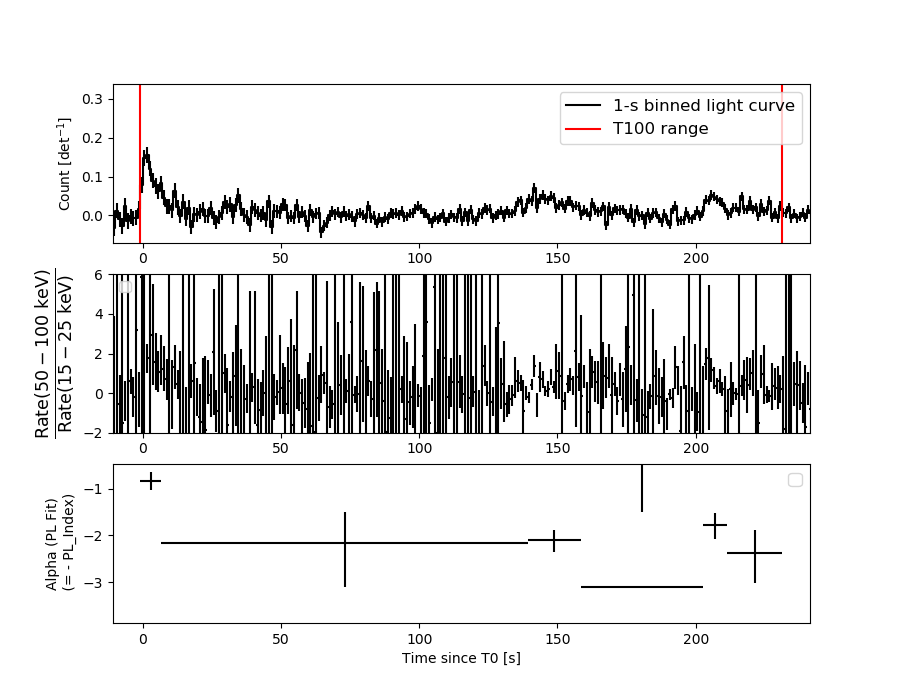
Lightcurves
Notes:
- 1) The mask-weighted light curves are using the flight position.
- 2) Multiple plots of different time binning/intervals are shown to cover all scenarios of short/long GRBs, rate/image triggers, and real/false positives.
- 3) For all the mask-weighted lightcurves, the y-axis units are counts/sec/det where a det is 0.4 x 0.4 = 0.16 sq cm.
- 4) The verticle lines correspond to following: green dotted lines are T50 interval, black dotted lines are T90 interval, blue solid line(s) is a spacecraft slew start time, and orange solid line(s) is a spacecraft slew end time.
- 5) Time of each bin is in the middle of the bin.
1 s binning
From T0-310 s to T0+310 s
From T100_start - 20 s to T100_end + 30 s
Full time interval
64 ms binning
Full time interval
From T100_start to T100_end

From T0-5 sec to T0+5 sec
16 ms binning
From T100_start-5 s to T100_start+5 s
Blue+Cyan dotted lines: Time interval of the scaled map
From 0.000000 to 2.048000
8 ms binning
From T100_start-3 s to T100_start+3 s

Blue+Cyan dotted lines: Time interval of the scaled map
From 0.000000 to 2.048000
2 ms binning
From T100_start-1 s to T100_start+1 s
Blue+Cyan dotted lines: Time interval of the scaled map
From 0.000000 to 2.048000
SN=5 or 10 sec. binning (whichever binning is satisfied first)
SN=5 or 10 sec. binning (T < 200 sec)
Quad-rate summed light curves (from T0-300s to T0+1000s)

Spectral Evolution
Spectra
Notes:
- 1) The fitting includes the systematic errors.
- 2) When the burst includes telescope slew time periods, the fitting uses an average response file made from multiple 5-s response files through out the slew time plus single time preiod for the non-slew times, and weighted by the total counts in the corresponding time period using addrmf. An average response file is needed becuase a spectral fit using the pre-slew DRM will introduce some errors in both a spectral shape and a normalization if the PHA file contains a lot of the slew/post-slew time interval.
- 3) For fits to more complicated models (e.g. a power-law over a cutoff power-law), the BAT team has decided to require a chi-square improvement of more than 6 for each extra dof.
Time averaged spectrum fit using the average DRM
Power-law model
Time interval is from   -0.916 sec. to  231.332 sec.

Spectral model in power-law:
------------------------------------------------------------
Parameters  : value       lower 90%   higher 90%
Photon index: 1.82255     ( -0.209404   0.221531 )
Norm@50keV  : 7.85626E-04    ( -0.000109854   0.000106766 )
------------------------------------------------------------
#Fit statistic  : Chi-Squared                   56.90     using 59 bins.
 Reduced chi-squared = 0.998246
# Null hypothesis probability of 4.79e-01 with 57 degrees of freedom

Photon flux (15-150 keV)    in 232.2 sec: 0.109224 ( -0.0122761  0.012278 ) ph/cm2/s
Energy fluence (15-150 keV)             : 1.6785e-06 ( -2.33556e-07  2.38938e-07 ) ergs/cm2
Cutoff power-law model
Time interval is from   -0.916 sec. to  231.332 sec.
Spectral model in the cutoff power-law:
------------------------------------------------------------
Parameters  : value       lower 90%   higher 90%
Photon index: 1.69231     ( -0.783968   0.513775 )
Epeak [keV] : 105.605      ( -105.697 -105.712 )
Norm@50keV  : 9.27914E-04    ( -0.000577673   0.00155418 )
------------------------------------------------------------
#Fit statistic  : Chi-Squared                   56.80     using 59 bins.
 Reduced chi-squared = 1.01429
# Null hypothesis probability of 4.45e-01 with 56 degrees of freedom

Photon flux (15-150 keV)    in 232.2 sec: 0.108657 ( -0.0126232  0.012601 ) ph/cm2/s
Energy fluence (15-150 keV)             : 1.65704e-06 ( -2.58281e-07  2.54586e-07 ) ergs/cm2
Band function

Time interval is from   -0.916 sec. to  231.332 sec.


Spectral model in the Band function:
------------------------------------------------------------
Parameters  : value       lower 90%   higher 90%
alpha       :    (     )
beta        :     (     )
Epeak [keV] :       (   )
Norm@50keV   :     (     )
------------------------------------------------------------

Photon flux (15-150 keV)    in  sec:  (    ) ph/cm2/s
Energy fluence (15-150 keV)             : 0 ( 0  0 ) ergs/cm2
Single BB
Spectral model blackbody:
------------------------------------------------------------
Parameters  : value    Lower 90%  Upper 90%
kT [keV]    : 10.7126  (-1.68561  2.09098)
R^2/D10^2   : 3.85763E-02  (-0.0183857   0.0340142)
(R is the radius in km and D10 is the distance to the source in units of 10 kpc)
------------------------------------------------------------
#Fit statistic  : Chi-Squared                   81.93     using 59 bins.
 Reduced chi-squared =
# Null hypothesis probability of 1.69e-02 with 57 degrees of freedom

Energy  Fluence     90% Error
[keV]   [erg/cm2]   [erg/cm2]
15- 25  2.135e-07   4.228e-08
25- 50  5.834e-07   8.708e-08
50-150  3.704e-07   1.098e-07
15-150  1.167e-06   1.961e-07
Thermal bremsstrahlung (OTTB)
Spectral model: thermal bremsstrahlung
------------------------------------------------------------
Parameters  : value         Lower 90%    Upper 90%
kT [keV]    : 97.9881       (-34.3944      73.8412)
Norm        : 0.483339       (-0.0710931     0.0904915)
------------------------------------------------------------
#Fit statistic  : Chi-Squared                   57.60     using 59 bins.
 Reduced chi-squared =
# Null hypothesis probability of 4.53e-01 with 57 degrees of freedom

Energy  Fluence     90% Error
[keV]   [erg/cm2]   [erg/cm2]
15- 25  2.933e-07   4.528e-08
25- 50  5.051e-07   7.721e-08
50-150  8.091e-07   3.706e-07
15-150  1.607e-06   3.964e-07
Double BB
Spectral model: bbodyrad<1> + bbodyrad<2>
------------------------------------------------------------
Parameters  : value         Lower 90%    Upper 90%
kT1 [keV]   : 5.67581        (-1.44685      1.60059)
R1^2/D10^2  : 0.301522        (-0.181737      0.678858)
kT2 [keV]   : 23.0520        (-5.87938      10.4201)
R2^2/D10^2  : 1.82598E-03    (-0.0013286   0.00241569)
------------------------------------------------------------
#Fit statistic  : Chi-Squared                   55.31     using 59 bins.
 Reduced chi-squared =
# Null hypothesis probability of 4.63e-01 with 55 degrees of freedom

Energy  Fluence     90% Error
[keV]   [erg/cm2]   [erg/cm2]
15- 25  3.163e-07   1.554e-07
25- 50  4.644e-07   1.911e-07
50-150  8.970e-07   5.033e-07
15-150  1.678e-06   7.308e-07
Peak spectrum fit
Power-law model

Time interval is from    0.684 sec. to    1.684 sec.

Spectral model in power-law:
------------------------------------------------------------
Parameters  : value       lower 90%   higher 90%
Photon index: 0.802057     ( -0.368981   0.335983 )
Norm@50keV  : 1.23577E-02    ( -0.00251845   0.00241834 )
------------------------------------------------------------
#Fit statistic  : Chi-Squared                   50.51     using 59 bins.
 Reduced chi-squared = 0.88614
# Null hypothesis probability of 7.16e-01 with 57 degrees of freedom

Photon flux (15-150 keV)    in 1 sec: 1.42018 ( -0.27398  0.27606 ) ph/cm2/s
Energy fluence (15-150 keV)             : 1.44301e-07 ( -2.71462e-08  2.72013e-08 ) ergs/cm2
Cutoff power-law model
Time interval is from    0.684 sec. to    1.684 sec.
Spectral model in the cutoff power-law:
------------------------------------------------------------
Parameters  : value       lower 90%   higher 90%
Photon index: 0.793521     ( -0.408295   0.338828 )
Epeak [keV] : 9999.29      ( -9999.36 -9999.36 )
Norm@50keV  : 1.24314E-02    ( -0.00233367   0.025985 )
------------------------------------------------------------
#Fit statistic  : Chi-Squared                   50.51     using 59 bins.
 Reduced chi-squared = 0.901964
# Null hypothesis probability of 6.82e-01 with 56 degrees of freedom

Photon flux (15-150 keV)    in 1 sec: 1.42493 ( -0.29329  0.28016 ) ph/cm2/s
Energy fluence (15-150 keV)             : 1.44261e-07 ( -2.58287e-08  2.72176e-08 ) ergs/cm2
Band function

Time interval is from    0.684 sec. to    1.684 sec.


Spectral model in the Band function:
------------------------------------------------------------
Parameters  : value       lower 90%   higher 90%
alpha       :    (     )
beta        :     (     )
Epeak [keV] :       (   )
Norm@50keV   :     (     )
------------------------------------------------------------

Photon flux (15-150 keV)    in  sec:  (    ) ph/cm2/s
Energy fluence (15-150 keV)             : 0 ( 0  0 ) ergs/cm2
Single BB

Spectral model blackbody:
------------------------------------------------------------
Parameters  : value    Lower 90%  Upper 90%
kT [keV]    : 29.7116  (-6.82564  11.2824)
R^2/D10^2   : 2.15847E-02  (-0.0127959   0.0256054)
(R is the radius in km and D10 is the distance to the source in units of 10 kpc)
------------------------------------------------------------
#Fit statistic  : Chi-Squared                   54.99     using 59 bins.
 Reduced chi-squared =
# Null hypothesis probability of 5.51e-01 with 57 degrees of freedom

Energy  Fluence     90% Error
[keV]   [erg/cm2]   [erg/cm2]
15- 25  2.999e-09   1.352e-09
25- 50  1.842e-08   7.035e-09
50-150  1.153e-07   4.453e-08
15-150  1.367e-07   4.720e-08
Thermal bremsstrahlung (OTTB)

Spectral model: thermal bremsstrahlung
------------------------------------------------------------
Parameters  : value         Lower 90%    Upper 90%
kT [keV]    : 200.000       (-44.4095      -200)
Norm        : 5.81893       (-1.14274     1.14274)
------------------------------------------------------------
#Fit statistic  : Chi-Squared                   64.70     using 59 bins.
 Reduced chi-squared =
# Null hypothesis probability of 2.26e-01 with 57 degrees of freedom

Energy  Fluence     90% Error
[keV]   [erg/cm2]   [erg/cm2]
15- 25  1.450e-08   8.670e-09
25- 50  2.789e-08   1.623e-08
50-150  6.117e-08   3.578e-08
15-150  1.036e-07   6.030e-08
Double BB
Spectral model: bbodyrad<1> + bbodyrad<2>
------------------------------------------------------------
Parameters  : value         Lower 90%    Upper 90%
kT1 [keV]   : 5.99976        (-5.22718      6.04393)
R1^2/D10^2  : 1.66576        (-1.53445      -1.66515)
kT2 [keV]   : 37.9770        (-12.2566      33.5922)
R2^2/D10^2  : 1.00475E-02    (-0.00796157   0.0257837)
------------------------------------------------------------
#Fit statistic  : Chi-Squared                   49.05     using 59 bins.
 Reduced chi-squared =
# Null hypothesis probability of 7.00e-01 with 55 degrees of freedom

Energy  Fluence     90% Error
[keV]   [erg/cm2]   [erg/cm2]
15- 25  9.907e-09   5.860e-09
25- 50  2.097e-08   1.153e-08
50-150  1.173e-07   6.685e-08
15-150  1.482e-07   7.885e-08
Pre-slew spectrum (Pre-slew PHA with pre-slew DRM)
Power-law model
Spectral model in power-law:
------------------------------------------------------------
Parameters  : value       lower 90%   higher 90%
Photon index: 1.22435     ( -0.248467   0.244517 )
Norm@50keV  : 2.54934E-03    ( -0.000382499   0.000382497 )
------------------------------------------------------------
#Fit statistic  : Chi-Squared                   37.51     using 59 bins.
 Reduced chi-squared =
# Null hypothesis probability of 9.78e-01 with 57 degrees of freedom

Photon flux (15-150 keV)    in 30.75 sec: 0.300308 ( -0.0463677  0.0465193 ) ph/cm2/s
Energy fluence (15-150 keV)             : 7.89955e-07 ( -1.28716e-07  1.29926e-07 ) ergs/cm2
Cutoff power-law model

Spectral model in the cutoff power-law:
------------------------------------------------------------
Parameters  : value       lower 90%   higher 90%
Photon index: 6.78751E-02     ( -1.41712   1.07198 )
Epeak [keV] : 90.3670      ( -24.7793 334.831 )
Norm@50keV  : 8.90340E-03    ( -0.0089034   0.0291849 )
------------------------------------------------------------
#Fit statistic  : Chi-Squared                   34.08     using 59 bins.
 Reduced chi-squared =
# Null hypothesis probability of 9.91e-01 with 56 degrees of freedom

Photon flux (15-150 keV)    in 30.75 sec: 0.287551 ( -0.047573  0.04812 ) ph/cm2/s
Energy fluence (15-150 keV)             : 7.44667e-07 ( -1.36838e-07  1.38553e-07 ) ergs/cm2
Band function
Spectral model in the Band function:
------------------------------------------------------------
Parameters  : value       lower 90%   higher 90%
alpha       :    (     )
beta        :     (     )
Epeak [keV] :       (   )
Norm@50keV   :     (     )
------------------------------------------------------------

Photon flux (15-150 keV)    in  sec:  (    ) ph/cm2/s
Energy fluence (15-150 keV)             : 0 ( 0  0 ) ergs/cm2
S(25-50 keV) vs. S(50-100 keV) plot
S(25-50 keV)  = 4.76e-07
S(50-100 keV) = 5.39e-07
T90 vs. Hardness ratio plot
T90                                   = 222.211999893188 sec.
Hardness ratio (energy fluence ratio) = 1.13235
Color vs. Color plot
Count Ratio  (25-50 keV) / (15-25 keV) = 1.45207
Count Ratio (50-100 keV) / (15-25 keV) = 0.933638
Mask shadow pattern
IMX = 7.554453377773364E-01, IMY = 1.966264557379882E-01
TIME vs. PHA plot around the trigger time

Blue+Cyan dotted lines: Time interval of the scaled map
From 0.000000 to 2.048000
TIME vs. DetID plot around the trigger time

Blue+Cyan dotted lines: Time interval of the scaled map
From 0.000000 to 2.048000
100 us light curve (15-350 keV)
Blue+Cyan dotted lines: Time interval of the scaled map
From 0.000000 to 2.048000
Spacecraft aspect plot
Bright source in the pre-burst/pre-slew/post-slew images
Pre-burst image of 15-350 keV band
Time interval of the image:
-119.864000 -0.916000

# RAcent  DECcent POSerr Theta    Phi  PeakCts   SNR AngSep     Name
#  [deg]    [deg]    ['] [deg]  [deg]                   [']
264.6692 -44.6081    4.9  45.9  133.8   5.1617   2.3   10.0	4U 1735-44
270.4088 -25.7098    8.4  54.2  156.9   2.7407   1.4    6.1	GRS 1758-258
275.8902 -30.3623    5.5  47.4  156.8   3.2419   2.1    1.8	H1820-303
285.1214 -24.9624    6.0  45.3  170.0  -2.2622  -1.9    5.3	HT1900.1-2455
280.7367 -28.3496    3.2  45.7  162.8   4.8355   3.6 ------	UNKNOWN
Pre-slew background subtracted image of 15-350 keV band
Time interval of the image:
-0.916000 29.836600

# RAcent  DECcent POSerr Theta    Phi  PeakCts   SNR AngSep     Name
#  [deg]    [deg]    ['] [deg]  [deg]                   [']
264.7163 -44.5951    4.1  45.9  133.8  -1.2877  -2.9    8.8	4U 1735-44
270.3724 -25.6496    7.9  54.2  156.9  -0.8928  -1.5    6.8	GRS 1758-258
275.8673 -30.5671   14.0  47.3  156.6  -0.2843  -0.8   12.4	H1820-303
285.1909 -24.9523    5.8  45.3  170.1   0.4646   2.0    8.6	HT1900.1-2455
  1.4154 -78.8956    2.1  30.4   55.4   0.8361   5.6 ------	UNKNOWN
 58.6218 -39.4475    1.7  57.5   -0.4   4.0012   6.9 ------	UNKNOWN
 29.5153 -42.3435    1.8  38.0  -14.6   0.9196   6.5 ------	UNKNOWN
347.1655 -26.7116    2.3  25.2  -87.4   0.6846   5.1 ------	UNKNOWN
 31.3879 -26.0142    2.0  49.4  -31.9   1.4994   5.8 ------	UNKNOWN
Post-slew image of 15-350 keV band
Time interval of the image:
123.036600 962.304800

# RAcent  DECcent POSerr Theta    Phi  PeakCts   SNR AngSep     Name
#  [deg]    [deg]    ['] [deg]  [deg]                   [']
 55.4590 -57.8803    3.4  22.5  102.7   5.3601   3.4 ------	UNKNOWN
313.7154 -73.5062    3.2  45.7  162.8  12.1491   3.6 ------	UNKNOWN
 59.8069 -10.9916    2.9  41.0    9.2   6.9643   4.0 ------	UNKNOWN
305.2132 -59.2052    2.9  51.9 -179.5  13.4765   4.0 ------	UNKNOWN
357.8685 -57.7075    3.3  25.1 -178.4   4.1151   3.5 ------	UNKNOWN
Plot creation:
Fri Jun 20 01:48:31 EDT 2025