Estimated redshift from machine learning (Ukwatta et al. 2016) - may take a few minute to calcaulte
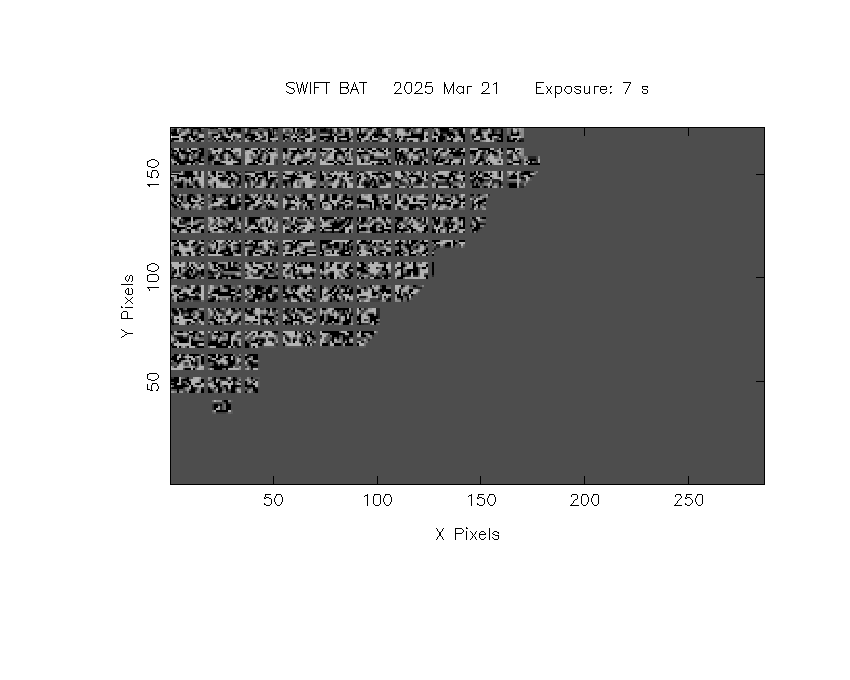
Image
Pre-slew 15.0-350.0 keV image (Event data)
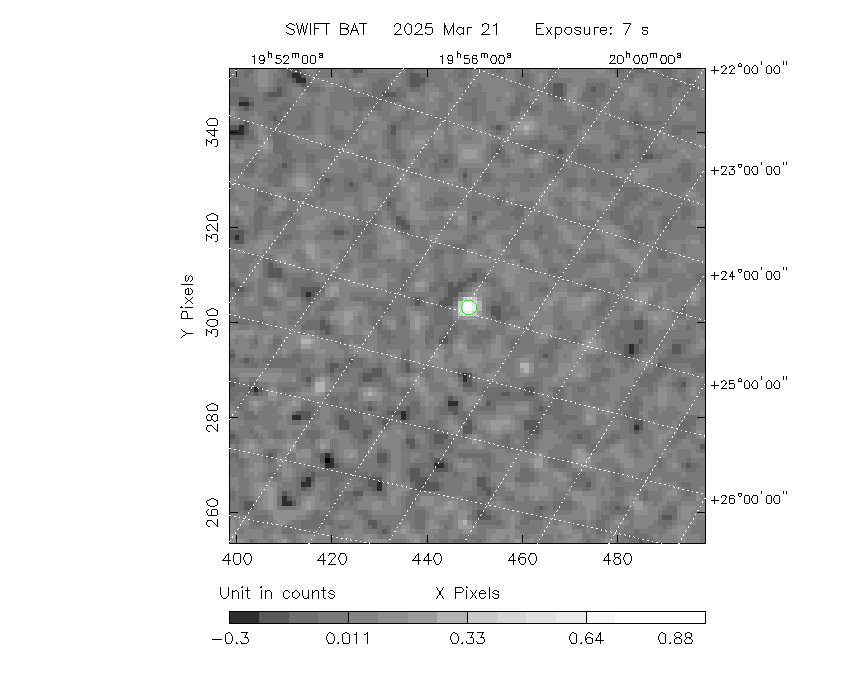
#   RAcent    DECcent   POSerr    Theta     Phi              Peak Cts       SNR   Name
  295.0996    21.0547   0.0147    44.2947    21.9336         1.0379033     12.986 TRIG_01297508

Foreground time interval of the image:
 -0.136   7.352 (delta_t =   7.488 [sec])
Background time interval of the image:
-239.176  -0.136 (delta_t = 239.040 [sec])
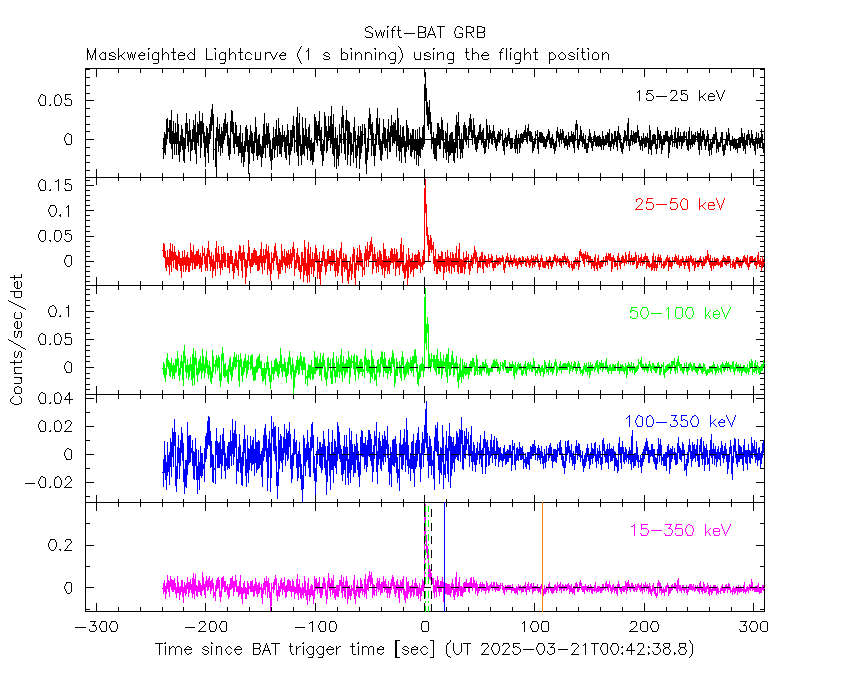
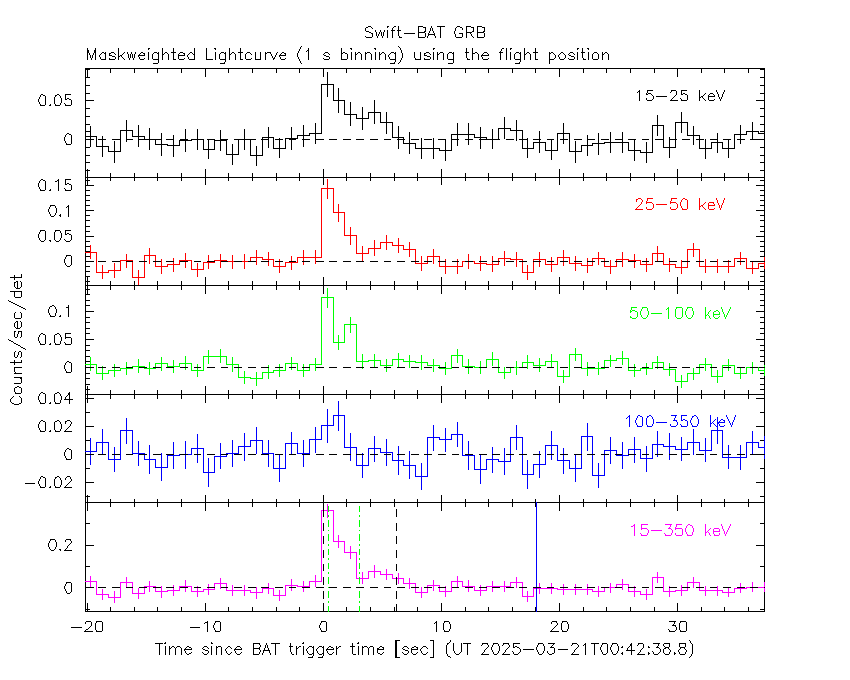
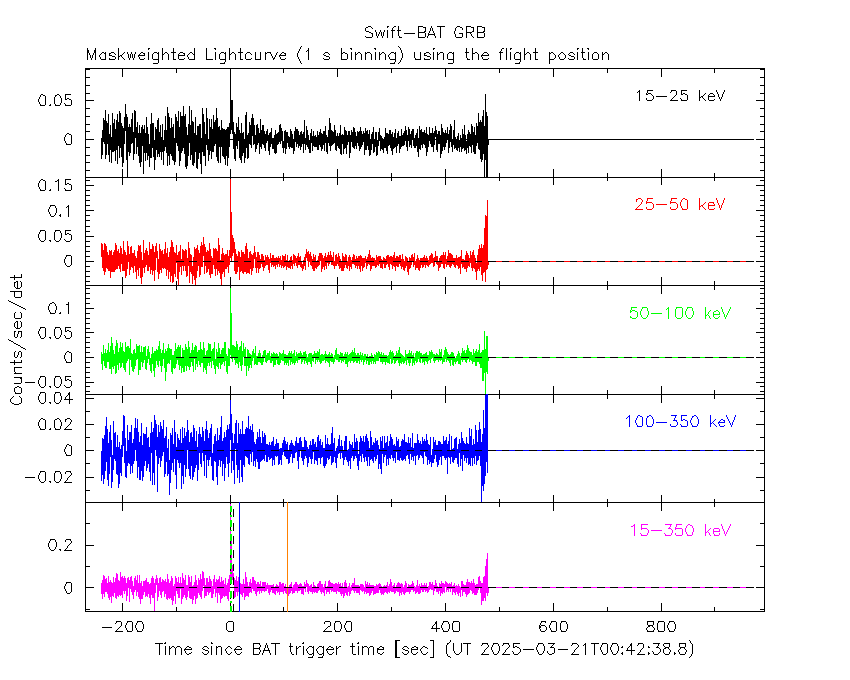
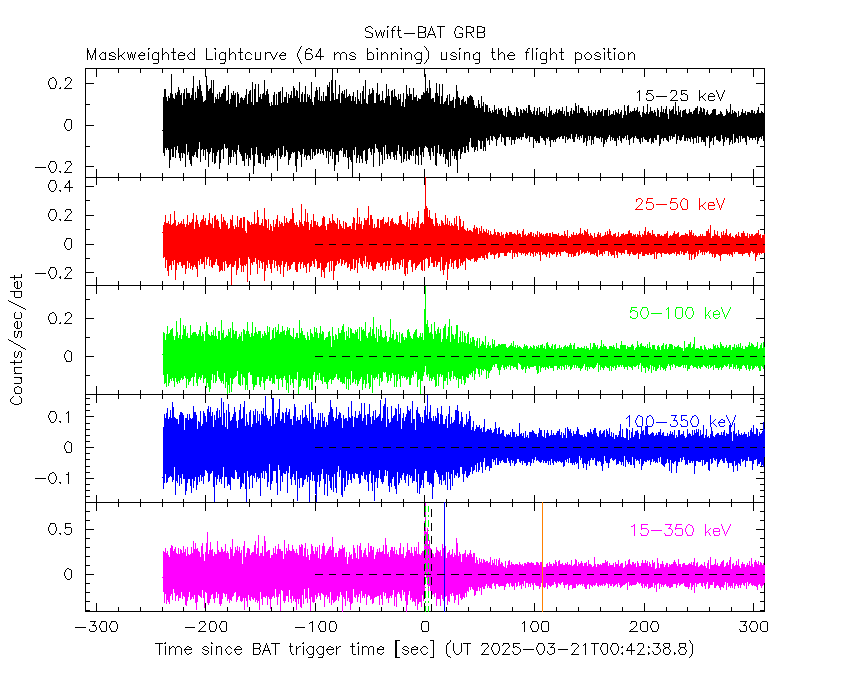
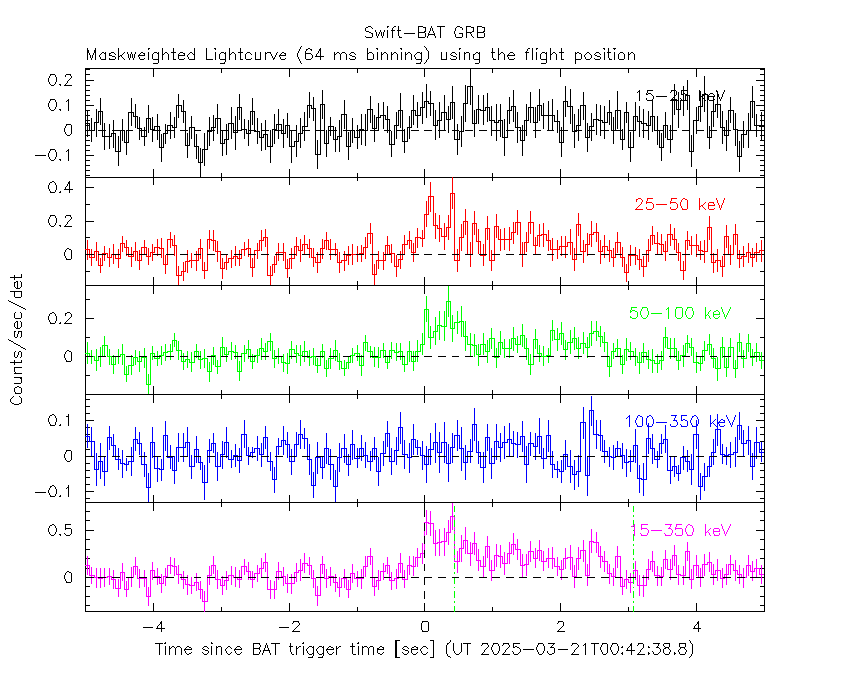
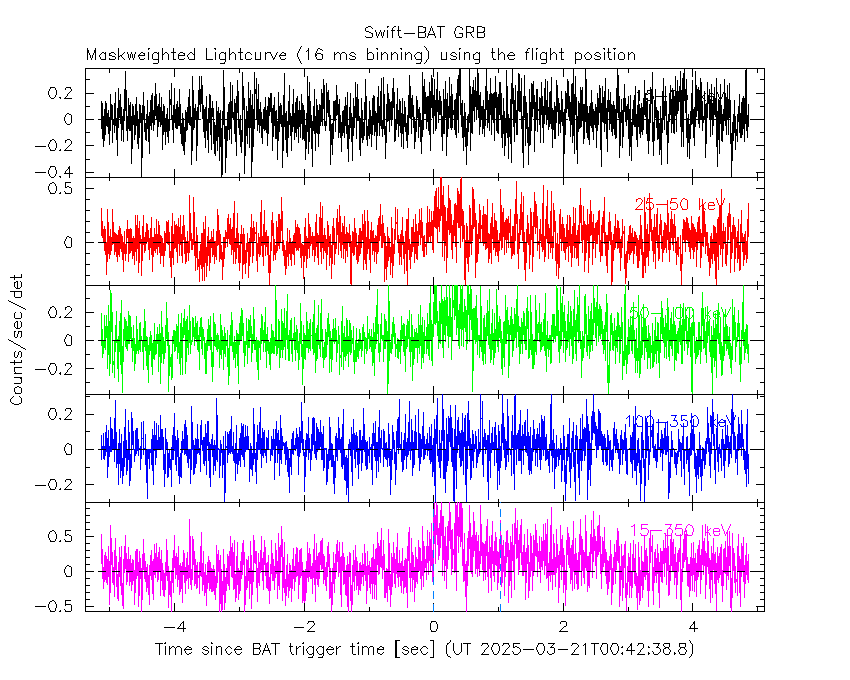
Lightcurves
Notes:
- 1) The mask-weighted light curves are using the flight position.
- 2) Multiple plots of different time binning/intervals are shown to cover all scenarios of short/long GRBs, rate/image triggers, and real/false positives.
- 3) For all the mask-weighted lightcurves, the y-axis units are counts/sec/det where a det is 0.4 x 0.4 = 0.16 sq cm.
- 4) The verticle lines correspond to following: green dotted lines are T50 interval, black dotted lines are T90 interval, blue solid line(s) is a spacecraft slew start time, and orange solid line(s) is a spacecraft slew end time.
- 5) Time of each bin is in the middle of the bin.
1 s binning
From T0-310 s to T0+310 s
From T100_start - 20 s to T100_end + 30 s
Full time interval
64 ms binning
Full time interval
From T100_start to T100_end
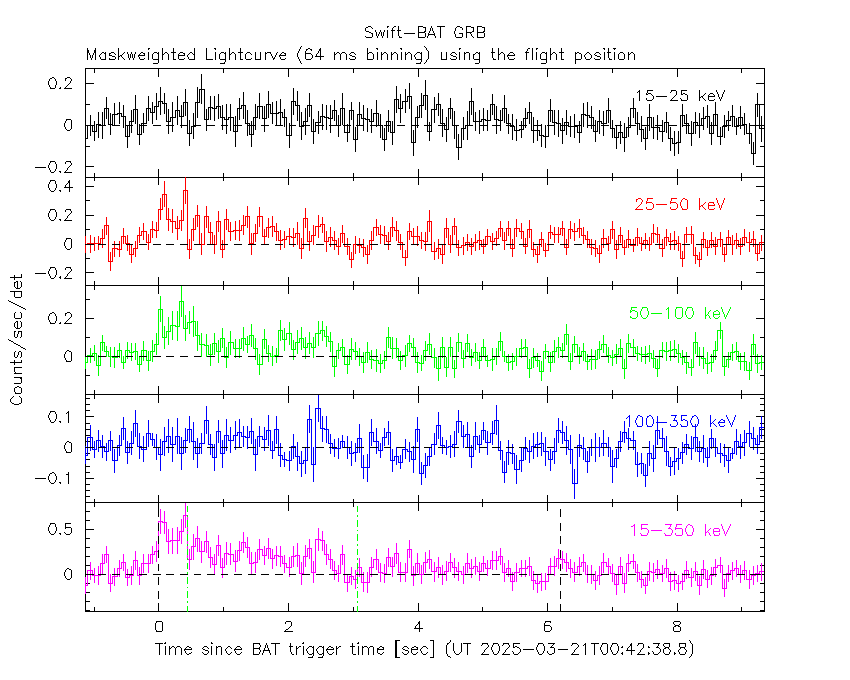
From T0-5 sec to T0+5 sec
16 ms binning
From T100_start-5 s to T100_start+5 s
Blue+Cyan dotted lines: Time interval of the scaled map
From 0.000000 to 1.024000
8 ms binning
From T100_start-3 s to T100_start+3 s
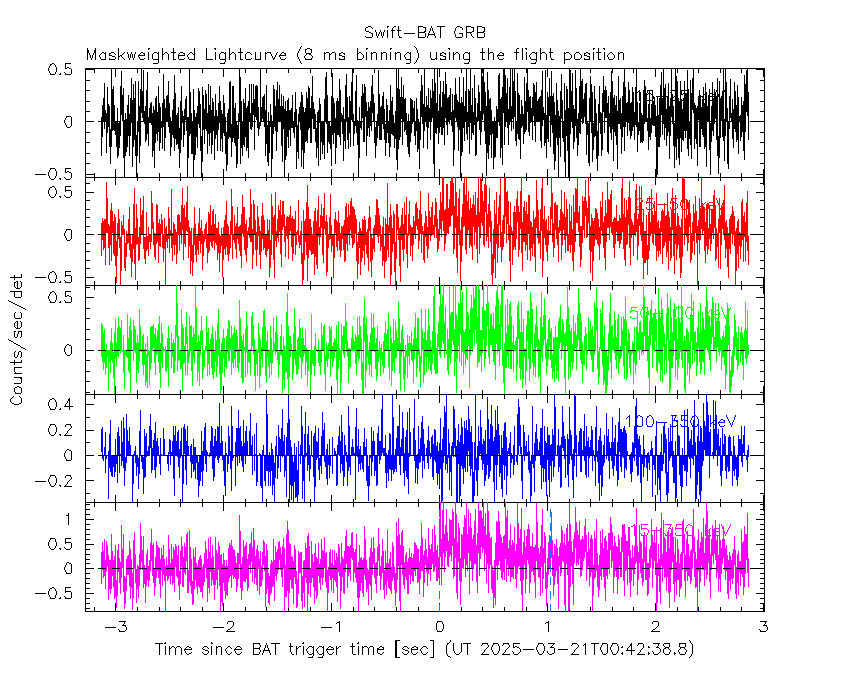
Blue+Cyan dotted lines: Time interval of the scaled map
From 0.000000 to 1.024000
2 ms binning
From T100_start-1 s to T100_start+1 s
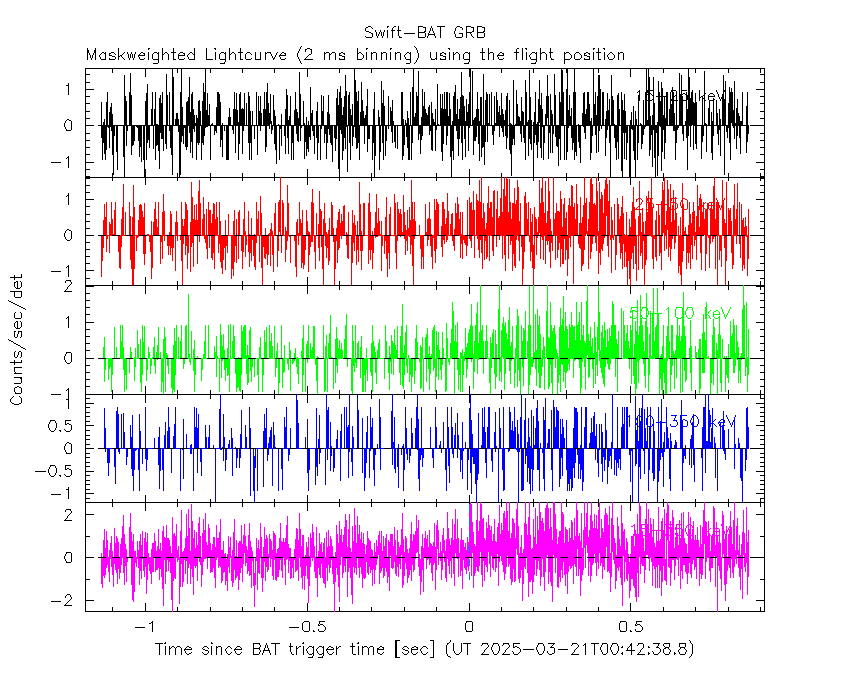
Blue+Cyan dotted lines: Time interval of the scaled map
From 0.000000 to 1.024000
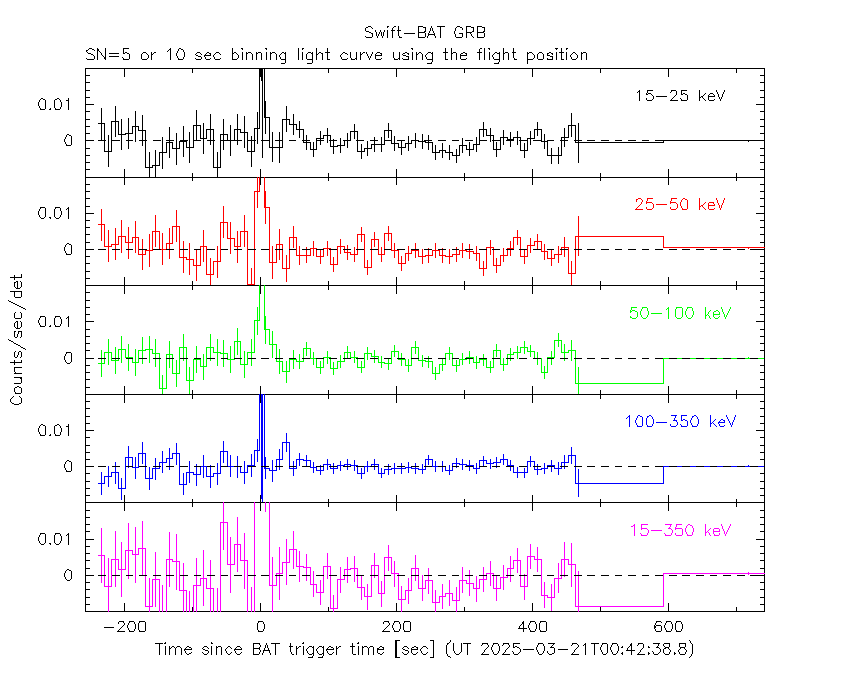
SN=5 or 10 sec. binning (whichever binning is satisfied first)
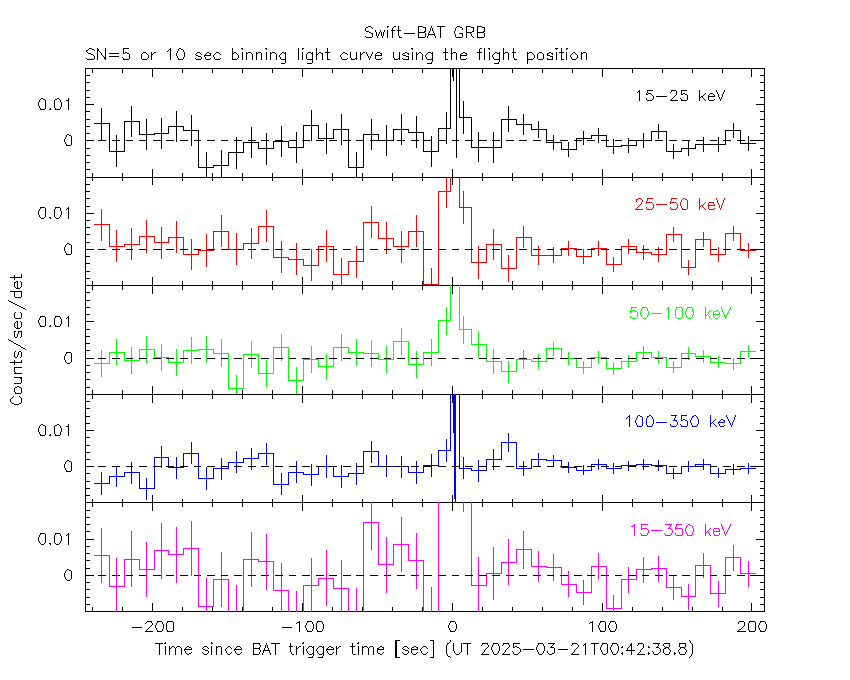
SN=5 or 10 sec. binning (T < 200 sec)
Quad-rate summed light curves (from T0-300s to T0+1000s)

Spectral Evolution

Spectra
Notes:
- 1) The fitting includes the systematic errors.
- 2) When the burst includes telescope slew time periods, the fitting uses an average response file made from multiple 5-s response files through out the slew time plus single time preiod for the non-slew times, and weighted by the total counts in the corresponding time period using addrmf. An average response file is needed becuase a spectral fit using the pre-slew DRM will introduce some errors in both a spectral shape and a normalization if the PHA file contains a lot of the slew/post-slew time interval.
- 3) For fits to more complicated models (e.g. a power-law over a cutoff power-law), the BAT team has decided to require a chi-square improvement of more than 6 for each extra dof.
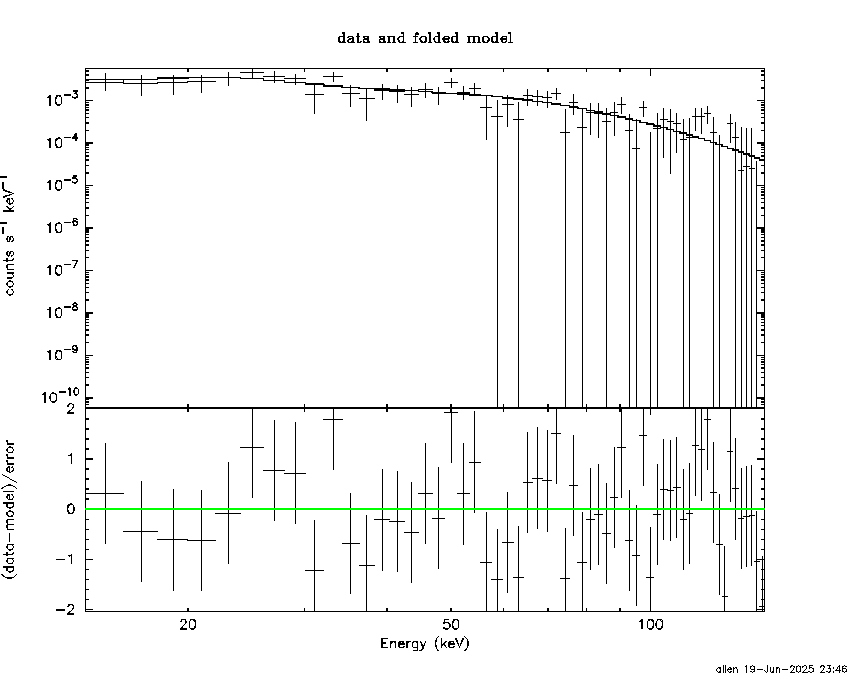
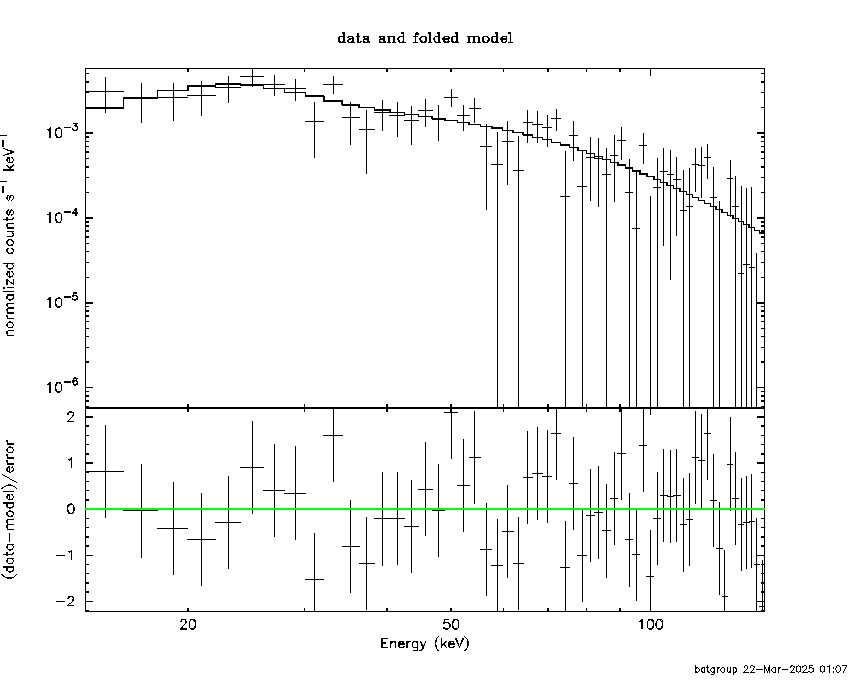
Time averaged spectrum fit using the average DRM
Power-law model

Time interval is from   -0.136 sec. to    7.352 sec.

Spectral model in power-law:
------------------------------------------------------------
Parameters  : value       lower 90%   higher 90%
Photon index: 1.60779     ( -0.186296   0.189312 )
Norm@50keV  : 9.58040E-03    ( -0.00113915   0.00113402 )
------------------------------------------------------------
#Fit statistic  : Chi-Squared                   54.55     using 59 bins.
 Reduced chi-squared = 0.957018
# Null hypothesis probability of 5.68e-01 with 57 degrees of freedom

Photon flux (15-150 keV)    in 7.488 sec: 1.23415 ( -0.14856  0.14895 ) ph/cm2/s
Energy fluence (15-150 keV)             : 6.70372e-07 ( -8.3632e-08  8.407e-08 ) ergs/cm2
Cutoff power-law model
Time interval is from   -0.136 sec. to    7.352 sec.
Spectral model in the cutoff power-law:
------------------------------------------------------------
Parameters  : value       lower 90%   higher 90%
Photon index: 0.782352     ( -0.937201   0.767975 )
Epeak [keV] : 74.4403      ( -18.496 228.587 )
Norm@50keV  : 2.50615E-02    ( -0.0146082   0.0482185 )
------------------------------------------------------------
#Fit statistic  : Chi-Squared                   51.15     using 59 bins.
 Reduced chi-squared = 0.913393
# Null hypothesis probability of 6.59e-01 with 56 degrees of freedom

Photon flux (15-150 keV)    in 7.488 sec: 1.20274 ( -0.1516  0.1519 ) ph/cm2/s
Energy fluence (15-150 keV)             : 6.4492e-07 ( -8.82266e-08  8.82858e-08 ) ergs/cm2
Band function

Time interval is from   -0.136 sec. to    7.352 sec.


Spectral model in the Band function:
------------------------------------------------------------
Parameters  : value       lower 90%   higher 90%
alpha       :    (     )
beta        :     (     )
Epeak [keV] :       (   )
Norm@50keV   :     (     )
------------------------------------------------------------

Photon flux (15-150 keV)    in  sec:  (    ) ph/cm2/s
Energy fluence (15-150 keV)             : 0 ( 0  0 ) ergs/cm2
Single BB

Spectral model blackbody:
------------------------------------------------------------
Parameters  : value    Lower 90%  Upper 90%
kT [keV]    : 14.3727  (-1.82699  2.12306)
R^2/D10^2   : 0.166030  (-0.0659681   0.105983)
(R is the radius in km and D10 is the distance to the source in units of 10 kpc)
------------------------------------------------------------
#Fit statistic  : Chi-Squared                   63.24     using 59 bins.
 Reduced chi-squared =
# Null hypothesis probability of 2.66e-01 with 57 degrees of freedom

Energy  Fluence     90% Error
[keV]   [erg/cm2]   [erg/cm2]
15- 25  5.410e-08   1.233e-08
25- 50  2.065e-07   3.699e-08
50-150  2.845e-07   6.118e-08
15-150  5.451e-07   9.188e-08
Thermal bremsstrahlung (OTTB)

Spectral model: thermal bremsstrahlung
------------------------------------------------------------
Parameters  : value         Lower 90%    Upper 90%
kT [keV]    : 165.074       (-62.5876      -165.04)
Norm        : 5.12830       (-0.651049     0.75968)
------------------------------------------------------------
#Fit statistic  : Chi-Squared                   52.15     using 59 bins.
 Reduced chi-squared =
# Null hypothesis probability of 6.57e-01 with 57 degrees of freedom

Energy  Fluence     90% Error
[keV]   [erg/cm2]   [erg/cm2]
15- 25  9.776e-08   5.141e-08
25- 50  1.836e-07   9.822e-08
50-150  3.766e-07   2.062e-07
15-150  6.579e-07   3.507e-07
Double BB

Spectral model: bbodyrad<1> + bbodyrad<2>
------------------------------------------------------------
Parameters  : value         Lower 90%    Upper 90%
kT1 [keV]   : 8.01844        (-2.98266      3.28438)
R1^2/D10^2  : 0.823685        (-0.521925      2.84134)
kT2 [keV]   : 25.0688        (-7.63338      26.689)
R2^2/D10^2  : 1.54870E-02    (-0.0140473   0.0221259)
------------------------------------------------------------
#Fit statistic  : Chi-Squared                   50.56     using 59 bins.
 Reduced chi-squared =
# Null hypothesis probability of 6.45e-01 with 55 degrees of freedom

Energy  Fluence     90% Error
[keV]   [erg/cm2]   [erg/cm2]
15- 25  8.447e-08   4.659e-08
25- 50  1.980e-07   9.654e-08
50-150  3.680e-07   1.994e-07
15-150  6.505e-07   3.326e-07
Peak spectrum fit
Power-law model
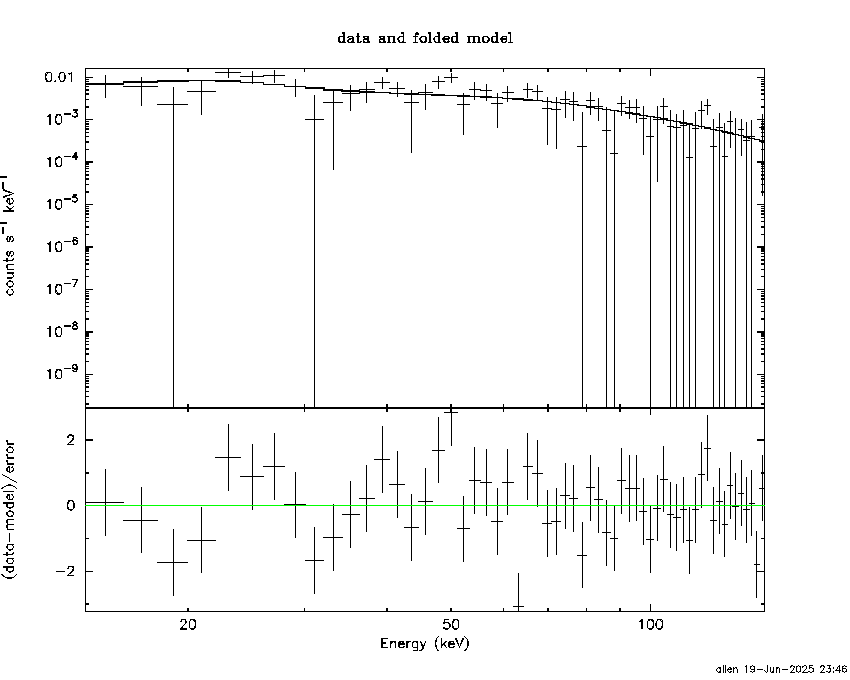
Time interval is from   -0.156 sec. to    0.844 sec.

Spectral model in power-law:
------------------------------------------------------------
Parameters  : value       lower 90%   higher 90%
Photon index: 1.30782     ( -0.220971   0.21887 )
Norm@50keV  : 2.64138E-02    ( -0.00365505   0.00365473 )
------------------------------------------------------------
#Fit statistic  : Chi-Squared                   58.29     using 59 bins.
 Reduced chi-squared = 1.02263
# Null hypothesis probability of 4.28e-01 with 57 degrees of freedom

Photon flux (15-150 keV)    in 1 sec: 3.15586 ( -0.45676  0.45799 ) ph/cm2/s
Energy fluence (15-150 keV)             : 2.60549e-07 ( -3.82538e-08  3.83607e-08 ) ergs/cm2
Cutoff power-law model

Time interval is from   -0.156 sec. to    0.844 sec.
Spectral model in the cutoff power-law:
------------------------------------------------------------
Parameters  : value       lower 90%   higher 90%
Photon index: 0.693257     ( -1.11419   0.719736 )
Epeak [keV] : 116.320      ( -45.0996 -116.321 )
Norm@50keV  : 5.18982E-02    ( -0.0279757   0.119115 )
------------------------------------------------------------
#Fit statistic  : Chi-Squared                   56.97     using 59 bins.
 Reduced chi-squared = 1.01732
# Null hypothesis probability of 4.39e-01 with 56 degrees of freedom

Photon flux (15-150 keV)    in 1 sec: 3.11722 ( -0.4602  0.46152 ) ph/cm2/s
Energy fluence (15-150 keV)             : 2.56372e-07 ( -3.99756e-08  3.94565e-08 ) ergs/cm2
Band function

Time interval is from   -0.156 sec. to    0.844 sec.


Spectral model in the Band function:
------------------------------------------------------------
Parameters  : value       lower 90%   higher 90%
alpha       :    (     )
beta        :     (     )
Epeak [keV] :       (   )
Norm@50keV   :     (     )
------------------------------------------------------------

Photon flux (15-150 keV)    in  sec:  (    ) ph/cm2/s
Energy fluence (15-150 keV)             : 0 ( 0  0 ) ergs/cm2
Single BB

Spectral model blackbody:
------------------------------------------------------------
Parameters  : value    Lower 90%  Upper 90%
kT [keV]    : 17.4824  (-2.65772  3.30616)
R^2/D10^2   : 0.233503  (-0.106055   0.178915)
(R is the radius in km and D10 is the distance to the source in units of 10 kpc)
------------------------------------------------------------
#Fit statistic  : Chi-Squared                   65.13     using 59 bins.
 Reduced chi-squared =
# Null hypothesis probability of 2.15e-01 with 57 degrees of freedom

Energy  Fluence     90% Error
[keV]   [erg/cm2]   [erg/cm2]
15- 25  1.442e-08   3.771e-09
25- 50  6.522e-08   1.235e-08
50-150  1.435e-07   3.551e-08
15-150  2.232e-07   4.705e-08
Thermal bremsstrahlung (OTTB)

Spectral model: thermal bremsstrahlung
------------------------------------------------------------
Parameters  : value         Lower 90%    Upper 90%
kT [keV]    : 200.000       (-48.1114      -200)
Norm        : 13.3031       (-1.85996     1.85996)
------------------------------------------------------------
#Fit statistic  : Chi-Squared                   61.14     using 59 bins.
 Reduced chi-squared =
# Null hypothesis probability of 3.30e-01 with 57 degrees of freedom

Energy  Fluence     90% Error
[keV]   [erg/cm2]   [erg/cm2]
15- 25  3.313e-08   1.873e-08
25- 50  6.373e-08   3.606e-08
50-150  1.398e-07   7.800e-08
15-150  2.366e-07   1.317e-07
Double BB

Spectral model: bbodyrad<1> + bbodyrad<2>
------------------------------------------------------------
Parameters  : value         Lower 90%    Upper 90%
kT1 [keV]   : 11.3061        (-4.83841      4.04945)
R1^2/D10^2  : 0.731330        (-0.4133      2.33358)
kT2 [keV]   : 45.4452        (-25.2623      -47.7227)
R2^2/D10^2  : 6.56664E-03    (-0.00529518   0.0759224)
------------------------------------------------------------
#Fit statistic  : Chi-Squared                   55.95     using 59 bins.
 Reduced chi-squared =
# Null hypothesis probability of 4.39e-01 with 55 degrees of freedom

Energy  Fluence     90% Error
[keV]   [erg/cm2]   [erg/cm2]
15- 25  2.122e-08   1.235e-08
25- 50  6.872e-08   3.788e-08
50-150  1.670e-07   8.625e-08
15-150  2.569e-07   1.275e-07
Pre-slew spectrum (Pre-slew PHA with pre-slew DRM)
Power-law model
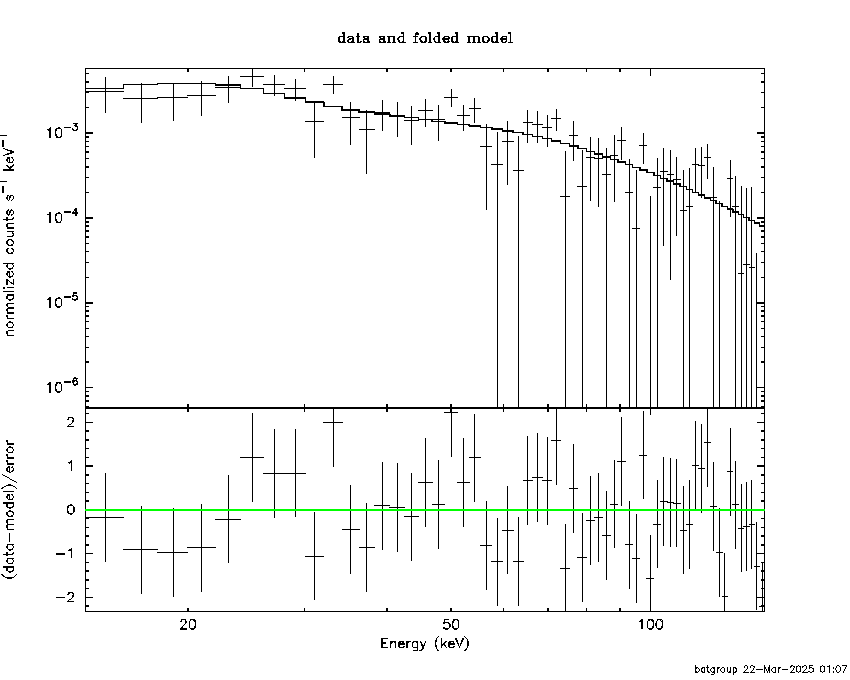
Spectral model in power-law:
------------------------------------------------------------
Parameters  : value       lower 90%   higher 90%
Photon index: 1.60779     ( -0.186296   0.189312 )
Norm@50keV  : 9.58040E-03    ( -0.00113915   0.00113402 )
------------------------------------------------------------
#Fit statistic  : Chi-Squared                   54.55     using 59 bins.
 Reduced chi-squared =
# Null hypothesis probability of 5.68e-01 with 57 degrees of freedom

Photon flux (15-150 keV)    in 7.488 sec: 1.23411 ( -0.148554  0.148936 ) ph/cm2/s
Energy fluence (15-150 keV)             : 6.70276e-07 ( -8.36222e-08  8.4079e-08 ) ergs/cm2
Cutoff power-law model
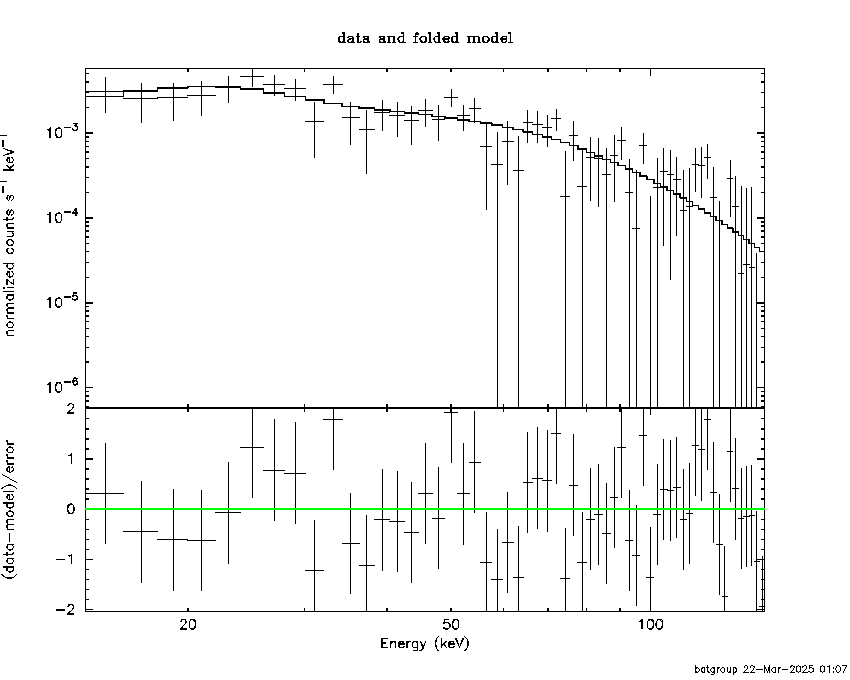
Spectral model in the cutoff power-law:
------------------------------------------------------------
Parameters  : value       lower 90%   higher 90%
Photon index: 0.782355     ( -0.937204   0.767972 )
Epeak [keV] : 74.4405      ( -18.4961 228.583 )
Norm@50keV  : 2.50613E-02    ( -0.0146081   0.0482186 )
------------------------------------------------------------
#Fit statistic  : Chi-Squared                   51.15     using 59 bins.
 Reduced chi-squared =
# Null hypothesis probability of 6.59e-01 with 56 degrees of freedom

Photon flux (15-150 keV)    in 7.488 sec: 1.20261 ( -0.15157  0.15185 ) ph/cm2/s
Energy fluence (15-150 keV)             : 6.45148e-07 ( -8.82708e-08  8.83509e-08 ) ergs/cm2
Band function
Spectral model in the Band function:
------------------------------------------------------------
Parameters  : value       lower 90%   higher 90%
alpha       :    (     )
beta        :     (     )
Epeak [keV] :       (   )
Norm@50keV   :     (     )
------------------------------------------------------------

Photon flux (15-150 keV)    in  sec:  (    ) ph/cm2/s
Energy fluence (15-150 keV)             : 0 ( 0  0 ) ergs/cm2
S(25-50 keV) vs. S(50-100 keV) plot
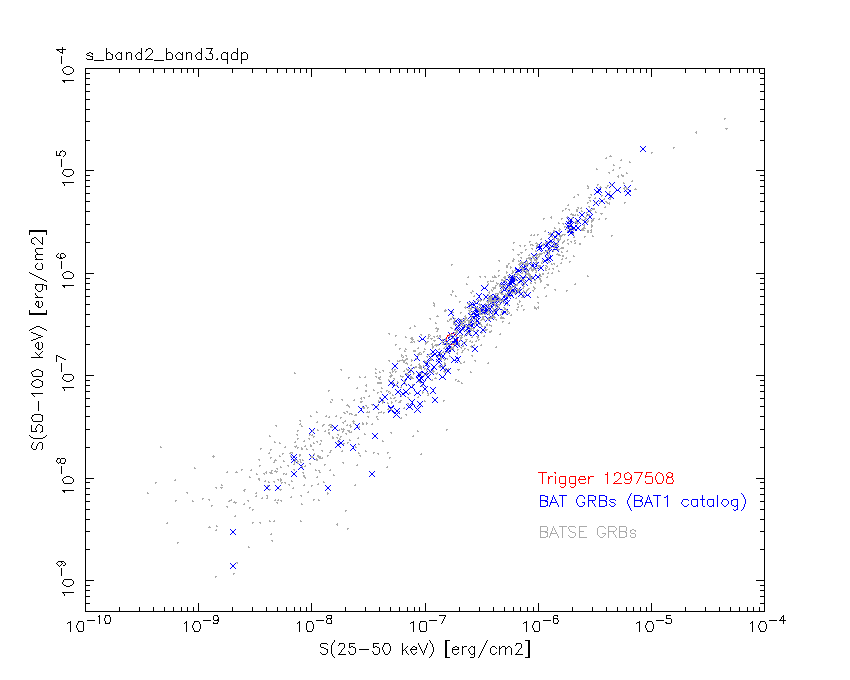
S(25-50 keV)  = 1.74e-07
S(50-100 keV) = 2.29e-07
T90 vs. Hardness ratio plot
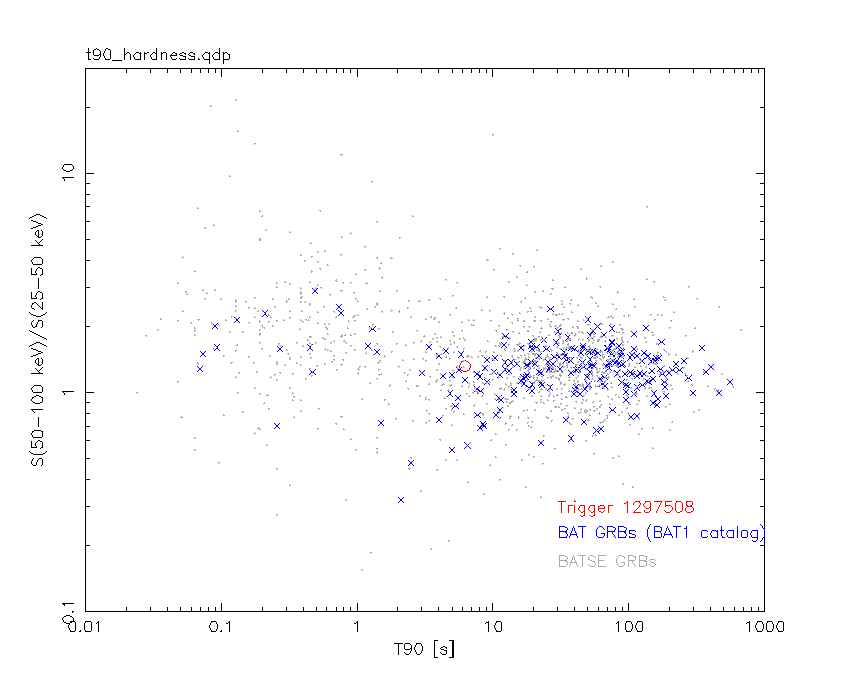
T90                                   = 6.20799994468689 sec.
Hardness ratio (energy fluence ratio) = 1.31609
Color vs. Color plot
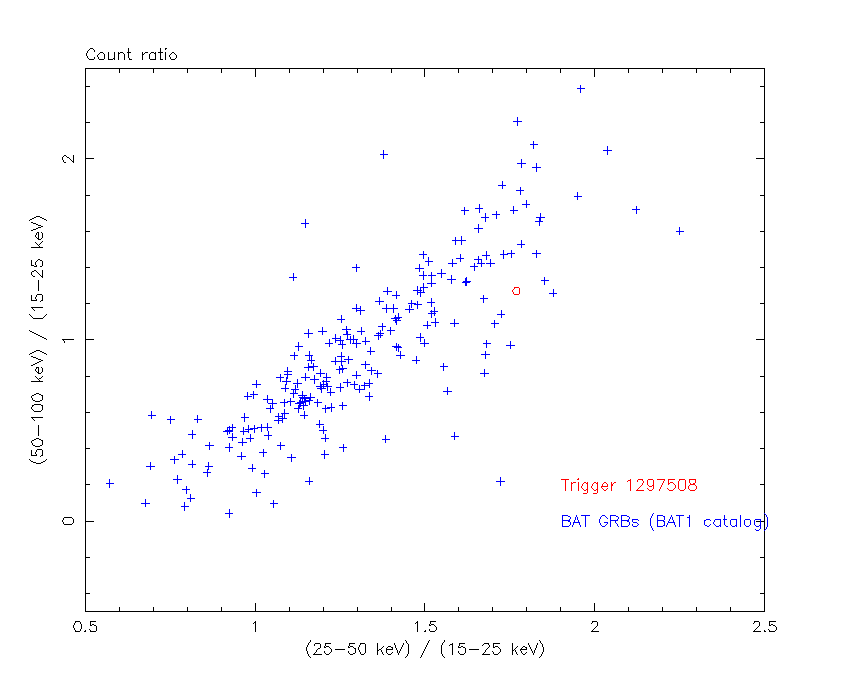
Count Ratio  (25-50 keV) / (15-25 keV) = 1.76848
Count Ratio (50-100 keV) / (15-25 keV) = 1.26996
Mask shadow pattern
IMX = 9.050566007664759E-01, IMY = -3.644467887289749E-01
TIME vs. PHA plot around the trigger time
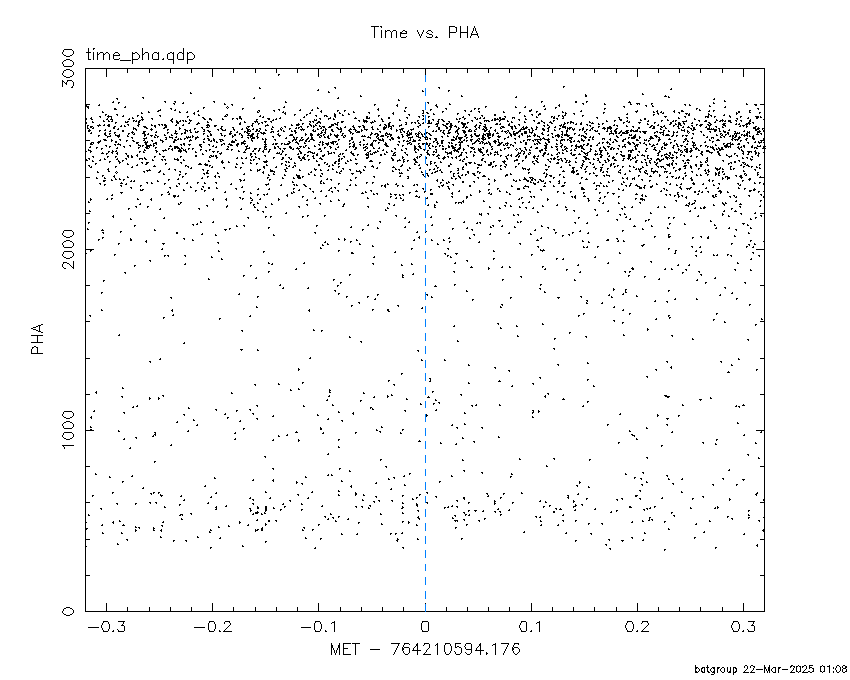
Blue+Cyan dotted lines: Time interval of the scaled map
From 0.000000 to 1.024000
TIME vs. DetID plot around the trigger time
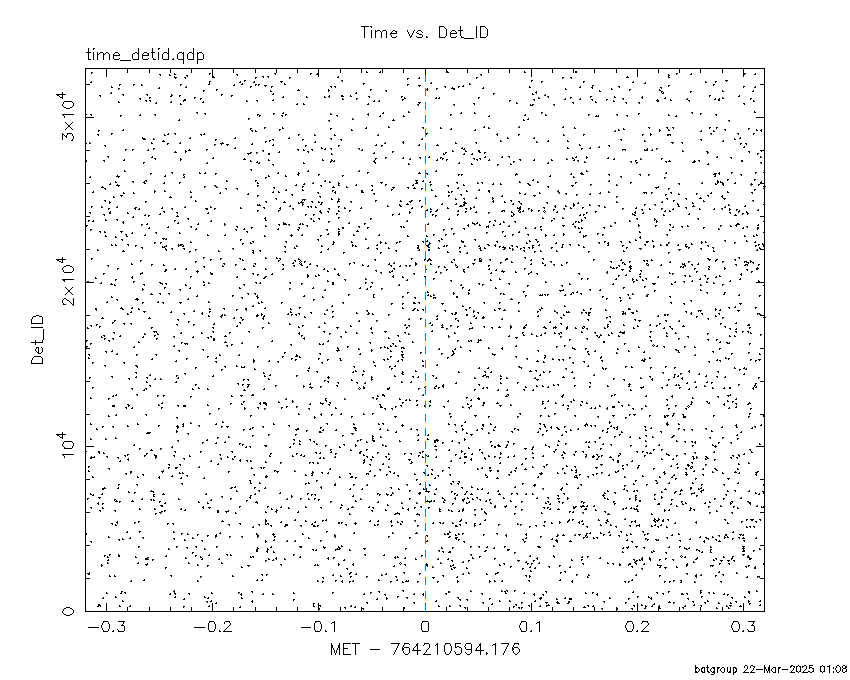
Blue+Cyan dotted lines: Time interval of the scaled map
From 0.000000 to 1.024000
100 us light curve (15-350 keV)

Blue+Cyan dotted lines: Time interval of the scaled map
From 0.000000 to 1.024000
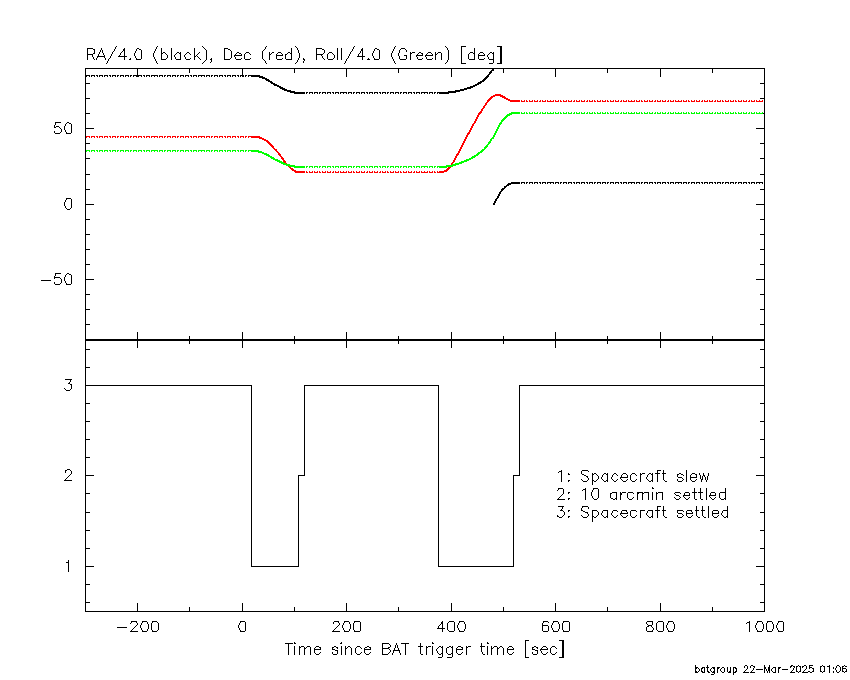
Spacecraft aspect plot
Bright source in the pre-burst/pre-slew/post-slew images
Pre-burst image of 15-350 keV band
Time interval of the image:
-239.176000 -0.136000

# RAcent  DECcent POSerr Theta    Phi  PeakCts   SNR AngSep     Name
#  [deg]    [deg]    ['] [deg]  [deg]                   [']
299.5802  35.2215    0.8  32.6   36.5   6.9919  14.4    1.3	Cyg X-1
308.0869  40.9793    4.1  24.1   41.6   1.1156   2.8    1.9	Cyg X-3
326.1578  38.5322    0.0  12.6   14.6   0.6993   2.3   12.6	Cyg X-2
 67.3941  70.3636    2.5  47.4  155.9   4.5350   4.6 ------	UNKNOWN
318.6451  63.2474    3.0  22.4  102.4   1.6542   3.8 ------	UNKNOWN
336.6956  11.0807    2.4  33.8  -43.9   2.2057   4.8 ------	UNKNOWN
314.4779  -9.4121    2.5  59.1  -20.5   6.6776   4.7 ------	UNKNOWN
Pre-slew background subtracted image of 15-350 keV band
Time interval of the image:
-0.136000 7.352000

# RAcent  DECcent POSerr Theta    Phi  PeakCts   SNR AngSep     Name
#  [deg]    [deg]    ['] [deg]  [deg]                   [']
299.4284  35.1969    5.0  32.7   36.6   0.1118   2.3    7.9	Cyg X-1
308.1105  40.9545  569.9  24.1   41.5   0.0007   0.0    0.1	Cyg X-3
326.1084  38.3553    7.1  12.7   14.0   0.0505   1.6    3.6	Cyg X-2
295.0996  21.0547    0.9  44.3   21.9   1.0389  13.0 ------	UNKNOWN
 27.0013  24.5786    2.5  42.2 -128.6   0.3255   4.6 ------	UNKNOWN
  6.2280  11.8981    2.5  39.3  -92.7   0.4646   4.5 ------	UNKNOWN
Post-slew image of 15-350 keV band
Time interval of the image:
107.324590 377.124600

# RAcent  DECcent POSerr Theta    Phi  PeakCts   SNR AngSep     Name
#  [deg]    [deg]    ['] [deg]  [deg]                   [']
254.2862  35.2833   26.4  38.3  111.9   0.5266   0.4    9.1	Her X-1
268.4161  -1.3638    4.3  34.4   43.8  -1.9721  -2.7    6.1	SW J1753.5-0127
270.3358 -25.0714    5.4  52.0   19.9   2.5271   2.1    2.8	GX 5-1
270.3365 -25.8248    9.9  52.6   19.5  -1.4299  -1.2    5.2	GRS 1758-258
274.0059 -14.0365  367.4  40.7   23.5   0.0215   0.0    0.0	GX 17+2
275.8535 -30.4043    4.2  54.7   11.5   3.5736   2.7    4.3	H1820-303
284.9868 -25.0433    8.9  47.1    3.7  -0.8400  -1.3    7.8	HT1900.1-2455
288.8162  10.9397    3.9  11.7   22.8   1.1457   3.0    1.1	GRS 1915+105
299.5542  35.2081    0.6  14.7 -174.2   7.4780  18.6    1.8	Cyg X-1
308.1397  40.9284    2.9  22.8 -162.6   1.4587   3.9    2.0	Cyg X-3
326.1403  38.4499    8.6  31.9 -138.9   0.6843   1.3    7.8	Cyg X-2
247.8469  54.3391    2.3  48.6  136.4   8.0920   5.0 ------	UNKNOWN
263.5017 -18.7396    2.6  50.4   31.2   5.9245   4.5 ------	UNKNOWN
Plot creation:
Fri Jun 20 01:47:41 EDT 2025