Estimated redshift from machine learning (Ukwatta et al. 2016) - may take a few minute to calcaulte
Image
Pre-slew 15.0-350.0 keV image (Event data)
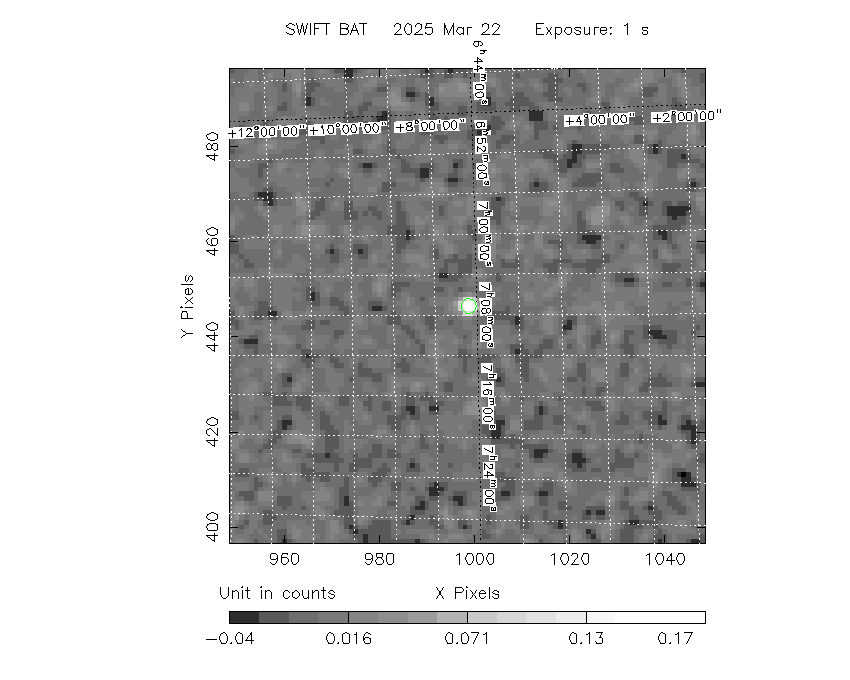
#   RAcent    DECcent   POSerr    Theta     Phi              Peak Cts       SNR   Name
  106.7755     7.1966   0.0117    14.4746   165.8012         0.2048283     16.347 TRIG_01297832

Foreground time interval of the image:
  0.000   0.672 (delta_t =   0.672 [sec])
Background time interval of the image:
-239.128   0.000 (delta_t = 239.128 [sec])
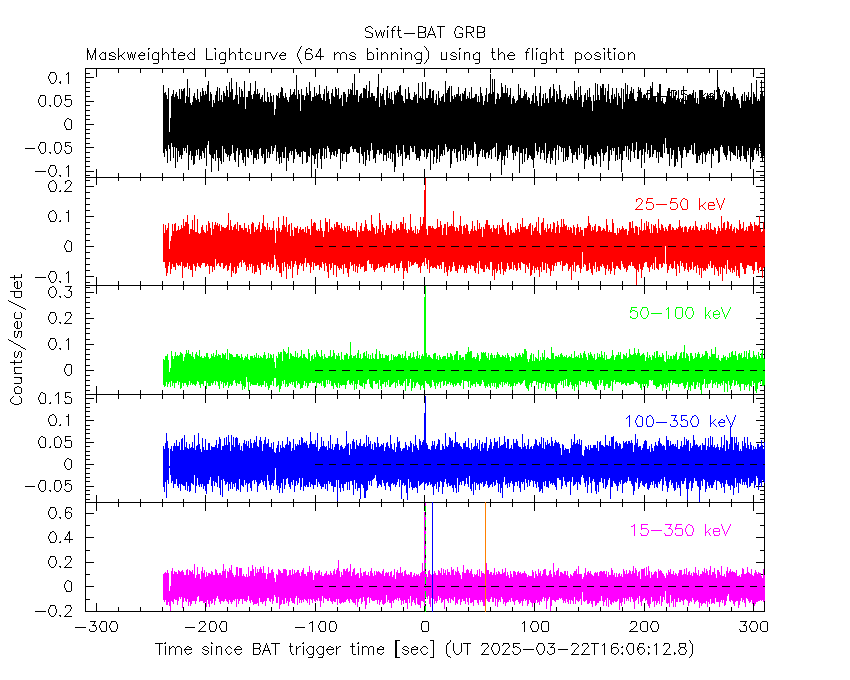
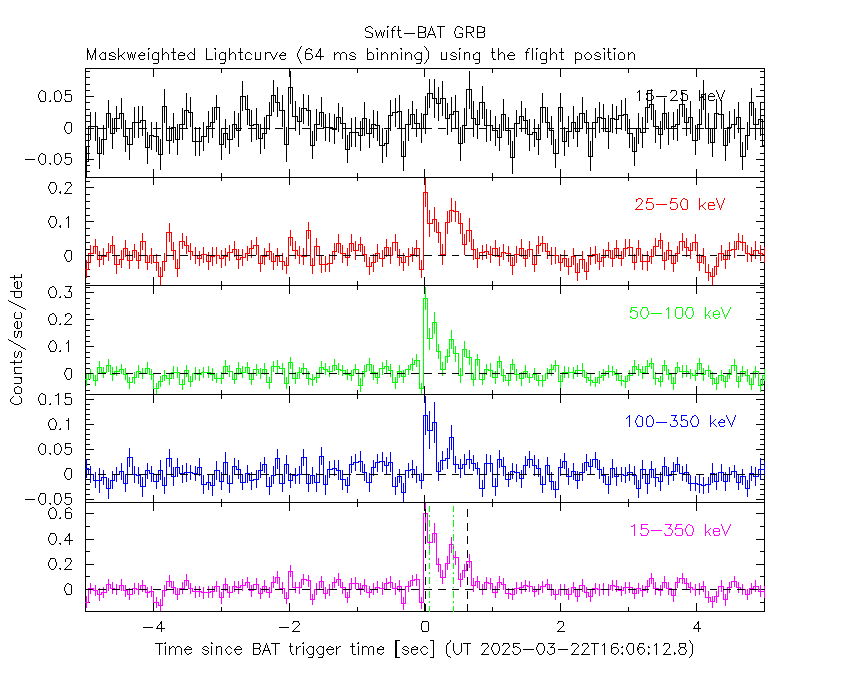
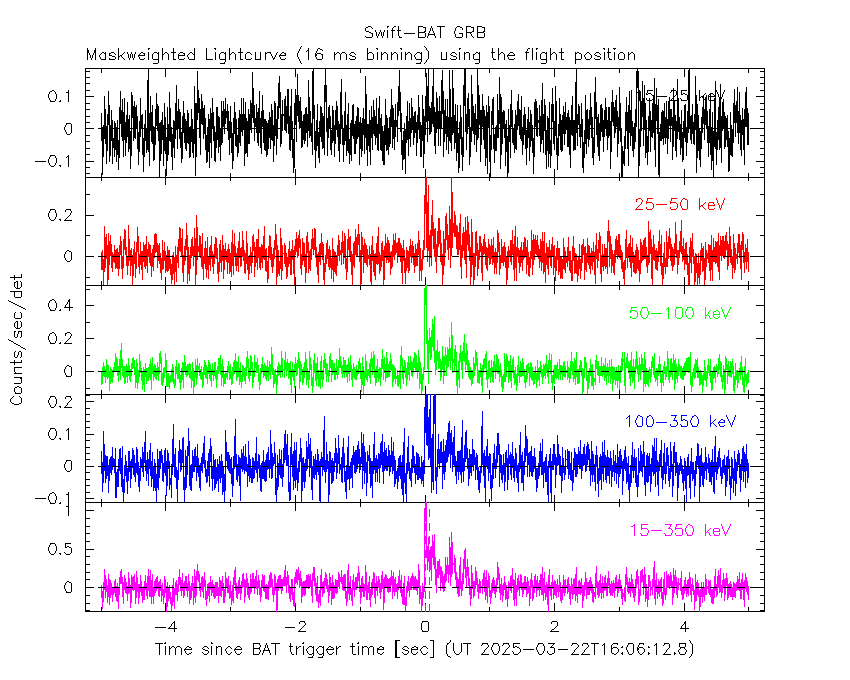
Lightcurves
Notes:
- 1) The mask-weighted light curves are using the flight position.
- 2) Multiple plots of different time binning/intervals are shown to cover all scenarios of short/long GRBs, rate/image triggers, and real/false positives.
- 3) For all the mask-weighted lightcurves, the y-axis units are counts/sec/det where a det is 0.4 x 0.4 = 0.16 sq cm.
- 4) The verticle lines correspond to following: green dotted lines are T50 interval, black dotted lines are T90 interval, blue solid line(s) is a spacecraft slew start time, and orange solid line(s) is a spacecraft slew end time.
- 5) Time of each bin is in the middle of the bin.
1 s binning
From T0-310 s to T0+310 s

From T100_start - 20 s to T100_end + 30 s

Full time interval

64 ms binning
Full time interval
From T100_start to T100_end

From T0-5 sec to T0+5 sec
16 ms binning
From T100_start-5 s to T100_start+5 s
Blue+Cyan dotted lines: Time interval of the scaled map
From 0.000000 to 0.064000
8 ms binning
From T100_start-3 s to T100_start+3 s

Blue+Cyan dotted lines: Time interval of the scaled map
From 0.000000 to 0.064000
2 ms binning
From T100_start-1 s to T100_start+1 s

Blue+Cyan dotted lines: Time interval of the scaled map
From 0.000000 to 0.064000
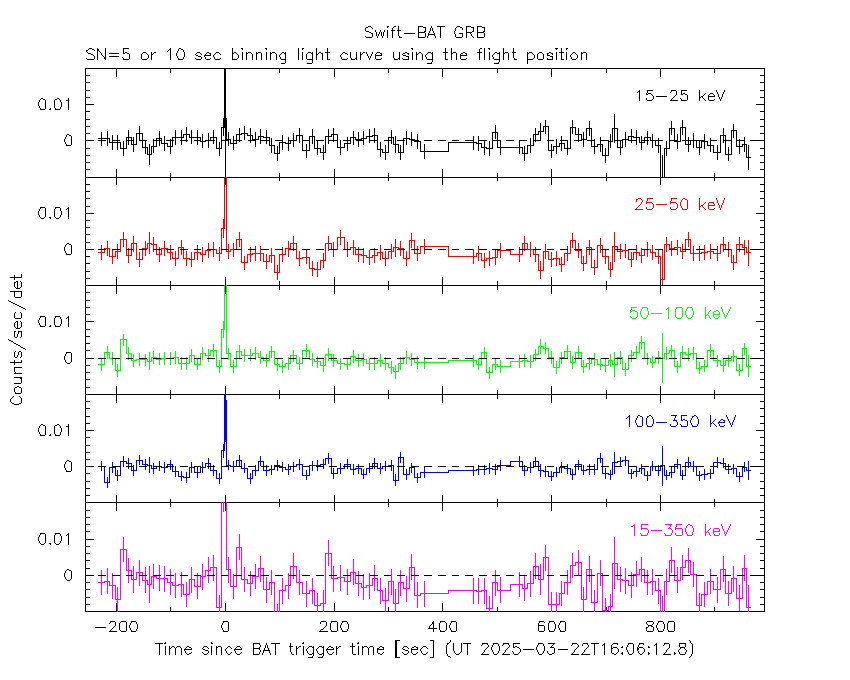
SN=5 or 10 sec. binning (whichever binning is satisfied first)
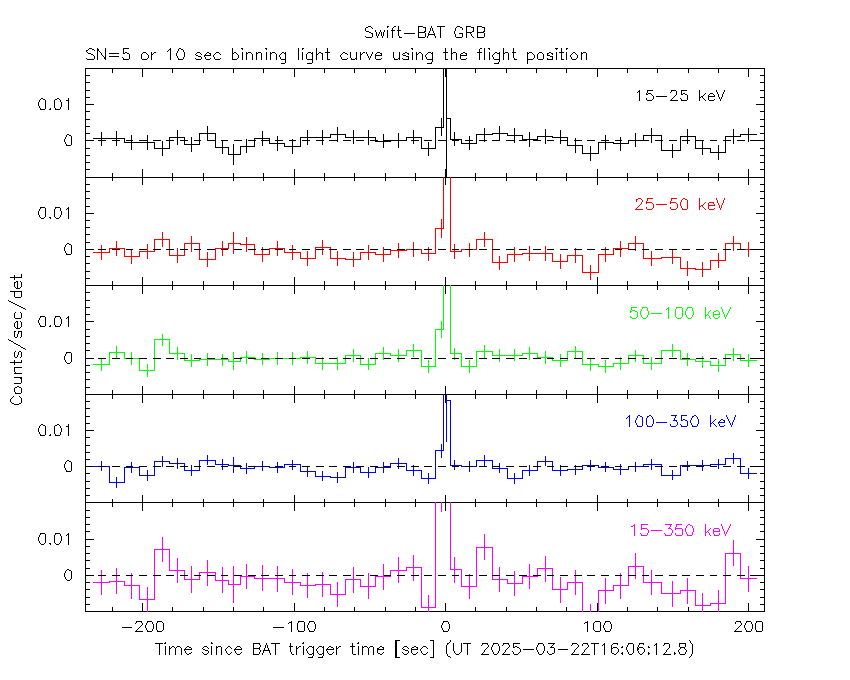
SN=5 or 10 sec. binning (T < 200 sec)
Quad-rate summed light curves (from T0-300s to T0+1000s)

Spectral Evolution

Spectra
Notes:
- 1) The fitting includes the systematic errors.
- 2) When the burst includes telescope slew time periods, the fitting uses an average response file made from multiple 5-s response files through out the slew time plus single time preiod for the non-slew times, and weighted by the total counts in the corresponding time period using addrmf. An average response file is needed becuase a spectral fit using the pre-slew DRM will introduce some errors in both a spectral shape and a normalization if the PHA file contains a lot of the slew/post-slew time interval.
- 3) For fits to more complicated models (e.g. a power-law over a cutoff power-law), the BAT team has decided to require a chi-square improvement of more than 6 for each extra dof.
Time averaged spectrum fit using the average DRM
Power-law model

Time interval is from    0.000 sec. to    0.672 sec.

Spectral model in power-law:
------------------------------------------------------------
Parameters  : value       lower 90%   higher 90%
Photon index: 0.651269     ( -0.192811   0.18078 )
Norm@50keV  : 1.73790E-02    ( -0.00202864   0.00199605 )
------------------------------------------------------------
#Fit statistic  : Chi-Squared                   74.85     using 59 bins.
 Reduced chi-squared = 1.31316
# Null hypothesis probability of 5.65e-02 with 57 degrees of freedom

Photon flux (15-150 keV)    in 0.672 sec: 2.01758 ( -0.22036  0.22089 ) ph/cm2/s
Energy fluence (15-150 keV)             : 1.45787e-07 ( -1.63617e-08  1.64235e-08 ) ergs/cm2
Cutoff power-law model

Time interval is from    0.000 sec. to    0.672 sec.
Spectral model in the cutoff power-law:
------------------------------------------------------------
Parameters  : value       lower 90%   higher 90%
Photon index: 1.55048E-02     ( -0.910639   0.700049 )
Epeak [keV] : 183.400      ( -75.633 -183.45 )
Norm@50keV  : 3.29616E-02    ( -0.016386   0.0458304 )
------------------------------------------------------------
#Fit statistic  : Chi-Squared                   72.78     using 59 bins.
 Reduced chi-squared = 1.29964
# Null hypothesis probability of 6.53e-02 with 56 degrees of freedom

Photon flux (15-150 keV)    in 0.672 sec: 1.98538 ( -0.22425  0.22436 ) ph/cm2/s
Energy fluence (15-150 keV)             : 1.41684e-07 ( -1.79982e-08  1.75184e-08 ) ergs/cm2
Band function

Time interval is from    0.000 sec. to    0.672 sec.


Spectral model in the Band function:
------------------------------------------------------------
Parameters  : value       lower 90%   higher 90%
alpha       :    (     )
beta        :     (     )
Epeak [keV] :       (   )
Norm@50keV   :     (     )
------------------------------------------------------------

Photon flux (15-150 keV)    in  sec:  (    ) ph/cm2/s
Energy fluence (15-150 keV)             : 0 ( 0  0 ) ergs/cm2
Single BB

Spectral model blackbody:
------------------------------------------------------------
Parameters  : value    Lower 90%  Upper 90%
kT [keV]    : 26.0854  (-3.78188  4.95254)
R^2/D10^2   : 4.69969E-02  (-0.0186131   0.0280757)
(R is the radius in km and D10 is the distance to the source in units of 10 kpc)
------------------------------------------------------------
#Fit statistic  : Chi-Squared                   78.68     using 59 bins.
 Reduced chi-squared =
# Null hypothesis probability of 3.01e-02 with 57 degrees of freedom

Energy  Fluence     90% Error
[keV]   [erg/cm2]   [erg/cm2]
15- 25  3.648e-09   7.694e-10
25- 50  2.114e-08   4.005e-09
50-150  1.059e-07   2.073e-08
15-150  1.307e-07   2.060e-08
Thermal bremsstrahlung (OTTB)

Spectral model: thermal bremsstrahlung
------------------------------------------------------------
Parameters  : value         Lower 90%    Upper 90%
kT [keV]    : 199.363       (      )
Norm        : 7.41576       (     )
------------------------------------------------------------
#Fit statistic  : Chi-Squared                  136.94     using 59 bins.
 Reduced chi-squared =
# Null hypothesis probability of 1.58e-08 with 57 degrees of freedom

Energy  Fluence     90% Error
[keV]   [erg/cm2]   [erg/cm2]
15- 25  1.241e-08   6.918e-09
25- 50  2.387e-08   1.319e-08
50-150  5.235e-08   2.885e-08
15-150  8.863e-08   4.885e-08
Double BB

Spectral model: bbodyrad<1> + bbodyrad<2>
------------------------------------------------------------
Parameters  : value         Lower 90%    Upper 90%
kT1 [keV]   : 16.2235        (-5.50192      4.56887)
R1^2/D10^2  : 0.138568        (-0.0586208      0.129771)
kT2 [keV]   : 200.000        (-157.903      -200)
R2^2/D10^2  : 3.95476E-04    (-0.000161206   0.0022548)
------------------------------------------------------------
#Fit statistic  : Chi-Squared                   67.96     using 59 bins.
 Reduced chi-squared =
# Null hypothesis probability of 1.13e-01 with 55 degrees of freedom

Energy  Fluence     90% Error
[keV]   [erg/cm2]   [erg/cm2]
15- 25  5.466e-09   3.211e-09
25- 50  2.414e-08   1.389e-08
50-150  1.084e-07   5.779e-08
15-150  1.380e-07   7.431e-08
Peak spectrum fit
Power-law model

Time interval is from   -0.162 sec. to    0.838 sec.

Spectral model in power-law:
------------------------------------------------------------
Parameters  : value       lower 90%   higher 90%
Photon index: 0.613380     ( -0.214977   0.198976 )
Norm@50keV  : 1.21101E-02    ( -0.00156494   0.00152755 )
------------------------------------------------------------
#Fit statistic  : Chi-Squared                   68.25     using 59 bins.
 Reduced chi-squared = 1.19737
# Null hypothesis probability of 1.46e-01 with 57 degrees of freedom

Photon flux (15-150 keV)    in 1 sec: 1.41166 ( -0.16585  0.1665 ) ph/cm2/s
Energy fluence (15-150 keV)             : 1.5389e-07 ( -1.79836e-08  1.80393e-08 ) ergs/cm2
Cutoff power-law model

Time interval is from   -0.162 sec. to    0.838 sec.
Spectral model in the cutoff power-law:
------------------------------------------------------------
Parameters  : value       lower 90%   higher 90%
Photon index: 0.211956     ( -0.953025   0.51682 )
Epeak [keV] : 268.465      ( -268.596 -268.596 )
Norm@50keV  : 1.79563E-02    ( -0.00702596   0.025521 )
------------------------------------------------------------
#Fit statistic  : Chi-Squared                   67.53     using 59 bins.
 Reduced chi-squared = 1.20589
# Null hypothesis probability of 1.39e-01 with 56 degrees of freedom

Photon flux (15-150 keV)    in 1 sec: 1.39737 ( -0.16814  0.16876 ) ph/cm2/s
Energy fluence (15-150 keV)             : 1.51555e-07 ( -1.93006e-08  1.88177e-08 ) ergs/cm2
Band function

Time interval is from   -0.162 sec. to    0.838 sec.


Spectral model in the Band function:
------------------------------------------------------------
Parameters  : value       lower 90%   higher 90%
alpha       :    (     )
beta        :     (     )
Epeak [keV] :       (   )
Norm@50keV   :     (     )
------------------------------------------------------------

Photon flux (15-150 keV)    in  sec:  (    ) ph/cm2/s
Energy fluence (15-150 keV)             : 0 ( 0  0 ) ergs/cm2
Single BB

Spectral model blackbody:
------------------------------------------------------------
Parameters  : value    Lower 90%  Upper 90%
kT [keV]    : 27.7831  (-4.45013  6.14709)
R^2/D10^2   : 2.73961E-02  (-0.0118475   0.0185508)
(R is the radius in km and D10 is the distance to the source in units of 10 kpc)
------------------------------------------------------------
#Fit statistic  : Chi-Squared                   74.07     using 59 bins.
 Reduced chi-squared =
# Null hypothesis probability of 6.38e-02 with 57 degrees of freedom

Energy  Fluence     90% Error
[keV]   [erg/cm2]   [erg/cm2]
15- 25  3.464e-09   8.945e-10
25- 50  2.067e-08   4.365e-09
50-150  1.157e-07   2.137e-08
15-150  1.398e-07   2.510e-08
Thermal bremsstrahlung (OTTB)

Spectral model: thermal bremsstrahlung
------------------------------------------------------------
Parameters  : value         Lower 90%    Upper 90%
kT [keV]    : 199.362       (      )
Norm        : 5.31087       (     )
------------------------------------------------------------
#Fit statistic  : Chi-Squared                  126.92     using 59 bins.
 Reduced chi-squared =
# Null hypothesis probability of 3.08e-07 with 57 degrees of freedom

Energy  Fluence     90% Error
[keV]   [erg/cm2]   [erg/cm2]
15- 25  1.322e-08   7.455e-09
25- 50  2.544e-08   1.415e-08
50-150  5.579e-08   3.132e-08
15-150  9.446e-08   5.270e-08
Double BB

Spectral model: bbodyrad<1> + bbodyrad<2>
------------------------------------------------------------
Parameters  : value         Lower 90%    Upper 90%
kT1 [keV]   : 15.8850        (-3.84455      4.61413)
R1^2/D10^2  : 9.85979E-02        (-0.0445981      0.0958478)
kT2 [keV]   : 200.000        (-6.48334      -200)
R2^2/D10^2  : 3.05922E-04    (-0.000115614   0.00161087)
------------------------------------------------------------
#Fit statistic  : Chi-Squared                   62.72     using 59 bins.
 Reduced chi-squared =
# Null hypothesis probability of 2.21e-01 with 55 degrees of freedom

Energy  Fluence     90% Error
[keV]   [erg/cm2]   [erg/cm2]
15- 25  5.656e-09   3.233e-09
25- 50  2.478e-08   1.430e-08
50-150  1.209e-07   9.140e-08
15-150  1.514e-07   8.475e-08
Pre-slew spectrum (Pre-slew PHA with pre-slew DRM)
Power-law model

Spectral model in power-law:
------------------------------------------------------------
Parameters  : value       lower 90%   higher 90%
Photon index: 0.651269     ( -0.192811   0.18078 )
Norm@50keV  : 1.73790E-02    ( -0.00202864   0.00199605 )
------------------------------------------------------------
#Fit statistic  : Chi-Squared                   74.85     using 59 bins.
 Reduced chi-squared =
# Null hypothesis probability of 5.65e-02 with 57 degrees of freedom

Photon flux (15-150 keV)    in 0.672 sec: 2.01761 ( -0.220345  0.2209 ) ph/cm2/s
Energy fluence (15-150 keV)             : 1.45772e-07 ( -1.63586e-08  1.64252e-08 ) ergs/cm2
Cutoff power-law model

Spectral model in the cutoff power-law:
------------------------------------------------------------
Parameters  : value       lower 90%   higher 90%
Photon index: 1.58554E-02     ( -0.910749   0.699938 )
Epeak [keV] : 183.500      ( -75.7549 -183.456 )
Norm@50keV  : 3.29461E-02    ( -0.0163858   0.045832 )
------------------------------------------------------------
#Fit statistic  : Chi-Squared                   72.78     using 59 bins.
 Reduced chi-squared =
# Null hypothesis probability of 6.53e-02 with 56 degrees of freedom

Photon flux (15-150 keV)    in 0.672 sec: 1.98541 ( -0.22424  0.22429 ) ph/cm2/s
Energy fluence (15-150 keV)             : 1.41758e-07 ( -1.80042e-08  1.75251e-08 ) ergs/cm2
Band function

Spectral model in the Band function:
------------------------------------------------------------
Parameters  : value       lower 90%   higher 90%
alpha       :    (     )
beta        :     (     )
Epeak [keV] :       (   )
Norm@50keV   :     (     )
------------------------------------------------------------

Photon flux (15-150 keV)    in  sec:  (    ) ph/cm2/s
Energy fluence (15-150 keV)             : 0 ( 0  0 ) ergs/cm2
S(25-50 keV) vs. S(50-100 keV) plot
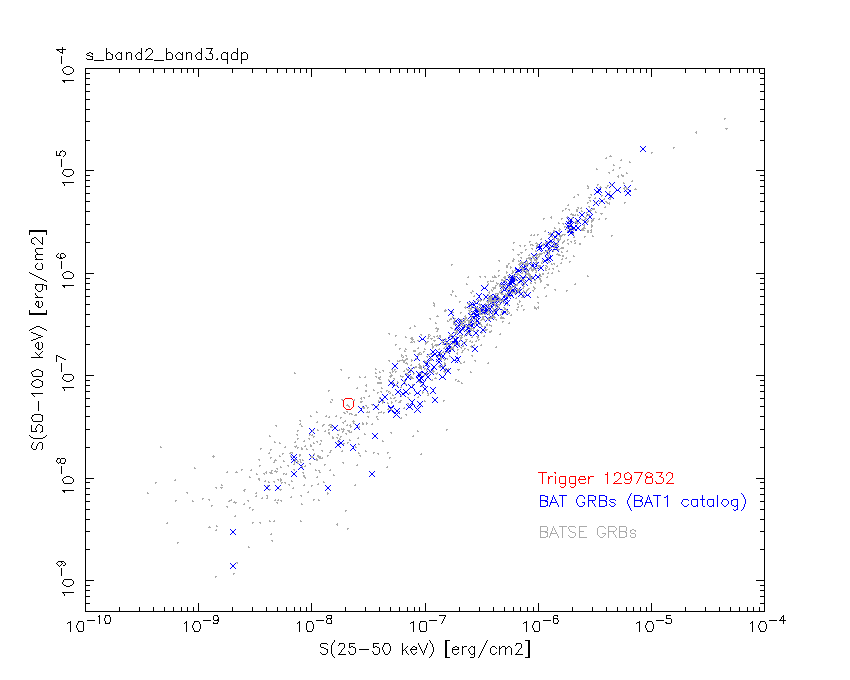
S(25-50 keV)  = 2.10e-08
S(50-100 keV) = 5.36e-08
T90 vs. Hardness ratio plot

T90                                   = 0.623999953269958 sec.
Hardness ratio (energy fluence ratio) = 2.55238
Color vs. Color plot
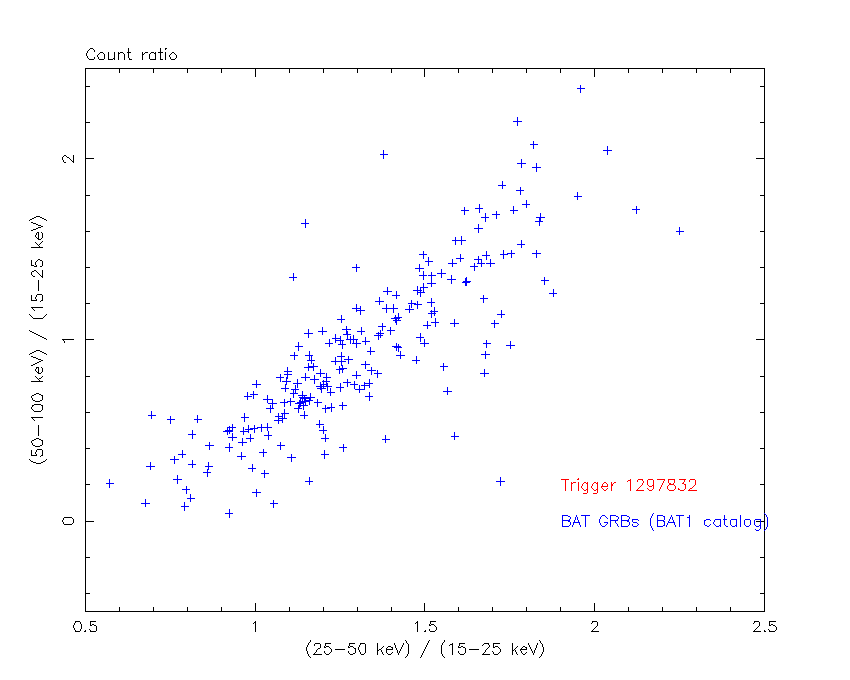
Count Ratio  (25-50 keV) / (15-25 keV) = 2.99481
Count Ratio (50-100 keV) / (15-25 keV) = 3.26648
Mask shadow pattern

IMX = -2.502594187900978E-01, IMY = -6.331959160498919E-02
TIME vs. PHA plot around the trigger time

Blue+Cyan dotted lines: Time interval of the scaled map
From 0.000000 to 0.064000
TIME vs. DetID plot around the trigger time

Blue+Cyan dotted lines: Time interval of the scaled map
From 0.000000 to 0.064000
100 us light curve (15-350 keV)

Blue+Cyan dotted lines: Time interval of the scaled map
From 0.000000 to 0.064000
Spacecraft aspect plot

Bright source in the pre-burst/pre-slew/post-slew images
Pre-burst image of 15-350 keV band
Time interval of the image:
-239.128000 0.000000

# RAcent  DECcent POSerr Theta    Phi  PeakCts   SNR AngSep     Name
#  [deg]    [deg]    ['] [deg]  [deg]                   [']
 83.6377  22.0177    0.5  17.8  -81.9   9.5346  23.8    0.3	Crab
129.1510 -16.3541    2.3  45.6  145.2   5.7394   4.9 ------	UNKNOWN
134.4640  29.3759    3.1  29.7   69.3   2.2008   3.8 ------	UNKNOWN
Pre-slew background subtracted image of 15-350 keV band
Time interval of the image:
0.000000 0.672000

# RAcent  DECcent POSerr Theta    Phi  PeakCts   SNR AngSep     Name
#  [deg]    [deg]    ['] [deg]  [deg]                   [']
 83.6053  22.0103    3.9  17.8  -81.9  -0.0399  -3.0    1.6	Crab
106.7755   7.1966    0.7  14.5  165.8   0.2048  16.3 ------	UNKNOWN
102.4844 -30.0240    1.9  51.2 -177.8   0.1928   6.1 ------	UNKNOWN
Post-slew image of 15-350 keV band
Time interval of the image:
55.772610 716.176200
720.872000 962.992000

# RAcent  DECcent POSerr Theta    Phi  PeakCts   SNR AngSep     Name
#  [deg]    [deg]    ['] [deg]  [deg]                   [']
 83.6512  22.0255    0.5  26.7  -56.5  36.0869  24.3    1.2	Crab
 93.2892 -39.1434    3.1  48.0 -168.6  10.1226   3.7 ------	UNKNOWN
 72.4751  14.8105    2.4  34.4  -76.9  10.7029   4.7 ------	UNKNOWN
 72.0748  21.4529    1.8  36.3  -65.9  15.3491   6.5 ------	UNKNOWN
Plot creation:
Fri Jun 20 01:46:52 EDT 2025