Estimated redshift from machine learning (Ukwatta et al. 2016) - may take a few minute to calcaulte
Image
Pre-slew 15.0-350.0 keV image (Event data)

#   RAcent    DECcent   POSerr    Theta     Phi              Peak Cts       SNR   Name
  252.6855   -86.8749   0.0067    17.2218     3.6411         1.5468361     28.637 TRIG_01299776

Foreground time interval of the image:
 -0.164  11.197 (delta_t =  11.361 [sec])
Background time interval of the image:
-179.504  -0.164 (delta_t = 179.340 [sec])
Lightcurves
Notes:
- 1) The mask-weighted light curves are using the flight position.
- 2) Multiple plots of different time binning/intervals are shown to cover all scenarios of short/long GRBs, rate/image triggers, and real/false positives.
- 3) For all the mask-weighted lightcurves, the y-axis units are counts/sec/det where a det is 0.4 x 0.4 = 0.16 sq cm.
- 4) The verticle lines correspond to following: green dotted lines are T50 interval, black dotted lines are T90 interval, blue solid line(s) is a spacecraft slew start time, and orange solid line(s) is a spacecraft slew end time.
- 5) Time of each bin is in the middle of the bin.
1 s binning
From T0-310 s to T0+310 s

From T100_start - 20 s to T100_end + 30 s

Full time interval

64 ms binning
Full time interval

From T100_start to T100_end

From T0-5 sec to T0+5 sec

16 ms binning
From T100_start-5 s to T100_start+5 s

8 ms binning
From T100_start-3 s to T100_start+3 s

2 ms binning
From T100_start-1 s to T100_start+1 s

SN=5 or 10 sec. binning (whichever binning is satisfied first)

SN=5 or 10 sec. binning (T < 200 sec)

Quad-rate summed light curves (from T0-300s to T0+1000s)

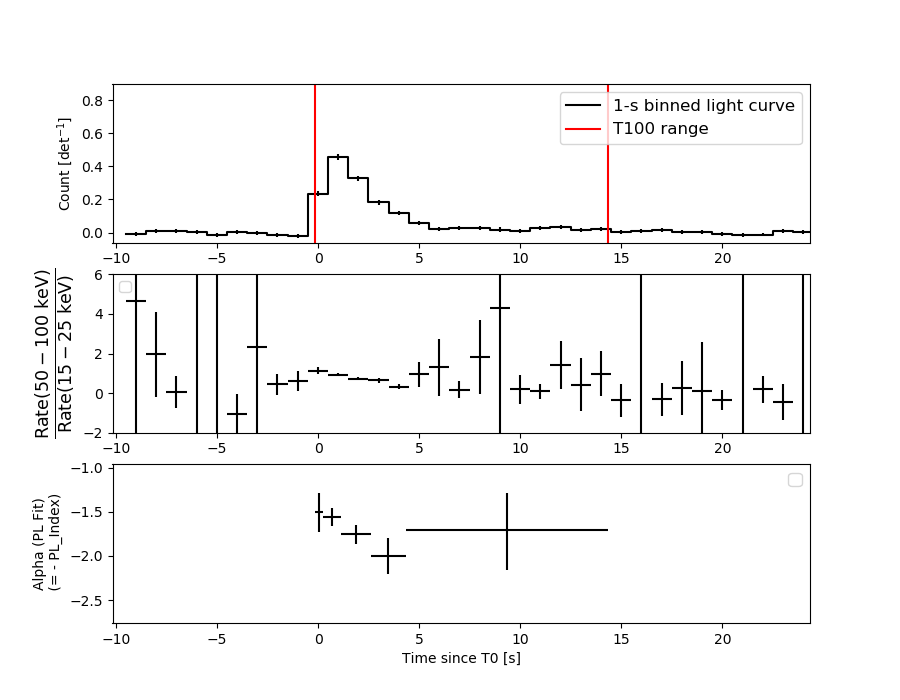
Spectral Evolution
Spectra
Notes:
- 1) The fitting includes the systematic errors.
- 2) When the burst includes telescope slew time periods, the fitting uses an average response file made from multiple 5-s response files through out the slew time plus single time preiod for the non-slew times, and weighted by the total counts in the corresponding time period using addrmf. An average response file is needed becuase a spectral fit using the pre-slew DRM will introduce some errors in both a spectral shape and a normalization if the PHA file contains a lot of the slew/post-slew time interval.
- 3) For fits to more complicated models (e.g. a power-law over a cutoff power-law), the BAT team has decided to require a chi-square improvement of more than 6 for each extra dof.
Time averaged spectrum fit using the average DRM
Power-law model
Time interval is from   -0.164 sec. to   14.332 sec.

Spectral model in power-law:
------------------------------------------------------------
Parameters  : value       lower 90%   higher 90%
Photon index: 1.71727     ( -0.0956376   0.096803 )
Norm@50keV  : 6.84509E-03    ( -0.000395   0.000392443 )
------------------------------------------------------------
#Fit statistic  : Chi-Squared                   65.90     using 59 bins.
 Reduced chi-squared = 1.15614
# Null hypothesis probability of 1.96e-01 with 57 degrees of freedom

Photon flux (15-150 keV)    in 14.5 sec: 0.914699 ( -0.049683  0.049736 ) ph/cm2/s
Energy fluence (15-150 keV)             : 9.17905e-07 ( -5.52881e-08  5.57116e-08 ) ergs/cm2
Cutoff power-law model
Time interval is from   -0.164 sec. to   14.332 sec.
Spectral model in the cutoff power-law:
------------------------------------------------------------
Parameters  : value       lower 90%   higher 90%
Photon index: 1.24338     ( -0.418129   0.379223 )
Epeak [keV] : 74.1508      ( -16.3614 98.846 )
Norm@50keV  : 1.22473E-02    ( -0.00446368   0.00803196 )
------------------------------------------------------------
#Fit statistic  : Chi-Squared                   61.23     using 59 bins.
 Reduced chi-squared = 1.09339
# Null hypothesis probability of 2.94e-01 with 56 degrees of freedom

Photon flux (15-150 keV)    in 14.5 sec: 0.893351 ( -0.052434  0.052427 ) ph/cm2/s
Energy fluence (15-150 keV)             : 8.77643e-07 ( -6.33737e-08  6.38303e-08 ) ergs/cm2
Band function

Time interval is from   -0.164 sec. to   14.332 sec.


Spectral model in the Band function:
------------------------------------------------------------
Parameters  : value       lower 90%   higher 90%
alpha       :    (     )
beta        :     (     )
Epeak [keV] :       (   )
Norm@50keV   :     (     )
------------------------------------------------------------

Photon flux (15-150 keV)    in  sec:  (    ) ph/cm2/s
Energy fluence (15-150 keV)             : 0 ( 0  0 ) ergs/cm2
Single BB
Spectral model blackbody:
------------------------------------------------------------
Parameters  : value    Lower 90%  Upper 90%
kT [keV]    : 12.5306  (  )
R^2/D10^2   : 0.186581  (   )
(R is the radius in km and D10 is the distance to the source in units of 10 kpc)
------------------------------------------------------------
#Fit statistic  : Chi-Squared                  130.82     using 59 bins.
 Reduced chi-squared =
# Null hypothesis probability of 9.85e-08 with 57 degrees of freedom

Energy  Fluence     90% Error
[keV]   [erg/cm2]   [erg/cm2]
15- 25  9.007e-08   8.968e-09
25- 50  2.979e-07   1.711e-08
50-150  2.892e-07   3.400e-08
15-150  6.772e-07   4.103e-08
Thermal bremsstrahlung (OTTB)
Spectral model: thermal bremsstrahlung
------------------------------------------------------------
Parameters  : value         Lower 90%    Upper 90%
kT [keV]    : 123.493       (-26.144      35.3717)
Norm        : 3.85880       (-0.259171     0.306847)
------------------------------------------------------------
#Fit statistic  : Chi-Squared                   61.18     using 59 bins.
 Reduced chi-squared =
# Null hypothesis probability of 3.28e-01 with 57 degrees of freedom

Energy  Fluence     90% Error
[keV]   [erg/cm2]   [erg/cm2]
15- 25  1.456e-07   1.258e-08
25- 50  2.617e-07   1.899e-08
50-150  4.736e-07   1.426e-07
15-150  8.808e-07   1.572e-07
Double BB
Spectral model: bbodyrad<1> + bbodyrad<2>
------------------------------------------------------------
Parameters  : value         Lower 90%    Upper 90%
kT1 [keV]   : 6.48884        (-1.0718      1.24307)
R1^2/D10^2  : 1.34901        (-0.589643      1.18846)
kT2 [keV]   : 22.2716        (-3.62926      6.01665)
R2^2/D10^2  : 1.70899E-02    (-0.0101917   0.0174921)
------------------------------------------------------------
#Fit statistic  : Chi-Squared                   59.73     using 59 bins.
 Reduced chi-squared =
# Null hypothesis probability of 3.08e-01 with 55 degrees of freedom

Energy  Fluence     90% Error
[keV]   [erg/cm2]   [erg/cm2]
15- 25  1.441e-07   2.522e-08
25- 50  2.634e-07   4.227e-08
50-150  4.644e-07   1.329e-07
15-150  8.719e-07   1.747e-07
Peak spectrum fit
Power-law model
Time interval is from    0.260 sec. to    1.260 sec.

Spectral model in power-law:
------------------------------------------------------------
Parameters  : value       lower 90%   higher 90%
Photon index: 1.59309     ( -0.0995177   0.100489 )
Norm@50keV  : 3.13509E-02    ( -0.00192915   0.00191941 )
------------------------------------------------------------
#Fit statistic  : Chi-Squared                   64.51     using 59 bins.
 Reduced chi-squared = 1.13175
# Null hypothesis probability of 2.31e-01 with 57 degrees of freedom

Photon flux (15-150 keV)    in 1 sec: 4.02030 ( -0.23766  0.23781 ) ph/cm2/s
Energy fluence (15-150 keV)             : 2.93488e-07 ( -1.94126e-08  1.95449e-08 ) ergs/cm2
Cutoff power-law model
Time interval is from    0.260 sec. to    1.260 sec.
Spectral model in the cutoff power-law:
------------------------------------------------------------
Parameters  : value       lower 90%   higher 90%
Photon index: 1.09182     ( -0.442262   0.397946 )
Epeak [keV] : 85.7158      ( -21.0237 132.178 )
Norm@50keV  : 5.78368E-02    ( -0.0218246   0.0405305 )
------------------------------------------------------------
#Fit statistic  : Chi-Squared                   59.75     using 59 bins.
 Reduced chi-squared = 1.06696
# Null hypothesis probability of 3.41e-01 with 56 degrees of freedom

Photon flux (15-150 keV)    in 1 sec: 3.94274 ( -0.24573  0.24555 ) ph/cm2/s
Energy fluence (15-150 keV)             : 2.81203e-07 ( -2.18209e-08  2.1844e-08 ) ergs/cm2
Band function

Time interval is from    0.260 sec. to    1.260 sec.


Spectral model in the Band function:
------------------------------------------------------------
Parameters  : value       lower 90%   higher 90%
alpha       :    (     )
beta        :     (     )
Epeak [keV] :       (   )
Norm@50keV   :     (     )
------------------------------------------------------------

Photon flux (15-150 keV)    in  sec:  (    ) ph/cm2/s
Energy fluence (15-150 keV)             : 0 ( 0  0 ) ergs/cm2
Single BB
Spectral model blackbody:
------------------------------------------------------------
Parameters  : value    Lower 90%  Upper 90%
kT [keV]    : 13.2081  (  )
R^2/D10^2   : 0.706424  (   )
(R is the radius in km and D10 is the distance to the source in units of 10 kpc)
------------------------------------------------------------
#Fit statistic  : Chi-Squared                  115.83     using 59 bins.
 Reduced chi-squared =
# Null hypothesis probability of 6.83e-06 with 57 degrees of freedom

Energy  Fluence     90% Error
[keV]   [erg/cm2]   [erg/cm2]
15- 25  2.613e-08   2.750e-09
25- 50  9.153e-08   6.295e-09
50-150  1.019e-07   1.424e-08
15-150  2.196e-07   1.615e-08
Thermal bremsstrahlung (OTTB)
Spectral model: thermal bremsstrahlung
------------------------------------------------------------
Parameters  : value         Lower 90%    Upper 90%
kT [keV]    : 167.915       (-42.3096      -167.916)
Norm        : 16.5572       (-1.05402     1.14923)
------------------------------------------------------------
#Fit statistic  : Chi-Squared                   60.09     using 59 bins.
 Reduced chi-squared =
# Null hypothesis probability of 3.64e-01 with 57 degrees of freedom

Energy  Fluence     90% Error
[keV]   [erg/cm2]   [erg/cm2]
15- 25  4.207e-08   3.765e-09
25- 50  7.922e-08   1.141e-08
50-150  1.635e-07   5.564e-08
15-150  2.848e-07   7.975e-08
Double BB

Spectral model: bbodyrad<1> + bbodyrad<2>
------------------------------------------------------------
Parameters  : value         Lower 90%    Upper 90%
kT1 [keV]   : 7.77645        (-1.38957      1.46698)
R1^2/D10^2  : 3.23267        (-1.31024      2.71767)
kT2 [keV]   : 27.7903        (-6.3011      12.8955)
R2^2/D10^2  : 3.51075E-02    (-0.0251854   0.0576158)
------------------------------------------------------------
#Fit statistic  : Chi-Squared                   57.10     using 59 bins.
 Reduced chi-squared =
# Null hypothesis probability of 3.97e-01 with 55 degrees of freedom

Energy  Fluence     90% Error
[keV]   [erg/cm2]   [erg/cm2]
15- 25  3.903e-08   6.685e-09
25- 50  8.410e-08   1.329e-08
50-150  1.622e-07   7.414e-08
15-150  2.853e-07   8.550e-08
Pre-slew spectrum (Pre-slew PHA with pre-slew DRM)
Power-law model

Spectral model in power-law:
------------------------------------------------------------
Parameters  : value       lower 90%   higher 90%
Photon index: 1.72568     ( -0.0911371   0.0921949 )
Norm@50keV  : 8.31189E-03    ( -0.000458395   0.000455608 )
------------------------------------------------------------
#Fit statistic  : Chi-Squared                   78.10     using 59 bins.
 Reduced chi-squared =
# Null hypothesis probability of 3.32e-02 with 57 degrees of freedom

Photon flux (15-150 keV)    in 11.36 sec: 1.11400 ( -0.0578845  0.0579447 ) ph/cm2/s
Energy fluence (15-150 keV)             : 8.72602e-07 ( -5.01383e-08  5.04718e-08 ) ergs/cm2
Cutoff power-law model

Spectral model in the cutoff power-law:
------------------------------------------------------------
Parameters  : value       lower 90%   higher 90%
Photon index: 1.20096     ( -0.401857   0.365873 )
Epeak [keV] : 70.5675      ( -13.7464 54.4188 )
Norm@50keV  : 1.58386E-02    ( -0.00562135   0.00989206 )
------------------------------------------------------------
#Fit statistic  : Chi-Squared                   71.85     using 59 bins.
 Reduced chi-squared =
# Null hypothesis probability of 7.52e-02 with 56 degrees of freedom

Photon flux (15-150 keV)    in 11.36 sec: 1.08518 ( -0.06106  0.06106 ) ph/cm2/s
Energy fluence (15-150 keV)             : 8.30982e-07 ( -5.73635e-08  5.78565e-08 ) ergs/cm2
Band function

Spectral model in the Band function:
------------------------------------------------------------
Parameters  : value       lower 90%   higher 90%
alpha       :    (     )
beta        :     (     )
Epeak [keV] :       (   )
Norm@50keV   :     (     )
------------------------------------------------------------

Photon flux (15-150 keV)    in  sec:  (    ) ph/cm2/s
Energy fluence (15-150 keV)             : 0 ( 0  0 ) ergs/cm2
S(25-50 keV) vs. S(50-100 keV) plot

S(25-50 keV)  = 2.51e-07
S(50-100 keV) = 3.05e-07
T90 vs. Hardness ratio plot

T90                                   = 11.271999835968 sec.
Hardness ratio (energy fluence ratio) = 1.21514
Color vs. Color plot

Count Ratio  (25-50 keV) / (15-25 keV) = 1.29329
Count Ratio (50-100 keV) / (15-25 keV) = 0.783895
Mask shadow pattern

IMX = 3.093429333188491E-01, IMY = -1.968498043503954E-02
TIME vs. PHA plot around the trigger time

TIME vs. DetID plot around the trigger time

100 us light curve (15-350 keV)

Spacecraft aspect plot

Bright source in the pre-burst/pre-slew/post-slew images
Pre-burst image of 15-350 keV band
Time interval of the image:
-179.504000 -0.164000

# RAcent  DECcent POSerr Theta    Phi  PeakCts   SNR AngSep     Name
#  [deg]    [deg]    ['] [deg]  [deg]                   [']
170.5114 -60.7466    5.7  39.6   46.2   2.4994   2.0    9.4	Cen X-3
186.4965 -62.9233    7.5  33.6   54.5   1.5253   1.5   10.2	GX 301-2
255.7459 -37.9423    0.0  34.1  147.3   1.6402   1.7   12.8	4U 1700-377
256.4235 -36.2733   10.1  35.6  148.8  -1.1637  -1.1    9.0	GX 349+2
263.1892 -24.6186    0.0  46.2  160.6   3.6514   2.2   12.4	GX 1+4
264.9526 -44.4159    6.9  26.4  158.2   1.1038   1.7    9.2	4U 1735-44
270.3091 -25.0744    3.6  45.1  169.5   4.1630   3.2    1.4	GX 5-1
270.3300 -25.7296    3.4  44.5  169.5   4.1761   3.4    1.7	GRS 1758-258
274.0909 -14.0575   32.0  56.0  174.8   1.3154   0.4    5.1	GX 17+2
276.0556 -30.4231   16.0  39.6  176.8  -0.6982  -0.7    7.5	H1820-303
285.0304 -24.9403   96.0  45.3 -171.6   0.1361   0.1    1.2	HT1900.1-2455
262.9719 -33.8811   25.1  37.0  158.5   0.4575   0.5    2.9	GX 354-0
118.7734 -56.0578    2.9  53.0   13.6  10.1959   4.0 ------	UNKNOWN
118.9965 -58.2179    1.9  50.9   13.4   9.5492   6.0 ------	UNKNOWN
Pre-slew background subtracted image of 15-350 keV band
Time interval of the image:
-0.164000 11.196600

# RAcent  DECcent POSerr Theta    Phi  PeakCts   SNR AngSep     Name
#  [deg]    [deg]    ['] [deg]  [deg]                   [']
170.3108 -60.6259   26.0  39.8   46.1  -0.0527  -0.4    0.2	Cen X-3
186.3602 -62.8154 1264.1  33.7   54.5  -0.0008  -0.0    8.6	GX 301-2
256.2116 -37.7422    8.4  34.2  148.0   0.1234   1.4   12.3	4U 1700-377
256.2525 -36.4325   11.2  35.5  148.6   0.0948   1.0    8.9	GX 349+2
262.9332 -24.8838   13.5  45.9  160.2  -0.1175  -0.9    9.3	GX 1+4
264.9636 -44.3850    8.6  26.4  158.2  -0.0859  -1.3   10.2	4U 1735-44
270.3963 -25.1211    4.3  45.1  169.7  -0.3016  -2.7    6.6	GX 5-1
270.3009 -25.6229    5.6  44.6  169.5  -0.2321  -2.0    7.2	GRS 1758-258
273.9691 -14.0051    7.3  56.0  174.7   0.5225   1.6    2.8	GX 17+2
275.8379 -30.3628    9.2  39.7  176.5   0.1101   1.2    4.5	H1820-303
284.9271 -24.9833   12.3  45.2 -171.7   0.0955   0.9    7.0	HT1900.1-2455
262.9789 -33.7778   15.6  37.1  158.5   0.0632   0.7    3.4	GX 354-0
163.7646 -65.9901    2.3  36.7   37.6   0.4885   4.9 ------	UNKNOWN
252.6853 -86.8749    0.4  17.2    3.6   1.5470  28.6 ------	UNKNOWN
Post-slew image of 15-350 keV band
Time interval of the image:
61.596600 209.996600

# RAcent  DECcent POSerr Theta    Phi  PeakCts   SNR AngSep     Name
#  [deg]    [deg]    ['] [deg]  [deg]                   [']
169.9981 -60.6555    7.9  29.1   65.8  -0.6128  -1.5    9.5	Cen X-3
186.5792 -62.6819    3.6  26.2   82.2   1.2388   3.2    5.7	GX 301-2
255.8467 -37.8174    5.5  49.1  157.4  -1.7084  -2.1    6.8	4U 1700-377
256.3474 -36.4213    3.5  50.5  157.9   2.9353   3.3    4.3	GX 349+2
264.9194 -44.4290  118.3  42.5  167.0   0.0496   0.1    7.7	4U 1735-44
276.0140 -30.4343    5.2  56.7  178.2  -2.6464  -2.2    6.1	H1820-303
263.0291 -33.9895    0.0  52.9  164.9   0.9834   1.0    9.5	GX 354-0
 64.6548 -38.7888    3.0  54.3  -33.6   5.9396   3.9 ------	UNKNOWN
Plot creation:
Fri Jun 20 01:45:12 EDT 2025