Click here for the BAT GCN circular template
Image
Pre-slew 15.0-350.0 keV image (Event data)

#   RAcent    DECcent   POSerr    Theta     Phi              Peak Cts       SNR   Name
  278.1381    26.3393   0.0014    26.0370    19.0621        25.2747729    142.207 TRIG_00130088

Foreground time interval of the image:
 -0.120   9.245 (delta_t =   9.365 [sec])
Background time interval of the image:
-136.355  -0.120 (delta_t = 136.235 [sec])
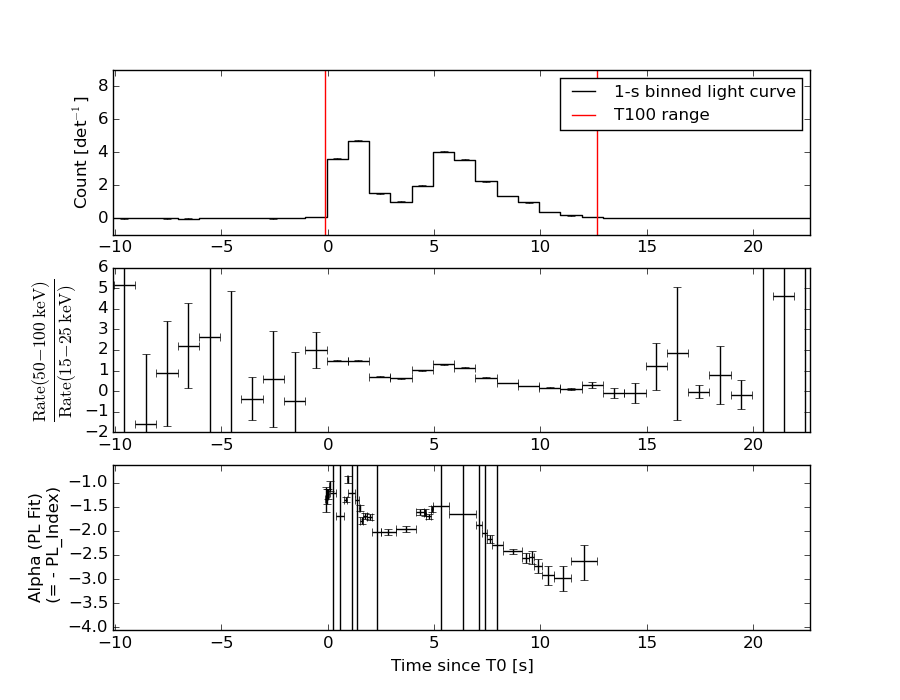
Lightcurves
Notes:
- 1) The mask-weighted light curves are using the flight position.
- 2) Multiple plots of different time binning/intervals are shown to cover all scenarios of short/long GRBs, rate/image triggers, and real/false positives.
- 3) For all the mask-weighted lightcurves, the y-axis units are counts/sec/det where a det is 0.4 x 0.4 = 0.16 sq cm.
- 4) The verticle lines correspond to following: green dotted lines are T50 interval, black dotted lines are T90 interval, blue solid line(s) is a spacecraft slew start time, and orange solid line(s) is a spacecraft slew end time.
- 5) Time of each bin is in the middle of the bin.
1 s binning
From T0-310 s to T0+310 s
From T100_start - 20 s to T100_end + 30 s

Full time interval
64 ms binning
Full time interval

From T100_start to T100_end

From T0-5 sec to T0+5 sec
16 ms binning
From T100_start-5 s to T100_start+5 s
Blue+Cyan dotted lines: Time interval of the scaled map
From 0.000000 to 0.064000
8 ms binning
From T100_start-3 s to T100_start+3 s
Blue+Cyan dotted lines: Time interval of the scaled map
From 0.000000 to 0.064000
2 ms binning
From T100_start-1 s to T100_start+1 s

Blue+Cyan dotted lines: Time interval of the scaled map
From 0.000000 to 0.064000
SN=5 or 10 sec. binning (whichever binning is satisfied first)
SN=5 or 10 sec. binning (T < 200 sec)
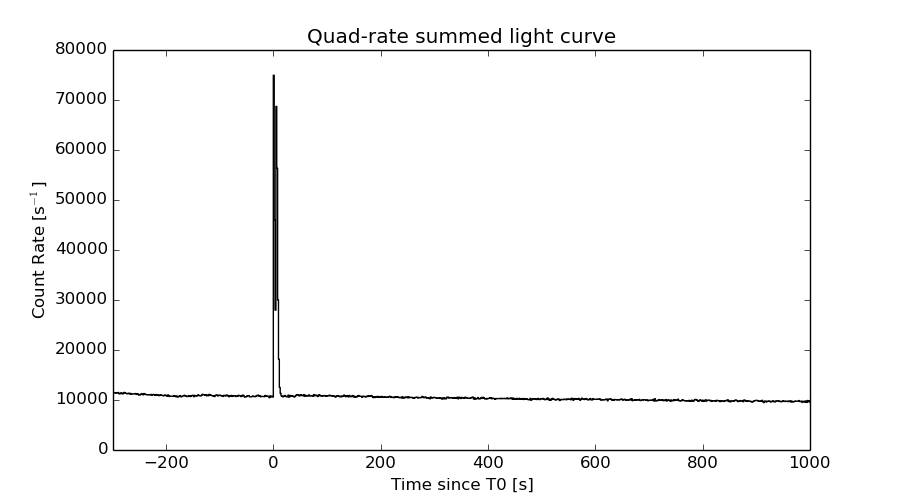
Quad-rate summed light curves (from T0-300s to T0+1000s)
Spectral Evolution
Spectra
Notes:
- 1) The fitting includes the systematic errors.
- 2) When the burst includes telescope slew time periods, the fitting uses an average response file made from multiple 5-s response files through out the slew time plus single time preiod for the non-slew times, and weighted by the total counts in the corresponding time period using addrmf. An average response file is needed becuase a spectral fit using the pre-slew DRM will introduce some errors in both a spectral shape and a normalization if the PHA file contains a lot of the slew/post-slew time interval.
- 3) For fits to more complicated models (e.g. a power-law over a cutoff power-law), the BAT team has decided to require a chi-square improvement of more than 6 for each extra dof.
Time averaged spectrum fit using the average DRM
Power-law model
Time interval is from   -0.120 sec. to   12.676 sec.

Spectral model in power-law:
------------------------------------------------------------
Parameters  : value       lower 90%   higher 90%
Photon index: 1.78273     (     )
Norm@50keV  : 0.132077    (     )
------------------------------------------------------------
#Fit statistic : Chi-Squared =         212.75 using 59 PHA bins.
# Reduced chi-squared =         3.7325 for     57 degrees of freedom
# Null hypothesis probability =   8.108927e-20

Photon flux (15-150 keV)    in 12.8 sec: 18.0796 (    ) ph/cm2/s
Energy fluence (15-150 keV)             : 1.55741e-05 ( 0  0 ) ergs/cm2
Cutoff power-law model

Time interval is from   -0.120 sec. to   12.676 sec.
Spectral model in the cutoff power-law:
------------------------------------------------------------
Parameters  : value       lower 90%   higher 90%
Photon index: 1.02618     ( -0.101512   0.0996257 )
Epeak [keV] : 80.3998      ( -2.91784 3.47757 )
Norm@50keV  : 0.266806    ( -0.0229098   0.025457 )
------------------------------------------------------------
#Fit statistic : Chi-Squared =          25.90 using 59 PHA bins.
# Reduced chi-squared =         0.4624 for     56 degrees of freedom
# Null hypothesis probability =   9.998081e-01

Photon flux (15-150 keV)    in 12.8 sec: 16.6573 ( -0.3359  0.3388 ) ph/cm2/s
Energy fluence (15-150 keV)             : 1.51366e-05 ( 0  0 ) ergs/cm2
Band function
Time interval is from   -0.120 sec. to   12.676 sec.

Spectral model in the Band function:
------------------------------------------------------------
Parameters  : value       lower 90%   higher 90%
alpha       : -1.02611   ( -0.0877776   0.0911367 )
beta        : -10.0000    ( 10   20 )
Epeak [keV] : 80.3840      ( -2.49487 3.47559 )
Norm@50keV   : 0.266804    ( -0.0229022   0.0254244 )
------------------------------------------------------------
#Fit statistic : Chi-Squared =          25.90 using 59 PHA bins.
# Reduced chi-squared =         0.4708 for     55 degrees of freedom
# Null hypothesis probability =   9.997129e-01

Photon flux (15-150 keV)    in 12.8 sec: 16.6622 (    ) ph/cm2/s
Energy fluence (15-150 keV)             : 1.51235e-05 ( 0  0 ) ergs/cm2
Single BB
Spectral model blackbody:
------------------------------------------------------------
Parameters  : value    Lower 90%  Upper 90%
kT [keV]    : 17.9207  (  )
R^2/D10^2   : 0.959382  (   )
(R is the radius in km and D10 is the distance to the source in units of 10 kpc)
------------------------------------------------------------
#Fit statistic : Chi-Squared =        1120.96 using 59 PHA bins.
# Reduced chi-squared =        19.6660 for     57 degrees of freedom
# Null hypothesis probability =  2.721712e-197

Energy  Fluence     90% Error
[keV]   [erg/cm2]   [erg/cm2]
15- 25  7.907e-07   2.054e-08
25- 50  3.645e-06   7.232e-08
50-150  8.487e-06   1.274e-07
15-150  1.292e-05   1.594e-07
Thermal bremsstrahlung (OTTB)
Spectral model: thermal bremsstrahlung
------------------------------------------------------------
Parameters  : value         Lower 90%    Upper 90%
kT [keV]    : 140.794       (      )
Norm        : 72.6698       (-1.19157     1.79764)
------------------------------------------------------------
#Fit statistic : Chi-Squared =          45.29 using 59 PHA bins.
# Reduced chi-squared =         0.7946 for     57 degrees of freedom
# Null hypothesis probability =   8.682928e-01

Energy  Fluence     90% Error
[keV]   [erg/cm2]   [erg/cm2]
15- 25  2.378e-06   9.600e-08
25- 50  4.372e-06   1.453e-07
50-150  8.439e-06   1.455e-06
15-150  1.519e-05   1.530e-06
Double BB

Spectral model: bbodyrad<1> + bbodyrad<2>
------------------------------------------------------------
Parameters  : value         Lower 90%    Upper 90%
kT1 [keV]   : 8.29927        (-0.428746      0.444243)
R1^2/D10^2  : 9.59243        (-1.54774      1.93951)
kT2 [keV]   : 25.4559        (-0.924232      1.05355)
R2^2/D10^2  : 0.195228    (-0.0316388   0.0343804)
------------------------------------------------------------
#Fit statistic : Chi-Squared =          37.68 using 59 PHA bins.
# Reduced chi-squared =         0.6850 for     55 degrees of freedom
# Null hypothesis probability =   9.641431e-01

Energy  Fluence     90% Error
[keV]   [erg/cm2]   [erg/cm2]
15- 25  1.848e-06   9.280e-08
25- 50  4.520e-06   9.792e-08
50-150  8.508e-06   1.536e-07
15-150  1.488e-05   2.752e-07
Peak spectrum fit
Power-law model
Time interval is from    0.544 sec. to    1.544 sec.

Spectral model in power-law:
------------------------------------------------------------
Parameters  : value       lower 90%   higher 90%
Photon index: 1.39984     (     )
Norm@50keV  : 0.360102    (     )
------------------------------------------------------------
#Fit statistic : Chi-Squared =         165.62 using 59 PHA bins.
# Reduced chi-squared =         2.9057 for     57 degrees of freedom
# Null hypothesis probability =   1.569646e-12

Photon flux (15-150 keV)    in 1 sec: 43.8522 (    ) ph/cm2/s
Energy fluence (15-150 keV)             : 3.47966e-06 ( 0  0 ) ergs/cm2
Cutoff power-law model

Time interval is from    0.544 sec. to    1.544 sec.
Spectral model in the cutoff power-law:
------------------------------------------------------------
Parameters  : value       lower 90%   higher 90%
Photon index: 0.602717     ( -0.127885   0.124693 )
Epeak [keV] : 106.319      ( -6.78649 8.83627 )
Norm@50keV  : 0.776242    ( -0.0854008   0.0982066 )
------------------------------------------------------------
#Fit statistic : Chi-Squared =          31.12 using 59 PHA bins.
# Reduced chi-squared =         0.5557 for     56 degrees of freedom
# Null hypothesis probability =   9.971626e-01

Photon flux (15-150 keV)    in 1 sec: 41.6313 ( -0.8337  0.8377 ) ph/cm2/s
Energy fluence (15-150 keV)             : 3.40623e-06 ( 0  0 ) ergs/cm2
Band function

Time interval is from    0.544 sec. to    1.544 sec.

Spectral model in the Band function:
------------------------------------------------------------
Parameters  : value       lower 90%   higher 90%
alpha       : -0.602653   ( -0.127045   0.110767 )
beta        : -10.0000    ( 10   20 )
Epeak [keV] : 106.300      ( -4.04881 8.82372 )
Norm@50keV   : 0.776279    ( -0.0853282   0.0982424 )
------------------------------------------------------------
#Fit statistic : Chi-Squared =          31.12 using 59 PHA bins.
# Reduced chi-squared =         0.5658 for     55 degrees of freedom
# Null hypothesis probability =   9.961099e-01

Photon flux (15-150 keV)    in 1 sec: 41.7249 (    ) ph/cm2/s
Energy fluence (15-150 keV)             : 3.40446e-06 ( 0  0 ) ergs/cm2
Single BB
Spectral model blackbody:
------------------------------------------------------------
Parameters  : value    Lower 90%  Upper 90%
kT [keV]    : 19.4420  (  )
R^2/D10^2   : 2.13203  (   )
(R is the radius in km and D10 is the distance to the source in units of 10 kpc)
------------------------------------------------------------
#Fit statistic : Chi-Squared =         516.01 using 59 PHA bins.
# Reduced chi-squared =         9.0527 for     57 degrees of freedom
# Null hypothesis probability =   3.633976e-75

Energy  Fluence     90% Error
[keV]   [erg/cm2]   [erg/cm2]
15- 25  1.571e-07   4.650e-09
25- 50  7.676e-07   1.800e-08
50-150  2.142e-06   4.800e-08
15-150  3.066e-06   5.250e-08
Thermal bremsstrahlung (OTTB)
Spectral model: thermal bremsstrahlung
------------------------------------------------------------
Parameters  : value         Lower 90%    Upper 90%
kT [keV]    : 199.363       (      )
Norm        : 187.890       (     )
------------------------------------------------------------
#Fit statistic : Chi-Squared =         240.78 using 59 PHA bins.
# Reduced chi-squared =         4.2243 for     57 degrees of freedom
# Null hypothesis probability =   1.922018e-24

Energy  Fluence     90% Error
[keV]   [erg/cm2]   [erg/cm2]
15- 25  4.679e-07   8.500e-09
25- 50  9.000e-07   1.640e-08
50-150  1.974e-06   3.500e-08
15-150  3.342e-06   6.650e-08
Double BB

Spectral model: bbodyrad<1> + bbodyrad<2>
------------------------------------------------------------
Parameters  : value         Lower 90%    Upper 90%
kT1 [keV]   : 8.58539        (-0.683004      0.737679)
R1^2/D10^2  : 17.0785        (-3.68396      5.05612)
kT2 [keV]   : 27.2675        (-1.36039      1.65644)
R2^2/D10^2  : 0.527680    (-0.111133   0.120596)
------------------------------------------------------------
#Fit statistic : Chi-Squared =          30.05 using 59 PHA bins.
# Reduced chi-squared =         0.5464 for     55 degrees of freedom
# Null hypothesis probability =   9.975529e-01

Energy  Fluence     90% Error
[keV]   [erg/cm2]   [erg/cm2]
15- 25  3.037e-07   1.855e-08
25- 50  8.550e-07   2.815e-08
50-150  2.238e-06   7.150e-08
15-150  3.396e-06   1.010e-07
Pre-slew spectrum (Pre-slew PHA with pre-slew DRM)
Power-law model

Spectral model in power-law:
------------------------------------------------------------
Parameters  : value       lower 90%   higher 90%
Photon index: 1.75633     (     )
Norm@50keV  : 0.173686    (     )
------------------------------------------------------------
#Fit statistic : Chi-Squared =         260.08 using 59 PHA bins.
# Reduced chi-squared =         4.5629 for     57 degrees of freedom
# Null hypothesis probability =   1.010295e-27

Photon flux (15-150 keV)    in 9.365 sec: 23.5405 (    ) ph/cm2/s
Energy fluence (15-150 keV)             : 1.50036e-05 ( 0  0 ) ergs/cm2
Cutoff power-law model
Spectral model in the cutoff power-law:
------------------------------------------------------------
Parameters  : value       lower 90%   higher 90%
Photon index: 0.915518     ( -0.100752   0.0989032 )
Epeak [keV] : 80.9948      ( -2.65932 3.10558 )
Norm@50keV  : 0.378683    ( -0.0321434   0.0356627 )
------------------------------------------------------------
#Fit statistic : Chi-Squared =          22.66 using 59 PHA bins.
# Reduced chi-squared =         0.4047 for     56 degrees of freedom
# Null hypothesis probability =   9.999789e-01

Photon flux (15-150 keV)    in 9.365 sec: 21.5937 ( -0.424  0.4275 ) ph/cm2/s
Energy fluence (15-150 keV)             : 1.46031e-05 ( 0  0 ) ergs/cm2
Band function

Spectral model in the Band function:
------------------------------------------------------------
Parameters  : value       lower 90%   higher 90%
alpha       : -0.915433   ( -0.0829291   0.100006 )
beta        : -10.0000    ( 10   5.32907e-14 )
Epeak [keV] : 80.9784      ( -2.25347 3.10455 )
Norm@50keV   : 0.378694    ( -0.0321378   0.0356166 )
------------------------------------------------------------
#Fit statistic : Chi-Squared =          22.66 using 59 PHA bins.
# Reduced chi-squared =         0.4121 for     55 degrees of freedom
# Null hypothesis probability =   9.999663e-01

Photon flux (15-150 keV)    in 9.365 sec: 21.6095 (    ) ph/cm2/s
Energy fluence (15-150 keV)             : 1.46038e-05 ( 0  0 ) ergs/cm2
S(25-50 keV) vs. S(50-100 keV) plot

S(25-50 keV)  = 4.36e-06
S(50-100 keV) = 5.06e-06
T90 vs. Hardness ratio plot

T90                                   = 8.83599999547005 sec.
Hardness ratio (energy fluence ratio) = 1.16055
Color vs. Color plot
Count Ratio  (25-50 keV) / (15-25 keV) = 1.43961
Count Ratio (50-100 keV) / (15-25 keV) = 0.980878
Mask shadow pattern
IMX = 4.617440444879775E-01, IMY = -1.595507843272130E-01
TIME vs. PHA plot around the trigger time
Blue+Cyan dotted lines: Time interval of the scaled map
From 0.000000 to 0.064000
TIME vs. DetID plot around the trigger time
Blue+Cyan dotted lines: Time interval of the scaled map
From 0.000000 to 0.064000
100 us light curve (15-350 keV)
Blue+Cyan dotted lines: Time interval of the scaled map
From 0.000000 to 0.064000
Spacecraft aspect plot
Bright source in the pre-burst/pre-slew/post-slew images
Pre-burst image of 15-350 keV band
Time interval of the image:
-136.355410 -0.120000

# RAcent  DECcent POSerr Theta    Phi  PeakCts   SNR AngSep     Name
#  [deg]    [deg]    ['] [deg]  [deg]                   [']
254.5945  35.3952    4.2   4.3   40.2   0.3087   2.7    7.4	Her X-1
288.7862  10.9243    2.5  43.7   28.4   1.2702   4.6    1.5	GRS 1915+105
299.5991  35.1987    0.5  39.0  -11.1   3.6847  23.8    0.5	Cyg X-1
308.1208  40.9801    3.8  43.6  -22.5   0.6055   3.1    1.7	Cyg X-3
326.0431  38.3955   70.9  57.4  -25.8  -0.1325  -0.2    7.5	Cyg X-2
274.7161  10.6811    2.6  35.0   45.5   0.9351   4.4 ------	UNKNOWN
238.2998  16.3173    2.0  24.4  119.5   0.8285   5.7 ------	UNKNOWN
302.7493  52.6102    2.6  38.4  -39.4   0.7630   4.5 ------	UNKNOWN
293.6158  61.3627    2.5  35.1  -55.3   0.8804   4.6 ------	UNKNOWN
177.3724  56.3464    2.5  50.1 -133.7   2.7702   4.6 ------	UNKNOWN
Pre-slew background subtracted image of 15-350 keV band
Time interval of the image:
-0.120000 9.244600

# RAcent  DECcent POSerr Theta    Phi  PeakCts   SNR AngSep     Name
#  [deg]    [deg]    ['] [deg]  [deg]                   [']
254.4333  35.4077    6.5   4.2   41.3   0.3069   1.7    4.1	Her X-1
288.7453  10.9751    8.9  43.6   28.4  -0.5472  -1.3    3.6	GRS 1915+105
299.7135  35.2747   12.8  39.0  -11.3   0.2108   0.9    7.5	Cyg X-1
308.0299  40.9430   26.9  43.6  -22.4  -0.1328  -0.4    3.7	Cyg X-3
326.1961  38.4433    4.5  57.5  -25.9   2.9603   2.6    7.4	Cyg X-2
274.2058   8.2890    2.4  36.8   48.5   1.5927   4.7 ------	UNKNOWN
260.2902  11.8518    2.3  27.8   69.2   1.2390   4.9 ------	UNKNOWN
278.1381  26.3393    0.1  26.0   19.1  25.2746 142.2 ------	UNKNOWN
314.9451  34.3311    2.3  51.0  -16.6   2.1117   5.0 ------	UNKNOWN
173.8636  46.0278    3.8  55.2 -145.4   3.8977   3.0 ------	UNKNOWN
279.2378  77.4252    3.1  41.0  -80.8   2.8729   3.7 ------	UNKNOWN
264.6866  78.6385    3.8  40.8  -85.8   2.4914   3.1 ------	UNKNOWN
Post-slew image of 15-350 keV band
Time interval of the image:
63.644600 302.966800

# RAcent  DECcent POSerr Theta    Phi  PeakCts   SNR AngSep     Name
#  [deg]    [deg]    ['] [deg]  [deg]                   [']
254.5164  35.4749    5.8  22.2  170.0   0.3325   2.0    8.5	Her X-1
268.1628  -1.4877    0.0  29.4   70.5   0.2810   1.1   12.5	SW J1753.5-0127
273.9890 -14.1650    3.7  40.7   56.1  -1.6015  -3.1    7.8	GX 17+2
288.8195  10.8686    2.2  18.4   14.7   0.8120   5.2    4.8	GRS 1915+105
299.5872  35.1987    0.3  20.4  -71.2   6.9792  37.3    0.2	Cyg X-1
308.0546  40.9633    1.5  28.7  -78.5   1.8790   7.8    2.6	Cyg X-3
326.1379  38.4411    4.8  41.8  -69.3   1.5982   2.4    7.3	Cyg X-2
315.4304  23.8280    3.7  33.7  -44.2   0.6634   3.1 ------	UNKNOWN
223.1184  69.1613    3.1  53.3 -151.4   2.1932   3.8 ------	UNKNOWN
Plot creation:
Sun May 31 16:45:46 EDT 2015