Estimated redshift from machine learning (Ukwatta et al. 2016) - may take a few minute to calcaulte
Image
Pre-slew 15.0-350.0 keV image (Event data)

#   RAcent    DECcent   POSerr    Theta     Phi              Peak Cts       SNR   Name
  297.4666   -24.9869   0.0133    19.4217    62.0239         2.0617706     14.536 TRIG_01344586

Foreground time interval of the image:
-24.172  33.389 (delta_t =  57.561 [sec])
Background time interval of the image:
-78.611 -24.172 (delta_t =  54.439 [sec])
Lightcurves
Notes:
- 1) The mask-weighted light curves are using the flight position.
- 2) Multiple plots of different time binning/intervals are shown to cover all scenarios of short/long GRBs, rate/image triggers, and real/false positives.
- 3) For all the mask-weighted lightcurves, the y-axis units are counts/sec/det where a det is 0.4 x 0.4 = 0.16 sq cm.
- 4) The verticle lines correspond to following: green dotted lines are T50 interval, black dotted lines are T90 interval, blue solid line(s) is a spacecraft slew start time, and orange solid line(s) is a spacecraft slew end time.
- 5) Time of each bin is in the middle of the bin.
1 s binning
From T0-310 s to T0+310 s

From T100_start - 20 s to T100_end + 30 s

Full time interval

64 ms binning
Full time interval

From T100_start to T100_end

From T0-5 sec to T0+5 sec

16 ms binning
From T100_start-5 s to T100_start+5 s

Blue+Cyan dotted lines: Time interval of the scaled map
From 0.000000 to 2.048000
8 ms binning
From T100_start-3 s to T100_start+3 s

Blue+Cyan dotted lines: Time interval of the scaled map
From 0.000000 to 2.048000
2 ms binning
From T100_start-1 s to T100_start+1 s

Blue+Cyan dotted lines: Time interval of the scaled map
From 0.000000 to 2.048000
SN=5 or 10 sec. binning (whichever binning is satisfied first)

SN=5 or 10 sec. binning (T < 200 sec)

Quad-rate summed light curves (from T0-300s to T0+1000s)

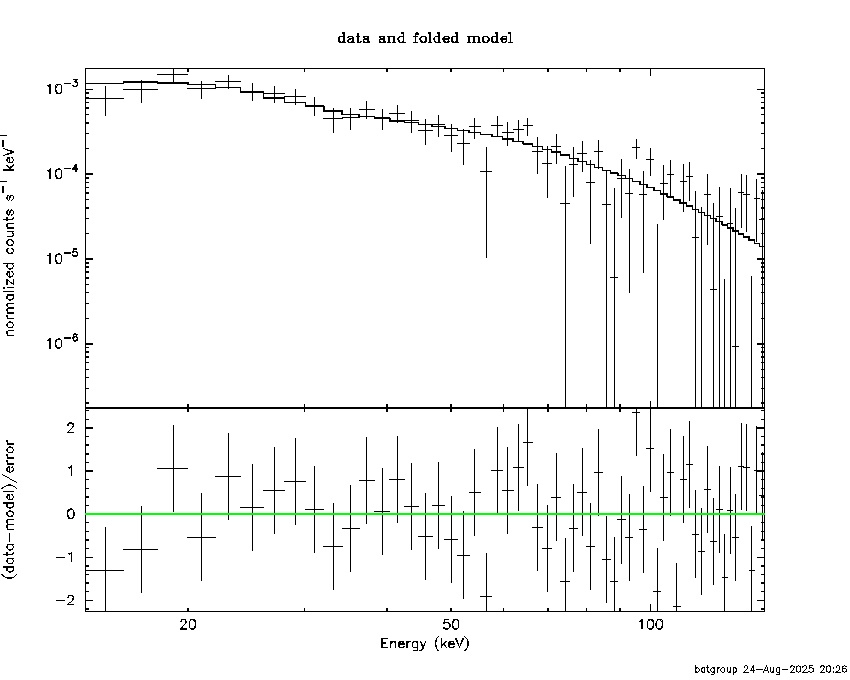
Spectral Evolution

Spectra
Notes:
- 1) The fitting includes the systematic errors.
- 2) When the burst includes telescope slew time periods, the fitting uses an average response file made from multiple 5-s response files through out the slew time plus single time preiod for the non-slew times, and weighted by the total counts in the corresponding time period using addrmf. An average response file is needed becuase a spectral fit using the pre-slew DRM will introduce some errors in both a spectral shape and a normalization if the PHA file contains a lot of the slew/post-slew time interval.
- 3) For fits to more complicated models (e.g. a power-law over a cutoff power-law), the BAT team has decided to require a chi-square improvement of more than 6 for each extra dof.
Time averaged spectrum fit using the average DRM
Power-law model

Time interval is from  -24.172 sec. to  184.636 sec.

Spectral model in power-law:
------------------------------------------------------------
Parameters  : value       lower 90%   higher 90%
Photon index: 1.78335     ( -0.158479   0.162449 )
Norm@50keV  : 9.23561E-04    ( -9.25906e-05   9.12356e-05 )
------------------------------------------------------------
#Fit statistic  : Chi-Squared                   48.77     using 59 bins.
 Reduced chi-squared = 0.855614
# Null hypothesis probability of 7.73e-01 with 57 degrees of freedom

Photon flux (15-150 keV)    in 208.8 sec: 0.126459 ( -0.011197  0.011205 ) ph/cm2/s
Energy fluence (15-150 keV)             : 1.77673e-06 ( -1.81138e-07  1.83927e-07 ) ergs/cm2
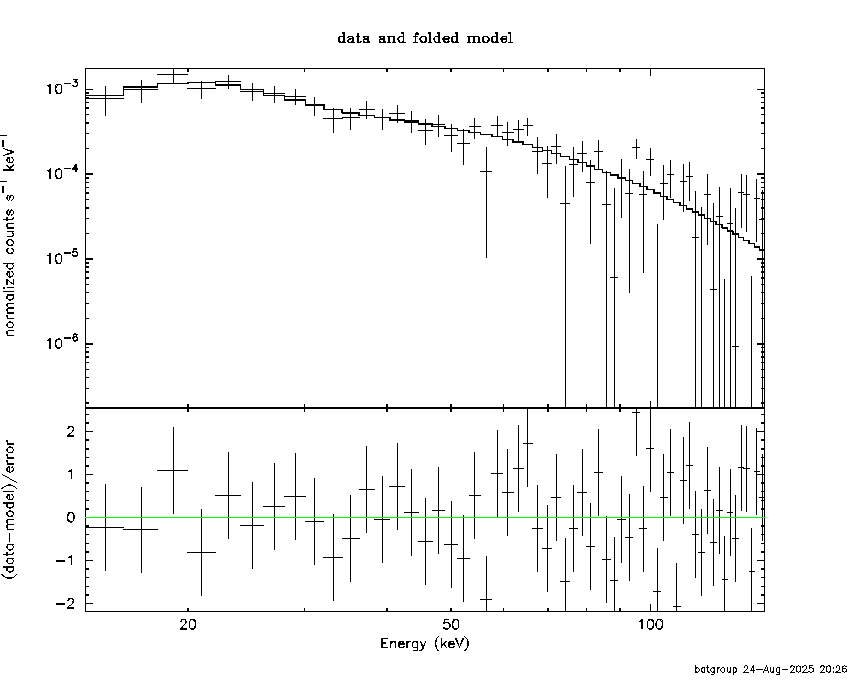
Cutoff power-law model

Time interval is from  -24.172 sec. to  184.636 sec.
Spectral model in the cutoff power-law:
------------------------------------------------------------
Parameters  : value       lower 90%   higher 90%
Photon index: 1.41655     ( -0.711859   0.322225 )
Epeak [keV] : 70.3298      ( -18.9999 -70.3299 )
Norm@50keV  : 1.47695E-03    ( -0.000635024   0.00215994 )
------------------------------------------------------------
#Fit statistic  : Chi-Squared                   47.76     using 59 bins.
 Reduced chi-squared = 0.852857
# Null hypothesis probability of 7.75e-01 with 56 degrees of freedom

Photon flux (15-150 keV)    in 208.8 sec: 0.124436 ( -0.011724  0.011698 ) ph/cm2/s
Energy fluence (15-150 keV)             : 1.7086e-06 ( -2.11155e-07  2.15026e-07 ) ergs/cm2
Band function

Time interval is from  -24.172 sec. to  184.636 sec.


Spectral model in the Band function:
------------------------------------------------------------
Parameters  : value       lower 90%   higher 90%
alpha       :    (     )
beta        :     (     )
Epeak [keV] :       (   )
Norm@50keV   :     (     )
------------------------------------------------------------

Photon flux (15-150 keV)    in  sec:  (    ) ph/cm2/s
Energy fluence (15-150 keV)             : 0 ( 0  0 ) ergs/cm2
Single BB

Spectral model blackbody:
------------------------------------------------------------
Parameters  : value    Lower 90%  Upper 90%
kT [keV]    : 11.3994  (-1.22404  1.40397)
R^2/D10^2   : 3.62345E-02  (-0.0127487   0.0192863)
(R is the radius in km and D10 is the distance to the source in units of 10 kpc)
------------------------------------------------------------
#Fit statistic  : Chi-Squared                   75.71     using 59 bins.
 Reduced chi-squared =
# Null hypothesis probability of 4.93e-02 with 57 degrees of freedom

Energy  Fluence     90% Error
[keV]   [erg/cm2]   [erg/cm2]
15- 25  2.067e-07   3.183e-08
25- 50  6.114e-07   7.047e-08
50-150  4.609e-07   9.751e-08
15-150  1.279e-06   1.475e-07
Thermal bremsstrahlung (OTTB)

Spectral model: thermal bremsstrahlung
------------------------------------------------------------
Parameters  : value         Lower 90%    Upper 90%
kT [keV]    : 99.9992       (-27.7768      54.2515)
Norm        : 0.558309       (-0.0678286     0.0775007)
------------------------------------------------------------
#Fit statistic  : Chi-Squared                   47.82     using 59 bins.
 Reduced chi-squared =
# Null hypothesis probability of 8.02e-01 with 57 degrees of freedom

Energy  Fluence     90% Error
[keV]   [erg/cm2]   [erg/cm2]
15- 25  3.047e-07   4.134e-08
25- 50  5.269e-07   5.126e-08
50-150  8.538e-07   3.393e-07
15-150  1.685e-06   3.639e-07
Double BB

Spectral model: bbodyrad<1> + bbodyrad<2>
------------------------------------------------------------
Parameters  : value         Lower 90%    Upper 90%
kT1 [keV]   : 6.44145        (-1.6703      1.847)
R1^2/D10^2  : 0.208096        (-0.11639      0.28645)
kT2 [keV]   : 22.5630        (-6.00694      14.9087)
R2^2/D10^2  : 2.10049E-03    (-0.00173659   0.00508323)
------------------------------------------------------------
#Fit statistic  : Chi-Squared                   47.65     using 59 bins.
 Reduced chi-squared =
# Null hypothesis probability of 7.49e-01 with 55 degrees of freedom

Energy  Fluence     90% Error
[keV]   [erg/cm2]   [erg/cm2]
15- 25  3.043e-07   1.072e-07
25- 50  5.246e-07   1.742e-07
50-150  8.708e-07   4.583e-07
15-150  1.700e-06   7.001e-07
Peak spectrum fit
Power-law model

Time interval is from    4.240 sec. to    5.240 sec.

Spectral model in power-law:
------------------------------------------------------------
Parameters  : value       lower 90%   higher 90%
Photon index: 1.32665     ( -0.301982   0.297518 )
Norm@50keV  : 9.58158E-03    ( -0.00154686   0.0015452 )
------------------------------------------------------------
#Fit statistic  : Chi-Squared                   36.87     using 59 bins.
 Reduced chi-squared = 0.646842
# Null hypothesis probability of 9.82e-01 with 57 degrees of freedom

Photon flux (15-150 keV)    in 1 sec: 1.14892 ( -0.192202  0.19277 ) ph/cm2/s
Energy fluence (15-150 keV)             : 9.40936e-08 ( -1.68166e-08  1.69823e-08 ) ergs/cm2
Cutoff power-law model

Time interval is from    4.240 sec. to    5.240 sec.
Spectral model in the cutoff power-law:
------------------------------------------------------------
Parameters  : value       lower 90%   higher 90%
Photon index: 1.33166     ( -0.311964   0.291683 )
Epeak [keV] : 9999.20      ( -9999.36 -9999.36 )
Norm@50keV  : 9.58518E-03    ( -0.00155042   0.0120792 )
------------------------------------------------------------
#Fit statistic  : Chi-Squared                   36.88     using 59 bins.
 Reduced chi-squared = 0.658571
# Null hypothesis probability of 9.77e-01 with 56 degrees of freedom

Photon flux (15-150 keV)    in 1 sec: 1.15759 ( -0.24067  0.22401 ) ph/cm2/s
Energy fluence (15-150 keV)             : 9.46303e-08 ( -2.05641e-08  1.05005e-08 ) ergs/cm2
Band function

Time interval is from    4.240 sec. to    5.240 sec.


Spectral model in the Band function:
------------------------------------------------------------
Parameters  : value       lower 90%   higher 90%
alpha       :    (     )
beta        :     (     )
Epeak [keV] :       (   )
Norm@50keV   :     (     )
------------------------------------------------------------

Photon flux (15-150 keV)    in  sec:  (    ) ph/cm2/s
Energy fluence (15-150 keV)             : 0 ( 0  0 ) ergs/cm2
Single BB

Spectral model blackbody:
------------------------------------------------------------
Parameters  : value    Lower 90%  Upper 90%
kT [keV]    : 16.9230  (-3.80847  5.53872)
R^2/D10^2   : 8.60916E-02  (-0.0523607   0.120444)
(R is the radius in km and D10 is the distance to the source in units of 10 kpc)
------------------------------------------------------------
#Fit statistic  : Chi-Squared                   50.18     using 59 bins.
 Reduced chi-squared =
# Null hypothesis probability of 7.27e-01 with 57 degrees of freedom

Energy  Fluence     90% Error
[keV]   [erg/cm2]   [erg/cm2]
15- 25  5.028e-09   1.819e-09
25- 50  2.216e-08   5.720e-09
50-150  4.525e-08   1.620e-08
15-150  7.245e-08   1.793e-08
Thermal bremsstrahlung (OTTB)

Spectral model: thermal bremsstrahlung
------------------------------------------------------------
Parameters  : value         Lower 90%    Upper 90%
kT [keV]    : 200.000       (-69.018      -200)
Norm        : 4.75882       (-0.775372     0.775372)
------------------------------------------------------------
#Fit statistic  : Chi-Squared                   39.35     using 59 bins.
 Reduced chi-squared =
# Null hypothesis probability of 9.64e-01 with 57 degrees of freedom

Energy  Fluence     90% Error
[keV]   [erg/cm2]   [erg/cm2]
15- 25  1.185e-08   6.750e-09
25- 50  2.280e-08   1.293e-08
50-150  5.000e-08   2.834e-08
15-150  8.464e-08   4.754e-08
Double BB

Spectral model: bbodyrad<1> + bbodyrad<2>
------------------------------------------------------------
Parameters  : value         Lower 90%    Upper 90%
kT1 [keV]   : 9.75673        (-4.488      3.78642)
R1^2/D10^2  : 0.441648        (-0.290134      2.80311)
kT2 [keV]   : 73.8666        (-56.1297      -81.8255)
R2^2/D10^2  : 9.60119E-04    (-0.000522106   0.0176757)
------------------------------------------------------------
#Fit statistic  : Chi-Squared                   37.02     using 59 bins.
 Reduced chi-squared =
# Null hypothesis probability of 9.70e-01 with 55 degrees of freedom

Energy  Fluence     90% Error
[keV]   [erg/cm2]   [erg/cm2]
15- 25  8.902e-09   5.300e-09
25- 50  2.360e-08   1.282e-08
50-150  6.368e-08   3.246e-08
15-150  9.618e-08   4.722e-08
Pre-slew spectrum (Pre-slew PHA with pre-slew DRM)
Power-law model
Spectral model in power-law:
------------------------------------------------------------
Parameters  : value       lower 90%   higher 90%
Photon index: 1.66547     ( -0.143552   0.145354 )
Norm@50keV  : 2.25324E-03    ( -0.000193381   0.000191589 )
------------------------------------------------------------
#Fit statistic  : Chi-Squared                   55.15     using 59 bins.
 Reduced chi-squared =
# Null hypothesis probability of 5.45e-01 with 57 degrees of freedom

Photon flux (15-150 keV)    in 57.56 sec: 0.295722 ( -0.024  0.0240619 ) ph/cm2/s
Energy fluence (15-150 keV)             : 1.20441e-06 ( -1.09232e-07  1.10376e-07 ) ergs/cm2
Cutoff power-law model

Spectral model in the cutoff power-law:
------------------------------------------------------------
Parameters  : value       lower 90%   higher 90%
Photon index: 1.43679     ( -0.598241   0.352643 )
Epeak [keV] : 114.440      ( -53.9957 -114.442 )
Norm@50keV  : 2.98883E-03    ( -0.000905596   0.00317175 )
------------------------------------------------------------
#Fit statistic  : Chi-Squared                   54.63     using 59 bins.
 Reduced chi-squared =
# Null hypothesis probability of 5.27e-01 with 56 degrees of freedom

Photon flux (15-150 keV)    in 57.56 sec: 0.292557 ( -0.025125  0.025086 ) ph/cm2/s
Energy fluence (15-150 keV)             : 1.17786e-06 ( -1.26361e-07  1.26125e-07 ) ergs/cm2
Band function
Spectral model in the Band function:
------------------------------------------------------------
Parameters  : value       lower 90%   higher 90%
alpha       :    (     )
beta        :     (     )
Epeak [keV] :       (   )
Norm@50keV   :     (     )
------------------------------------------------------------

Photon flux (15-150 keV)    in  sec:  (    ) ph/cm2/s
Energy fluence (15-150 keV)             : 0 ( 0  0 ) ergs/cm2
S(25-50 keV) vs. S(50-100 keV) plot

S(25-50 keV)  = 4.97e-07
S(50-100 keV) = 5.78e-07
T90 vs. Hardness ratio plot

T90                                   = 193.751999974251 sec.
Hardness ratio (energy fluence ratio) = 1.16298
Color vs. Color plot

Count Ratio  (25-50 keV) / (15-25 keV) = 1.07314
Count Ratio (50-100 keV) / (15-25 keV) = 0.689292
Mask shadow pattern

IMX = 1.653968193818678E-01, IMY = -3.113796750259140E-01
TIME vs. PHA plot around the trigger time
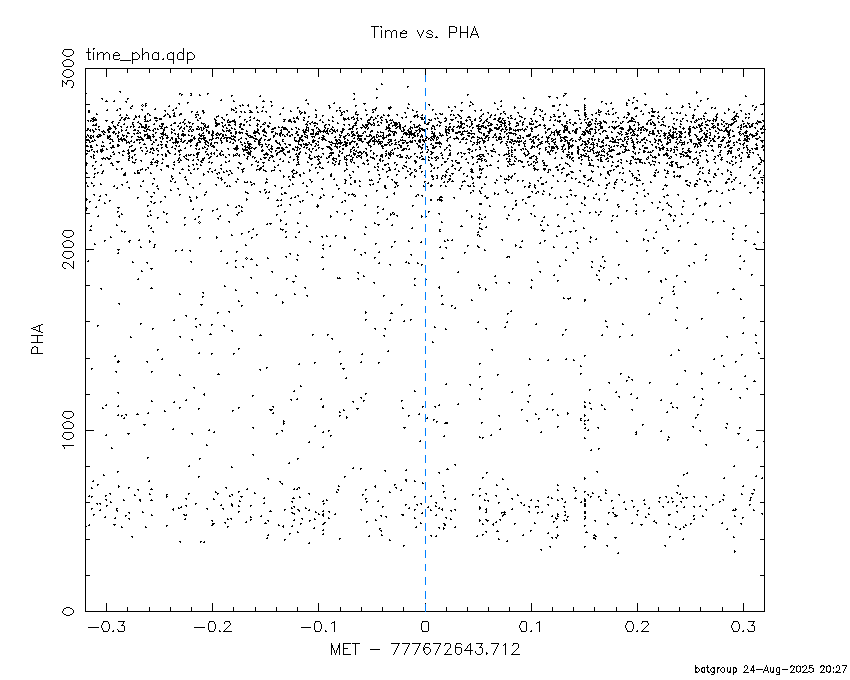
Blue+Cyan dotted lines: Time interval of the scaled map
From 0.000000 to 2.048000
TIME vs. DetID plot around the trigger time

Blue+Cyan dotted lines: Time interval of the scaled map
From 0.000000 to 2.048000
100 us light curve (15-350 keV)

Blue+Cyan dotted lines: Time interval of the scaled map
From 0.000000 to 2.048000
Spacecraft aspect plot

Bright source in the pre-burst/pre-slew/post-slew images
Pre-burst image of 15-350 keV band
Time interval of the image:
-78.611400 -24.172000

# RAcent  DECcent POSerr Theta    Phi  PeakCts   SNR AngSep     Name
#  [deg]    [deg]    ['] [deg]  [deg]                   [']
244.9886 -15.6698    1.4  47.0  -27.3   2.2248   8.6    1.9	Sco X-1
255.9867 -37.8442   26.8  26.1  -48.6   0.0577   0.4    0.0	4U 1700-377
256.4360 -36.4235  200.6  26.4  -45.3   0.0078   0.1    0.0	GX 349+2
262.9273 -24.6169    6.9  28.9  -17.5  -0.2258  -1.7    8.9	GX 1+4
264.6032 -44.5704  202.4  18.1  -61.7  -0.0072  -0.1    9.4	4U 1735-44
268.3687  -1.2827   74.8  46.3   10.4   0.0341   0.2   10.2	SW J1753.5-0127
270.1974 -25.1763    4.7  24.3   -6.9   0.3170   2.5    7.5	GX 5-1
270.3380 -25.8977    5.2  23.6   -7.7   0.2864   2.2    9.5	GRS 1758-258
273.9526 -14.1856   35.0  32.2   11.0   0.0450   0.3    9.5	GX 17+2
275.9693 -30.5202    5.7  16.9   -4.3   0.2354   2.0    9.5	H1820-303
285.0557 -24.9829    5.3  18.8   27.3   0.2576   2.2    3.9	HT1900.1-2455
263.1183 -33.7209   34.5  22.9  -33.2   0.0385   0.3    9.4	GX 354-0
278.9657 -37.3223    2.2  10.3  -16.6   0.5497   5.1 ------	UNKNOWN
 22.6054 -66.4292    2.6  52.0 -169.6   1.4472   4.4 ------	UNKNOWN
 49.2136 -71.8816    2.3  57.2 -157.9   2.8369   5.0 ------	UNKNOWN
104.3559 -84.5744    2.8  52.0 -139.8   2.2840   4.1 ------	UNKNOWN
Pre-slew background subtracted image of 15-350 keV band
Time interval of the image:
-24.172000 33.388600

# RAcent  DECcent POSerr Theta    Phi  PeakCts   SNR AngSep     Name
#  [deg]    [deg]    ['] [deg]  [deg]                   [']
245.0797 -15.5024    5.1  47.1  -27.0   0.6540   2.3   10.1	Sco X-1
256.1539 -37.8942    9.6  26.0  -48.5  -0.1848  -1.2    8.5	4U 1700-377
256.4961 -36.2548    7.9  26.4  -44.9   0.2267   1.5   10.5	GX 349+2
262.9425 -24.9441    0.0  28.7  -17.9  -0.3056  -2.0   12.5	GX 1+4
264.7614 -44.5692    7.5  18.0  -61.6   0.2247   1.5    7.2	4U 1735-44
268.3751  -1.3817    8.6  46.2   10.4   0.3693   1.3    4.3	SW J1753.5-0127
270.2840 -25.0780  215.1  24.3   -6.6   0.0078   0.1    0.1	GX 5-1
270.3025 -25.7430   17.3  23.8   -7.6   0.0987   0.7    0.0	GRS 1758-258
274.2070 -14.0924    0.0  32.2   11.5  -0.2262  -1.5   12.2	GX 17+2
276.1167 -30.4392    5.3  16.9   -3.8  -0.2650  -2.2   10.8	H1820-303
285.1150 -24.9469   54.6  18.8   27.4  -0.0301  -0.2    4.6	HT1900.1-2455
263.1426 -33.9355    7.8  22.8  -33.7   0.1959   1.5    9.7	GX 354-0
297.4666 -24.9869    0.8  19.4   62.0   2.0619  14.5 ------	UNKNOWN
 52.4931 -72.1457    2.6  57.7 -156.9   2.9596   4.5 ------	UNKNOWN
 39.7873 -86.3030    2.3  48.0 -143.8   1.7178   5.0 ------	UNKNOWN
204.9776 -82.3178    2.2  46.4 -128.5   2.7628   5.1 ------	UNKNOWN
Post-slew image of 15-350 keV band
Time interval of the image:
105.388590 962.340300

# RAcent  DECcent POSerr Theta    Phi  PeakCts   SNR AngSep     Name
#  [deg]    [deg]    ['] [deg]  [deg]                   [']
256.0342 -37.8850   48.2  37.3 -104.4   0.8367   0.2    3.3	4U 1700-377
256.6047 -36.5665    5.1  36.7 -102.3   7.7116   2.3   11.9	GX 349+2
263.1531 -24.8565    6.4  31.1  -81.1   3.6040   1.8   10.3	GX 1+4
264.7740 -44.5792   17.5  32.9 -118.8   1.3376   0.7    7.9	4U 1735-44
268.4139  -1.5844    6.2  36.5  -38.7  -3.4973  -1.9    8.4	SW J1753.5-0127
270.4163 -25.0869    2.9  24.5  -80.0   6.4385   4.1    7.2	GX 5-1
270.3189 -25.6159    8.8  24.6  -81.3   2.3881   1.5    7.7	GRS 1758-258
274.0199 -13.9829    5.6  24.7  -51.9   2.8446   2.1    3.3	GX 17+2
275.8734 -30.4338    4.3  19.9  -94.7   3.5072   2.7    4.8	H1820-303
284.8913 -25.0348   30.9  11.4  -77.0   0.4220   0.4   10.4	HT1900.1-2455
288.7377  10.8502    5.6  36.8    1.6  -3.2378  -2.1    6.7	GRS 1915+105
262.9247 -33.8948   15.9  31.3  -98.7   1.4337   0.7    4.8	GX 354-0
315.1712  15.9591    3.8  44.4   40.7   6.5330   3.0 ------	UNKNOWN
292.1196   5.0223    2.6  30.4    5.4   6.0951   4.4 ------	UNKNOWN
267.8417 -15.9584    2.3  29.2  -61.7   7.9098   5.0 ------	UNKNOWN
Plot creation:
Sun Mar  1 23:29:05 EST 2026