Estimated redshift from machine learning (Ukwatta et al. 2016) - may take a few minute to calcaulte
Image
Pre-slew 15.0-350.0 keV image (Event data)

#   RAcent    DECcent   POSerr    Theta     Phi              Peak Cts       SNR   Name
  128.1635    21.8093   0.0111    13.7224   106.4976         0.7636468     17.363 TRIG_01402466

Foreground time interval of the image:
 -0.036  10.973 (delta_t =  11.009 [sec])
Background time interval of the image:
-108.027  -0.036 (delta_t = 107.991 [sec])
Lightcurves
Notes:
- 1) The mask-weighted light curves are using the flight position.
- 2) Multiple plots of different time binning/intervals are shown to cover all scenarios of short/long GRBs, rate/image triggers, and real/false positives.
- 3) For all the mask-weighted lightcurves, the y-axis units are counts/sec/det where a det is 0.4 x 0.4 = 0.16 sq cm.
- 4) The verticle lines correspond to following: green dotted lines are T50 interval, black dotted lines are T90 interval, blue solid line(s) is a spacecraft slew start time, and orange solid line(s) is a spacecraft slew end time.
- 5) Time of each bin is in the middle of the bin.
1 s binning
From T0-310 s to T0+310 s
From T100_start - 20 s to T100_end + 30 s
Full time interval
64 ms binning
Full time interval

From T100_start to T100_end
From T0-5 sec to T0+5 sec

16 ms binning
From T100_start-5 s to T100_start+5 s

Blue+Cyan dotted lines: Time interval of the scaled map
From 0.000000 to 0.512000
8 ms binning
From T100_start-3 s to T100_start+3 s
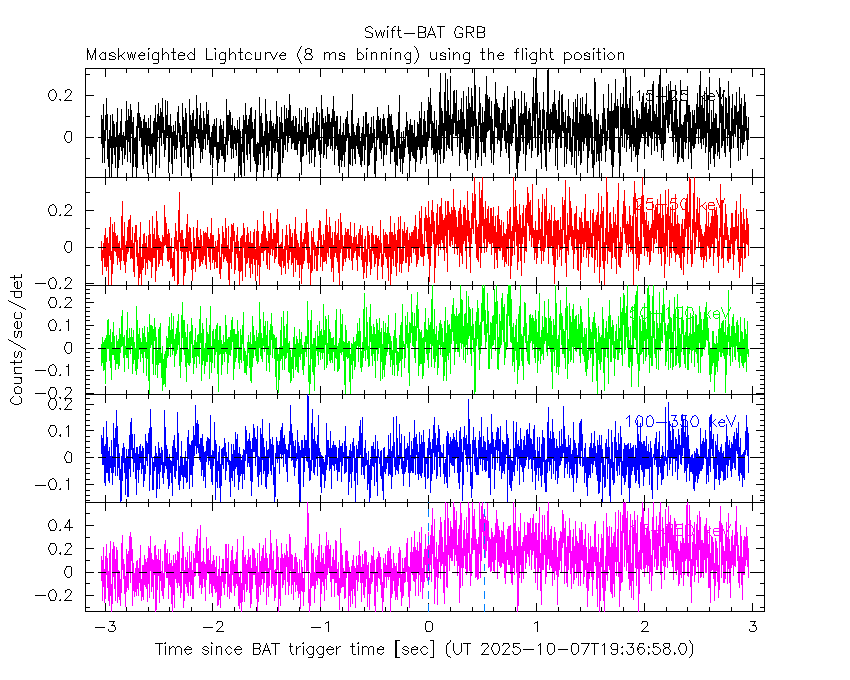
Blue+Cyan dotted lines: Time interval of the scaled map
From 0.000000 to 0.512000
2 ms binning
From T100_start-1 s to T100_start+1 s

Blue+Cyan dotted lines: Time interval of the scaled map
From 0.000000 to 0.512000
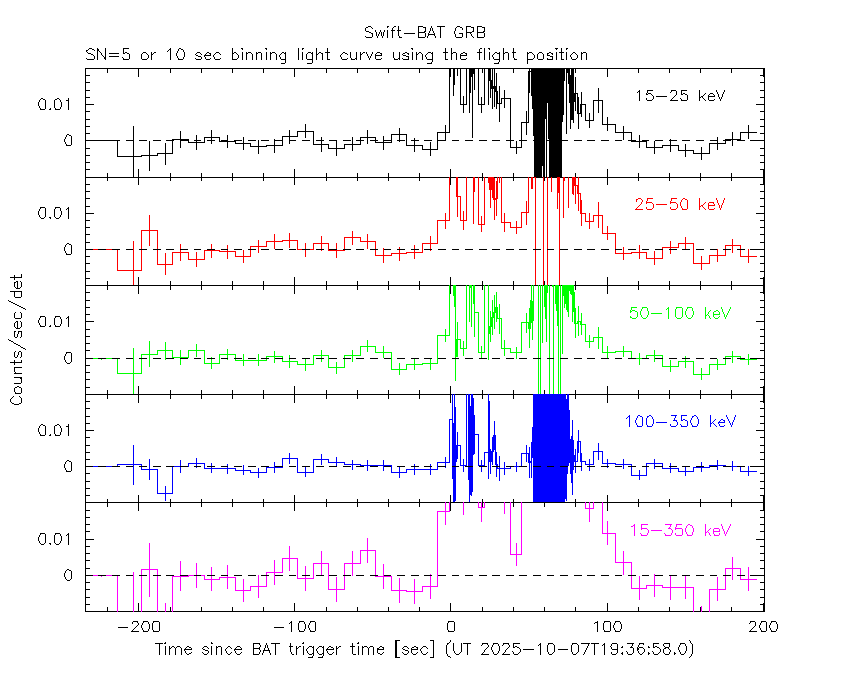
SN=5 or 10 sec. binning (whichever binning is satisfied first)

SN=5 or 10 sec. binning (T < 200 sec)
Quad-rate summed light curves (from T0-300s to T0+1000s)

Spectral Evolution

Spectra
Notes:
- 1) The fitting includes the systematic errors.
- 2) When the burst includes telescope slew time periods, the fitting uses an average response file made from multiple 5-s response files through out the slew time plus single time preiod for the non-slew times, and weighted by the total counts in the corresponding time period using addrmf. An average response file is needed becuase a spectral fit using the pre-slew DRM will introduce some errors in both a spectral shape and a normalization if the PHA file contains a lot of the slew/post-slew time interval.
- 3) For fits to more complicated models (e.g. a power-law over a cutoff power-law), the BAT team has decided to require a chi-square improvement of more than 6 for each extra dof.
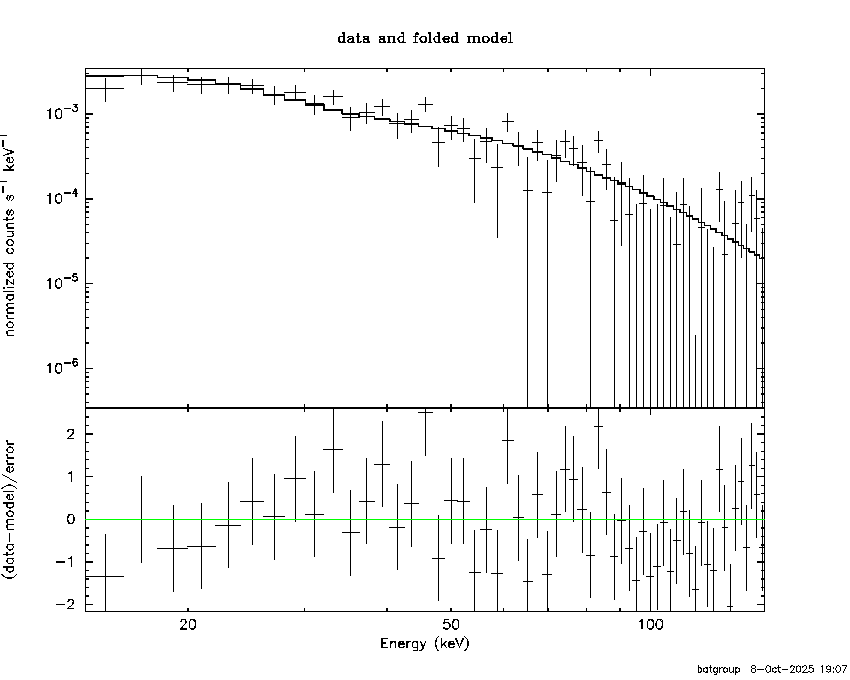
Time averaged spectrum fit using the average DRM
Power-law model

Time interval is from   -0.036 sec. to  103.196 sec.

Spectral model in power-law:
------------------------------------------------------------
Parameters  : value       lower 90%   higher 90%
Photon index: 1.33703     ( -0.0327995   0.032703 )
Norm@50keV  : 1.02003E-02    ( -0.000176437   0.000176157 )
------------------------------------------------------------
#Fit statistic  : Chi-Squared                   44.10     using 59 bins.
 Reduced chi-squared = 0.773684
# Null hypothesis probability of 8.94e-01 with 57 degrees of freedom

Photon flux (15-150 keV)    in 103.2 sec: 1.22563 ( -0.02435  0.02446 ) ph/cm2/s
Energy fluence (15-150 keV)             : 1.03126e-05 ( -1.76325e-07  1.76504e-07 ) ergs/cm2
Cutoff power-law model

Time interval is from   -0.036 sec. to  103.196 sec.
Spectral model in the cutoff power-law:
------------------------------------------------------------
Parameters  : value       lower 90%   higher 90%
Photon index: 1.33300     ( -0.109278   0.054865 )
Epeak [keV] : 9997.75      ( -9997.66 -9997.66 )
Norm@50keV  : 1.02402E-02    ( -0.000174417   0.00152117 )
------------------------------------------------------------
#Fit statistic  : Chi-Squared                   44.07     using 59 bins.
 Reduced chi-squared = 0.786964
# Null hypothesis probability of 8.76e-01 with 56 degrees of freedom

Photon flux (15-150 keV)    in 103.2 sec: 1.22332 ( -0.02624  0.02208 ) ph/cm2/s
Energy fluence (15-150 keV)             : 1.03031e-05 ( -2.17595e-07  2.07021e-07 ) ergs/cm2
Band function

Time interval is from   -0.036 sec. to  103.196 sec.


Spectral model in the Band function:
------------------------------------------------------------
Parameters  : value       lower 90%   higher 90%
alpha       :    (     )
beta        :     (     )
Epeak [keV] :       (   )
Norm@50keV   :     (     )
------------------------------------------------------------

Photon flux (15-150 keV)    in  sec:  (    ) ph/cm2/s
Energy fluence (15-150 keV)             : 0 ( 0  0 ) ergs/cm2
Single BB

Spectral model blackbody:
------------------------------------------------------------
Parameters  : value    Lower 90%  Upper 90%
kT [keV]    : 20.2146  (  )
R^2/D10^2   : 5.01040E-02  (   )
(R is the radius in km and D10 is the distance to the source in units of 10 kpc)
------------------------------------------------------------
#Fit statistic  : Chi-Squared                  770.26     using 59 bins.
 Reduced chi-squared =
# Null hypothesis probability of 1.31e-125 with 57 degrees of freedom

Energy  Fluence     90% Error
[keV]   [erg/cm2]   [erg/cm2]
15- 25  4.056e-07   1.507e-08
25- 50  2.034e-06   5.624e-08
50-150  6.172e-06   1.367e-07
15-150  8.612e-06   1.589e-07
Thermal bremsstrahlung (OTTB)

Spectral model: thermal bremsstrahlung
------------------------------------------------------------
Parameters  : value         Lower 90%    Upper 90%
kT [keV]    : 199.363       (      )
Norm        : 5.26444       (     )
------------------------------------------------------------
#Fit statistic  : Chi-Squared                  237.08     using 59 bins.
 Reduced chi-squared =
# Null hypothesis probability of 8.03e-24 with 57 degrees of freedom

Energy  Fluence     90% Error
[keV]   [erg/cm2]   [erg/cm2]
15- 25  1.353e-06   2.580e-08
25- 50  2.602e-06   5.315e-08
50-150  5.707e-06   1.073e-07
15-150  9.663e-06   1.796e-07
Double BB

Spectral model: bbodyrad<1> + bbodyrad<2>
------------------------------------------------------------
Parameters  : value         Lower 90%    Upper 90%
kT1 [keV]   : 8.39673        (-0.532318      0.558922)
R1^2/D10^2  : 0.622228        (-0.120025      0.156265)
kT2 [keV]   : 34.2104        (-2.21977      2.69306)
R2^2/D10^2  : 7.28570E-03    (-0.00159733   0.00183563)
------------------------------------------------------------
#Fit statistic  : Chi-Squared                   44.81     using 59 bins.
 Reduced chi-squared =
# Null hypothesis probability of 8.35e-01 with 55 degrees of freedom

Energy  Fluence     90% Error
[keV]   [erg/cm2]   [erg/cm2]
15- 25  9.732e-07   6.213e-08
25- 50  2.430e-06   8.669e-08
50-150  6.865e-06   2.492e-07
15-150  1.027e-05   2.843e-07
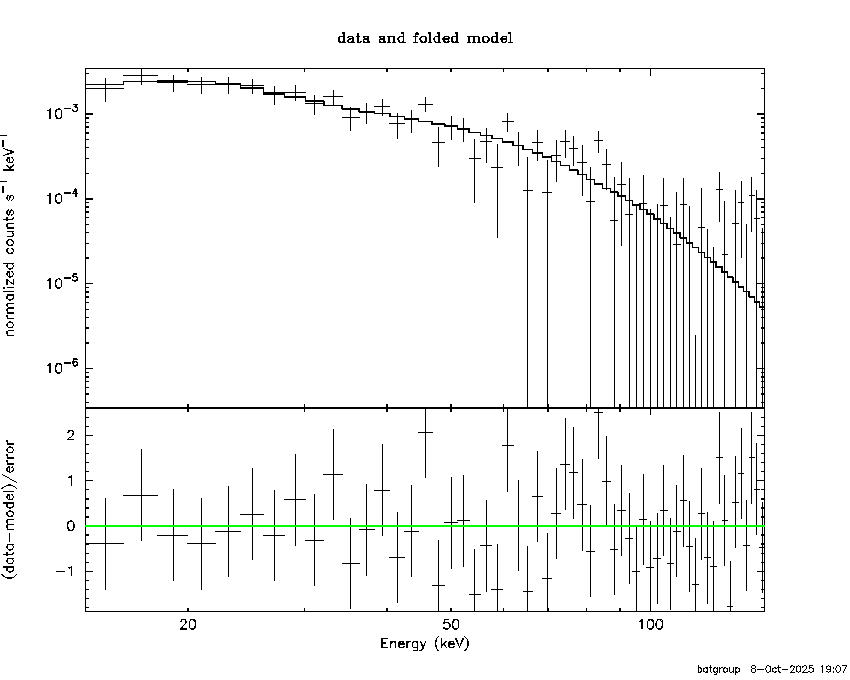
Peak spectrum fit
Power-law model

Time interval is from   56.140 sec. to   57.140 sec.

Spectral model in power-law:
------------------------------------------------------------
Parameters  : value       lower 90%   higher 90%
Photon index: 1.04958     ( -0.0563609   0.0561499 )
Norm@50keV  : 8.13829E-02    ( -0.00257401   0.00257246 )
------------------------------------------------------------
#Fit statistic  : Chi-Squared                   50.71     using 59 bins.
 Reduced chi-squared = 0.889649
# Null hypothesis probability of 7.09e-01 with 57 degrees of freedom

Photon flux (15-150 keV)    in 1 sec: 9.39914 ( -0.30377  0.30396 ) ph/cm2/s
Energy fluence (15-150 keV)             : 8.65167e-07 ( -3.03332e-08  3.03833e-08 ) ergs/cm2
Cutoff power-law model

Time interval is from   56.140 sec. to   57.140 sec.
Spectral model in the cutoff power-law:
------------------------------------------------------------
Parameters  : value       lower 90%   higher 90%
Photon index: 0.834727     ( -0.226907   0.111285 )
Epeak [keV] : 312.886      ( -130.418 8494.76 )
Norm@50keV  : 0.101381    ( -0.0167511   0.0255676 )
------------------------------------------------------------
#Fit statistic  : Chi-Squared                   47.82     using 59 bins.
 Reduced chi-squared = 0.853929
# Null hypothesis probability of 7.73e-01 with 56 degrees of freedom

Photon flux (15-150 keV)    in 1 sec: 9.31018 ( -0.31592  0.31602 ) ph/cm2/s
Energy fluence (15-150 keV)             : 8.56387e-07 ( -3.19262e-08  3.18114e-08 ) ergs/cm2
Band function

Time interval is from   56.140 sec. to   57.140 sec.


Spectral model in the Band function:
------------------------------------------------------------
Parameters  : value       lower 90%   higher 90%
alpha       :    (     )
beta        :     (     )
Epeak [keV] :       (   )
Norm@50keV   :     (     )
------------------------------------------------------------

Photon flux (15-150 keV)    in  sec:  (    ) ph/cm2/s
Energy fluence (15-150 keV)             : 0 ( 0  0 ) ergs/cm2
Single BB

Spectral model blackbody:
------------------------------------------------------------
Parameters  : value    Lower 90%  Upper 90%
kT [keV]    : 21.4910  (  )
R^2/D10^2   : 0.357399  (   )
(R is the radius in km and D10 is the distance to the source in units of 10 kpc)
------------------------------------------------------------
#Fit statistic  : Chi-Squared                  213.14     using 59 bins.
 Reduced chi-squared =
# Null hypothesis probability of 7.01e-20 with 57 degrees of freedom

Energy  Fluence     90% Error
[keV]   [erg/cm2]   [erg/cm2]
15- 25  3.087e-08   2.070e-09
25- 50  1.610e-07   7.050e-09
50-150  5.550e-07   2.945e-08
15-150  7.468e-07   3.070e-08
Thermal bremsstrahlung (OTTB)

Spectral model: thermal bremsstrahlung
------------------------------------------------------------
Parameters  : value         Lower 90%    Upper 90%
kT [keV]    : 199.363       (      )
Norm        : 38.2117       (     )
------------------------------------------------------------
#Fit statistic  : Chi-Squared                  263.06     using 59 bins.
 Reduced chi-squared =
# Null hypothesis probability of 3.11e-28 with 57 degrees of freedom

Energy  Fluence     90% Error
[keV]   [erg/cm2]   [erg/cm2]
15- 25  9.515e-08   3.325e-09
25- 50  1.830e-07   5.850e-09
50-150  4.014e-07   1.360e-08
15-150  6.796e-07   2.320e-08
Double BB

Spectral model: bbodyrad<1> + bbodyrad<2>
------------------------------------------------------------
Parameters  : value         Lower 90%    Upper 90%
kT1 [keV]   : 7.87529        (-1.13183      1.3256)
R1^2/D10^2  : 4.47259        (-1.66563      2.93787)
kT2 [keV]   : 32.7521        (-3.34096      4.82281)
R2^2/D10^2  : 8.24954E-02    (-0.0295082   0.0350788)
------------------------------------------------------------
#Fit statistic  : Chi-Squared                   49.59     using 59 bins.
 Reduced chi-squared =
# Null hypothesis probability of 6.81e-01 with 55 degrees of freedom

Energy  Fluence     90% Error
[keV]   [erg/cm2]   [erg/cm2]
15- 25  6.266e-08   7.670e-09
25- 50  1.680e-07   1.505e-08
50-150  6.300e-07   5.865e-08
15-150  8.607e-07   7.255e-08
Pre-slew spectrum (Pre-slew PHA with pre-slew DRM)
Power-law model
Spectral model in power-law:
------------------------------------------------------------
Parameters  : value       lower 90%   higher 90%
Photon index: 1.91012     ( -0.152414   0.158684 )
Norm@50keV  : 3.65451E-03    ( -0.000387918   0.000382011 )
------------------------------------------------------------
#Fit statistic  : Chi-Squared                   46.13     using 59 bins.
 Reduced chi-squared =
# Null hypothesis probability of 8.48e-01 with 57 degrees of freedom

Photon flux (15-150 keV)    in 11.01 sec: 0.526727 ( -0.0460821  0.0460921 ) ph/cm2/s
Energy fluence (15-150 keV)             : 3.69961e-07 ( -3.8257e-08  3.88311e-08 ) ergs/cm2
Cutoff power-law model
Spectral model in the cutoff power-law:
------------------------------------------------------------
Parameters  : value       lower 90%   higher 90%
Photon index: 0.737037     ( -0.891098   0.736256 )
Epeak [keV] : 44.9065      ( -7.22861 12.5117 )
Norm@50keV  : 1.73182E-02    ( -0.0107026   0.0398382 )
------------------------------------------------------------
#Fit statistic  : Chi-Squared                   38.03     using 59 bins.
 Reduced chi-squared =
# Null hypothesis probability of 9.69e-01 with 56 degrees of freedom

Photon flux (15-150 keV)    in 11.01 sec: 0.506288 ( -0.047431  0.047573 ) ph/cm2/s
Energy fluence (15-150 keV)             : 3.32444e-07 ( -4.05333e-08  4.33761e-08 ) ergs/cm2
Band function

Spectral model in the Band function:
------------------------------------------------------------
Parameters  : value       lower 90%   higher 90%
alpha       :    (     )
beta        :     (     )
Epeak [keV] :       (   )
Norm@50keV   :     (     )
------------------------------------------------------------

Photon flux (15-150 keV)    in  sec:  (    ) ph/cm2/s
Energy fluence (15-150 keV)             : 0 ( 0  0 ) ergs/cm2
S(25-50 keV) vs. S(50-100 keV) plot
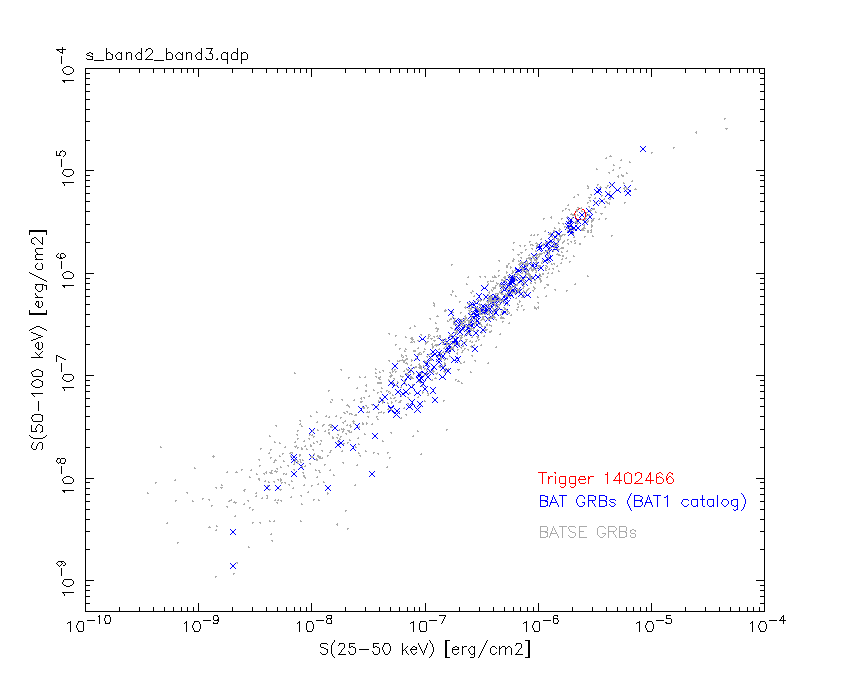
S(25-50 keV)  = 2.34e-06
S(50-100 keV) = 3.72e-06
T90 vs. Hardness ratio plot
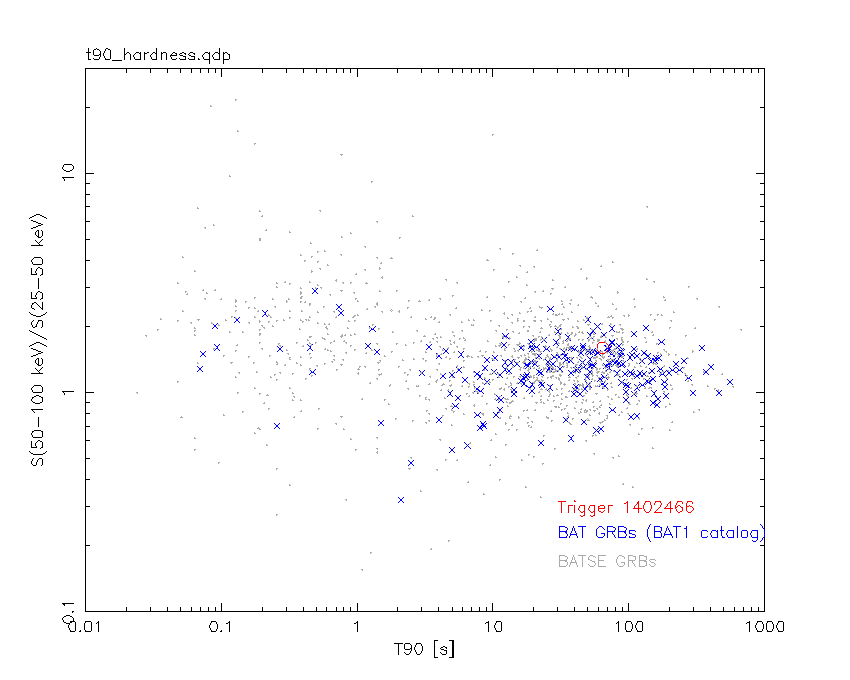
T90                                   = 64.1279999017715 sec.
Hardness ratio (energy fluence ratio) = 1.58974
Color vs. Color plot
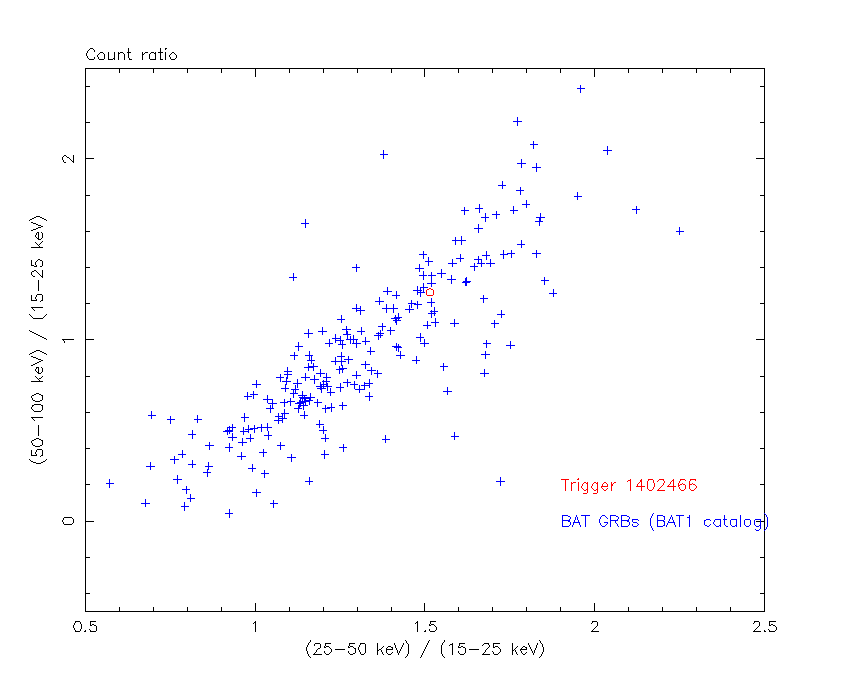
Count Ratio  (25-50 keV) / (15-25 keV) = 1.51044
Count Ratio (50-100 keV) / (15-25 keV) = 1.27358
Mask shadow pattern
IMX = -6.934296015940583E-02, IMY = -2.341345257147898E-01
TIME vs. PHA plot around the trigger time
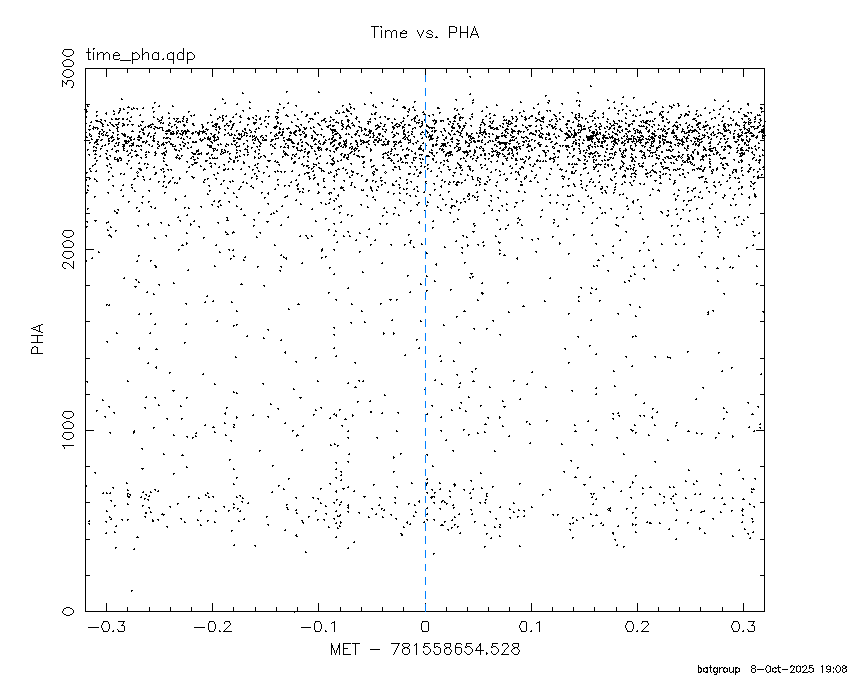
Blue+Cyan dotted lines: Time interval of the scaled map
From 0.000000 to 0.512000
TIME vs. DetID plot around the trigger time
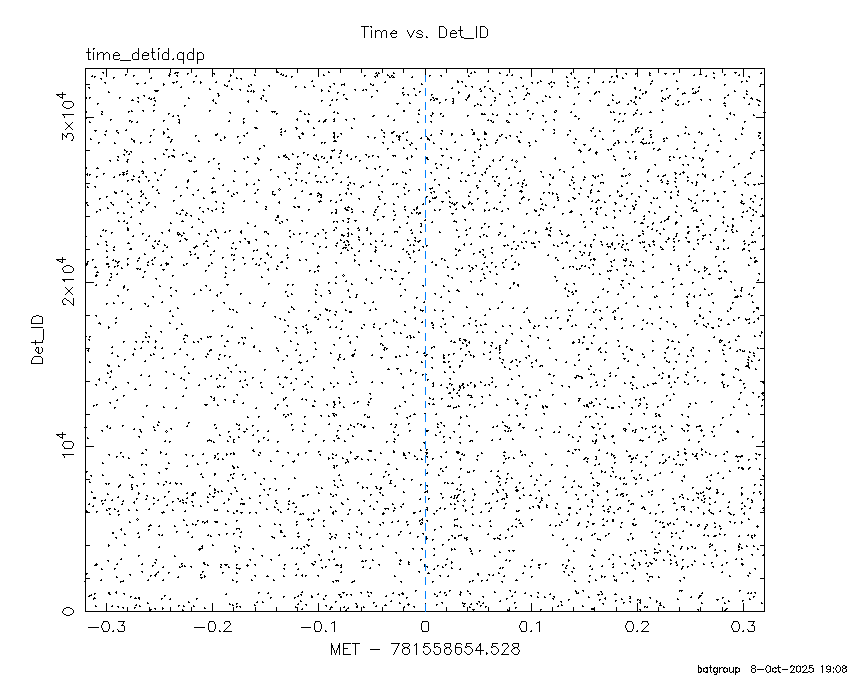
Blue+Cyan dotted lines: Time interval of the scaled map
From 0.000000 to 0.512000
100 us light curve (15-350 keV)

Blue+Cyan dotted lines: Time interval of the scaled map
From 0.000000 to 0.512000
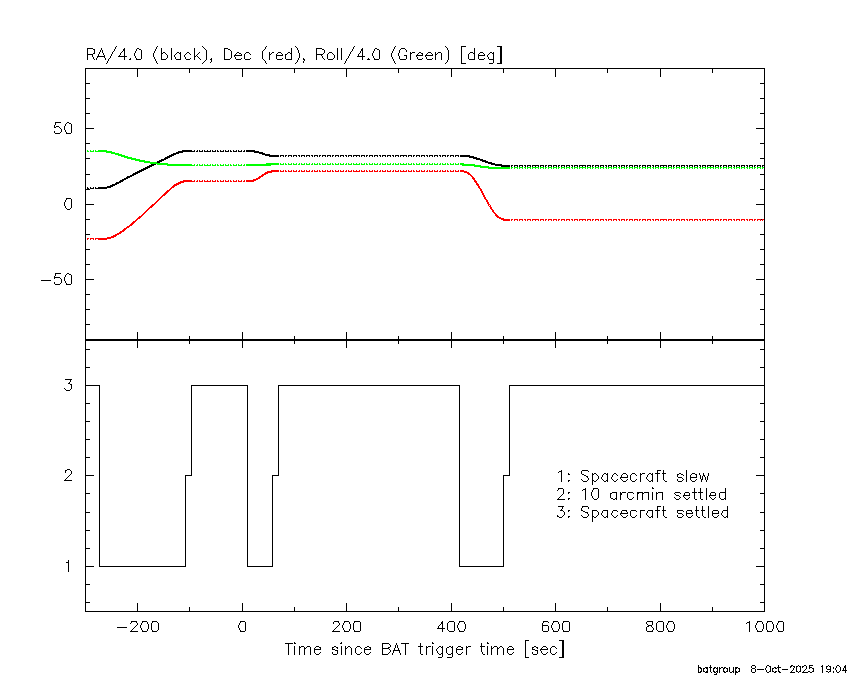
Spacecraft aspect plot
Bright source in the pre-burst/pre-slew/post-slew images
Pre-burst image of 15-350 keV band
Time interval of the image:
-108.027390 -0.036000

# RAcent  DECcent POSerr Theta    Phi  PeakCts   SNR AngSep     Name
#  [deg]    [deg]    ['] [deg]  [deg]                   [']
135.5763 -40.5318    8.1  56.1   -8.8   0.8332   1.4    2.6	Vela X-1
115.3106 -28.7802    2.3  50.6   15.7   2.0000   5.1 ------	UNKNOWN
139.9836 -14.6013    3.5  29.9  -11.9   0.5870   3.3 ------	UNKNOWN
139.9733 -37.6445    3.4  53.0  -12.8   1.3733   3.5 ------	UNKNOWN
197.9402  57.0044    4.1  59.5 -161.7   3.0497   2.8 ------	UNKNOWN
168.6827   1.8503    2.9  30.5  -80.2   0.9026   4.0 ------	UNKNOWN
197.0827  42.5993    2.6  55.0 -145.4   3.7864   4.4 ------	UNKNOWN
Pre-slew background subtracted image of 15-350 keV band
Time interval of the image:
-0.036000 10.972590

# RAcent  DECcent POSerr Theta    Phi  PeakCts   SNR AngSep     Name
#  [deg]    [deg]    ['] [deg]  [deg]                   [']
135.3973 -40.5734    3.4  56.1   -8.6  -0.5240  -3.4    6.1	Vela X-1
125.5509  16.3336    2.2  14.8   82.4   0.2109   5.2 ------	UNKNOWN
128.1635  21.8092    0.7  13.7  106.5   0.7636  17.4 ------	UNKNOWN
Post-slew image of 15-350 keV band
Time interval of the image:
57.572590 302.604000

# RAcent  DECcent POSerr Theta    Phi  PeakCts   SNR AngSep     Name
#  [deg]    [deg]    ['] [deg]  [deg]                   [']
128.1544  21.8201    0.4   0.0   98.8  10.1466  31.7 ------	UNKNOWN
142.7160  23.0354    3.0  13.5 -113.1   1.3333   3.8 ------	UNKNOWN
135.8471 -31.3528    2.8  53.7  -23.3   4.5807   4.1 ------	UNKNOWN
140.6108 -34.4191    2.4  57.5  -27.3   8.9756   4.8 ------	UNKNOWN
Plot creation:
Sun Mar  1 23:19:26 EST 2026