Estimated redshift from machine learning (Ukwatta et al. 2016) - may take a few minute to calcaulte
Image
Pre-slew 15.0-350.0 keV image (Event data)

#   RAcent    DECcent   POSerr    Theta     Phi              Peak Cts       SNR   Name
  274.0822    24.1598   0.0108    10.6931   137.9157         1.6657284     17.905 TRIG_01413695

Foreground time interval of the image:
-28.296  29.757 (delta_t =  58.053 [sec])
Background time interval of the image:
-239.544 -28.296 (delta_t = 211.248 [sec])
Lightcurves
Notes:
- 1) The mask-weighted light curves are using the flight position.
- 2) Multiple plots of different time binning/intervals are shown to cover all scenarios of short/long GRBs, rate/image triggers, and real/false positives.
- 3) For all the mask-weighted lightcurves, the y-axis units are counts/sec/det where a det is 0.4 x 0.4 = 0.16 sq cm.
- 4) The verticle lines correspond to following: green dotted lines are T50 interval, black dotted lines are T90 interval, blue solid line(s) is a spacecraft slew start time, and orange solid line(s) is a spacecraft slew end time.
- 5) Time of each bin is in the middle of the bin.
1 s binning
From T0-310 s to T0+310 s

From T100_start - 20 s to T100_end + 30 s

Full time interval

64 ms binning
Full time interval

From T100_start to T100_end

From T0-5 sec to T0+5 sec

16 ms binning
From T100_start-5 s to T100_start+5 s

Blue+Cyan dotted lines: Time interval of the scaled map
From 0.000000 to 2.048000
8 ms binning
From T100_start-3 s to T100_start+3 s

Blue+Cyan dotted lines: Time interval of the scaled map
From 0.000000 to 2.048000
2 ms binning
From T100_start-1 s to T100_start+1 s

Blue+Cyan dotted lines: Time interval of the scaled map
From 0.000000 to 2.048000
SN=5 or 10 sec. binning (whichever binning is satisfied first)

SN=5 or 10 sec. binning (T < 200 sec)

Quad-rate summed light curves (from T0-300s to T0+1000s)

Spectral Evolution

Spectra
Notes:
- 1) The fitting includes the systematic errors.
- 2) When the burst includes telescope slew time periods, the fitting uses an average response file made from multiple 5-s response files through out the slew time plus single time preiod for the non-slew times, and weighted by the total counts in the corresponding time period using addrmf. An average response file is needed becuase a spectral fit using the pre-slew DRM will introduce some errors in both a spectral shape and a normalization if the PHA file contains a lot of the slew/post-slew time interval.
- 3) For fits to more complicated models (e.g. a power-law over a cutoff power-law), the BAT team has decided to require a chi-square improvement of more than 6 for each extra dof.
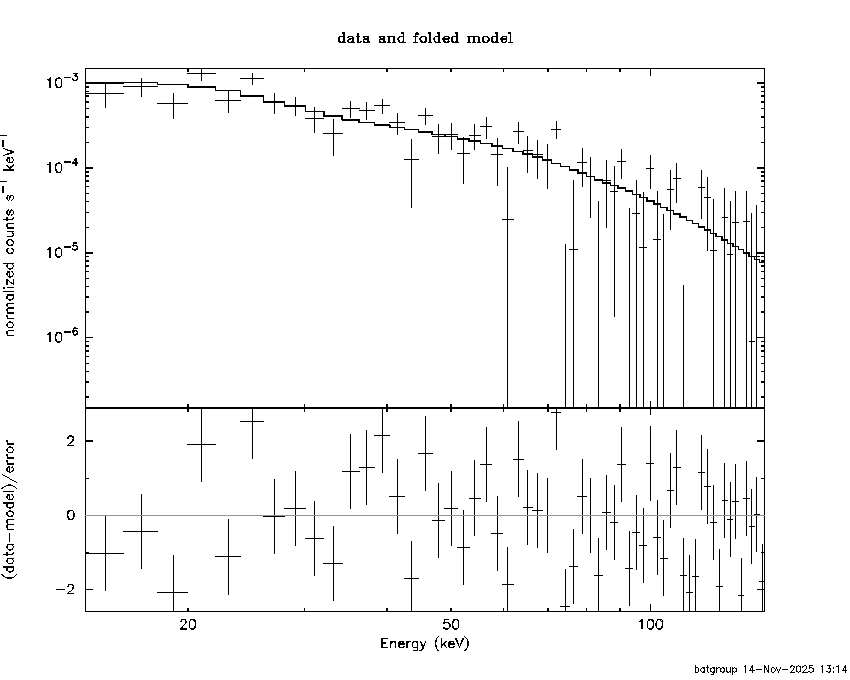
Time averaged spectrum fit using the average DRM
Power-law model

Time interval is from  -28.296 sec. to   32.380 sec.

Spectral model in power-law:
------------------------------------------------------------
Parameters  : value       lower 90%   higher 90%
Photon index: 1.85125     ( -0.1474   0.152454 )
Norm@50keV  : 1.53236E-03    ( -0.000153178   0.000151067 )
------------------------------------------------------------
#Fit statistic  : Chi-Squared                   88.98     using 59 bins.
 Reduced chi-squared = 1.56105
# Null hypothesis probability of 4.30e-03 with 57 degrees of freedom

Photon flux (15-150 keV)    in 60.68 sec: 0.215510 ( -0.018217  0.018223 ) ph/cm2/s
Energy fluence (15-150 keV)             : 8.55096e-07 ( -8.49107e-08  8.63282e-08 ) ergs/cm2
Cutoff power-law model

Time interval is from  -28.296 sec. to   32.380 sec.
Spectral model in the cutoff power-law:
------------------------------------------------------------
Parameters  : value       lower 90%   higher 90%
Photon index: 0.785792     ( -0.810178   0.676364 )
Epeak [keV] : 48.5710      ( -7.92018 16.3505 )
Norm@50keV  : 6.16610E-03    ( -0.00357632   0.0116941 )
------------------------------------------------------------
#Fit statistic  : Chi-Squared                   81.08     using 59 bins.
 Reduced chi-squared = 1.44786
# Null hypothesis probability of 1.59e-02 with 56 degrees of freedom

Photon flux (15-150 keV)    in 60.68 sec: 0.207262 ( -0.018833  0.018861 ) ph/cm2/s
Energy fluence (15-150 keV)             : 7.73688e-07 ( -9.15449e-08  9.68052e-08 ) ergs/cm2
Band function

Time interval is from  -28.296 sec. to   32.380 sec.


Spectral model in the Band function:
------------------------------------------------------------
Parameters  : value       lower 90%   higher 90%
alpha       :    (     )
beta        :     (     )
Epeak [keV] :       (   )
Norm@50keV   :     (     )
------------------------------------------------------------

Photon flux (15-150 keV)    in  sec:  (    ) ph/cm2/s
Energy fluence (15-150 keV)             : 0 ( 0  0 ) ergs/cm2
Single BB

Spectral model blackbody:
------------------------------------------------------------
Parameters  : value    Lower 90%  Upper 90%
kT [keV]    : 10.9225  (-1.0102  1.12828)
R^2/D10^2   : 7.44676E-02  (-0.0230915   0.0329269)
(R is the radius in km and D10 is the distance to the source in units of 10 kpc)
------------------------------------------------------------
#Fit statistic  : Chi-Squared                   97.46     using 59 bins.
 Reduced chi-squared =
# Null hypothesis probability of 6.79e-04 with 57 degrees of freedom

Energy  Fluence     90% Error
[keV]   [erg/cm2]   [erg/cm2]
15- 25  1.125e-07   1.702e-08
25- 50  3.152e-07   3.104e-08
50-150  2.112e-07   4.848e-08
15-150  6.388e-07   6.830e-08
Thermal bremsstrahlung (OTTB)

Spectral model: thermal bremsstrahlung
------------------------------------------------------------
Parameters  : value         Lower 90%    Upper 90%
kT [keV]    : 83.1996       (-20.2101      32.2363)
Norm        : 1.00782       (-0.125019     0.139759)
------------------------------------------------------------
#Fit statistic  : Chi-Squared                   82.56     using 59 bins.
 Reduced chi-squared =
# Null hypothesis probability of 1.51e-02 with 57 degrees of freedom

Energy  Fluence     90% Error
[keV]   [erg/cm2]   [erg/cm2]
15- 25  1.590e-07   1.978e-08
25- 50  2.643e-07   2.266e-08
50-150  3.829e-07   1.454e-07
15-150  8.062e-07   1.514e-07
Double BB

Spectral model: bbodyrad<1> + bbodyrad<2>
------------------------------------------------------------
Parameters  : value         Lower 90%    Upper 90%
kT1 [keV]   : 6.28518        (-2.13703      2.29667)
R1^2/D10^2  : 0.343553        (-0.204338      1.06521)
kT2 [keV]   : 17.6385        (-4.33791      11.0348)
R2^2/D10^2  : 8.51317E-03    (-0.0074371   0.021479)
------------------------------------------------------------
#Fit statistic  : Chi-Squared                   80.89     using 59 bins.
 Reduced chi-squared =
# Null hypothesis probability of 1.31e-02 with 55 degrees of freedom

Energy  Fluence     90% Error
[keV]   [erg/cm2]   [erg/cm2]
15- 25  1.490e-07   7.037e-08
25- 50  2.759e-07   1.184e-07
50-150  3.454e-07   1.846e-07
15-150  7.704e-07   3.642e-07
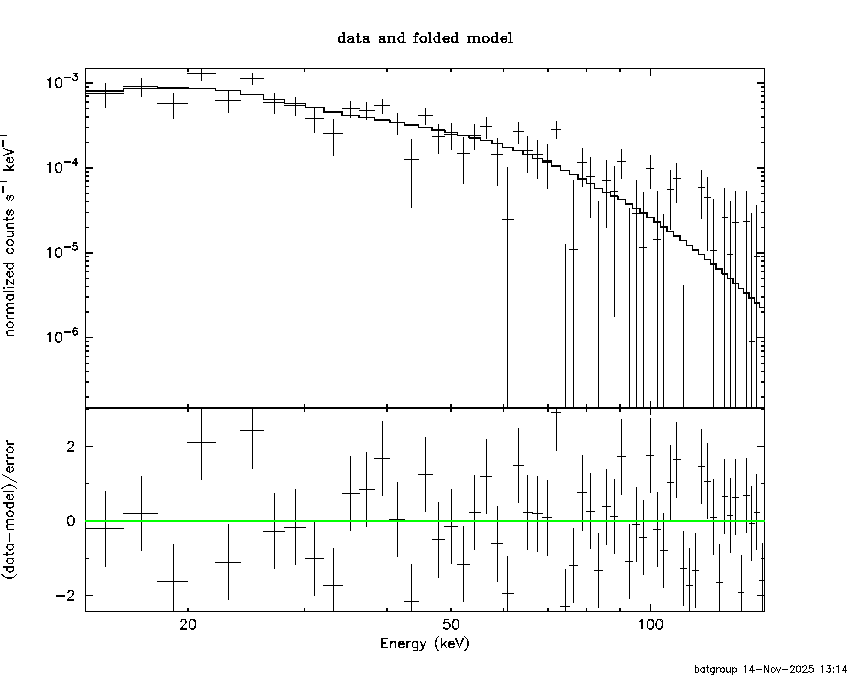
Peak spectrum fit
Power-law model

Time interval is from    1.052 sec. to    2.052 sec.

Spectral model in power-law:
------------------------------------------------------------
Parameters  : value       lower 90%   higher 90%
Photon index: 1.59440     ( -0.343314   0.356472 )
Norm@50keV  : 5.35822E-03    ( -0.00120865   0.0011794 )
------------------------------------------------------------
#Fit statistic  : Chi-Squared                   48.15     using 59 bins.
 Reduced chi-squared = 0.844737
# Null hypothesis probability of 7.92e-01 with 57 degrees of freedom

Photon flux (15-150 keV)    in 1 sec: 0.687390 ( -0.141592  0.141649 ) ph/cm2/s
Energy fluence (15-150 keV)             : 5.01522e-08 ( -1.19455e-08  1.22313e-08 ) ergs/cm2
Cutoff power-law model

Time interval is from    1.052 sec. to    2.052 sec.
Spectral model in the cutoff power-law:
------------------------------------------------------------
Parameters  : value       lower 90%   higher 90%
Photon index: 1.18983     ( -1.65284   0.735832 )
Epeak [keV] : 90.9014      ( -90.9147 -90.9147 )
Norm@50keV  : 8.98283E-03    ( -0.00898289   0.0695998 )
------------------------------------------------------------
#Fit statistic  : Chi-Squared                   47.83     using 59 bins.
 Reduced chi-squared = 0.854107
# Null hypothesis probability of 7.73e-01 with 56 degrees of freedom

Photon flux (15-150 keV)    in 1 sec: 0.680490 ( -0.14322  0.143141 ) ph/cm2/s
Energy fluence (15-150 keV)             : 4.8337e-08 ( -1.32828e-08  1.32757e-08 ) ergs/cm2
Band function

Time interval is from    1.052 sec. to    2.052 sec.


Spectral model in the Band function:
------------------------------------------------------------
Parameters  : value       lower 90%   higher 90%
alpha       :    (     )
beta        :     (     )
Epeak [keV] :       (   )
Norm@50keV   :     (     )
------------------------------------------------------------

Photon flux (15-150 keV)    in  sec:  (    ) ph/cm2/s
Energy fluence (15-150 keV)             : 0 ( 0  0 ) ergs/cm2
Single BB

Spectral model blackbody:
------------------------------------------------------------
Parameters  : value    Lower 90%  Upper 90%
kT [keV]    : 11.7166  (-2.81345  4.17578)
R^2/D10^2   : 0.187280  (-0.12448   0.319645)
(R is the radius in km and D10 is the distance to the source in units of 10 kpc)
------------------------------------------------------------
#Fit statistic  : Chi-Squared                   53.35     using 59 bins.
 Reduced chi-squared =
# Null hypothesis probability of 6.13e-01 with 57 degrees of freedom

Energy  Fluence     90% Error
[keV]   [erg/cm2]   [erg/cm2]
15- 25  5.425e-09   2.468e-09
25- 50  1.659e-08   6.698e-09
50-150  1.348e-08   6.580e-09
15-150  3.550e-08   1.341e-08
Thermal bremsstrahlung (OTTB)

Spectral model: thermal bremsstrahlung
------------------------------------------------------------
Parameters  : value         Lower 90%    Upper 90%
kT [keV]    : 162.927       (-92.9959      -161.537)
Norm        : 2.82177       (-0.609995     0.803365)
------------------------------------------------------------
#Fit statistic  : Chi-Squared                   47.82     using 59 bins.
 Reduced chi-squared =
# Null hypothesis probability of 8.01e-01 with 57 degrees of freedom

Energy  Fluence     90% Error
[keV]   [erg/cm2]   [erg/cm2]
15- 25  7.034e-09   4.176e-09
25- 50  1.347e-08   7.800e-09
50-150  2.916e-08   1.719e-08
15-150  4.967e-08   2.847e-08
Double BB

Spectral model: bbodyrad<1> + bbodyrad<2>
------------------------------------------------------------
Parameters  : value         Lower 90%    Upper 90%
kT1 [keV]   : 7.63239        (-2.70356      3.31812)
R1^2/D10^2  : 0.669200        (-0.470443      2.1896)
kT2 [keV]   : 32.7713        (-16.0557      -32.7895)
R2^2/D10^2  : 3.55073E-03    (-0.00325797   0.0361958)
------------------------------------------------------------
#Fit statistic  : Chi-Squared                   46.16     using 59 bins.
 Reduced chi-squared =
# Null hypothesis probability of 7.96e-01 with 55 degrees of freedom

Energy  Fluence     90% Error
[keV]   [erg/cm2]   [erg/cm2]
15- 25  7.356e-09   4.323e-09
25- 50  1.454e-08   7.910e-09
50-150  2.871e-08   1.558e-08
15-150  5.061e-08   2.592e-08
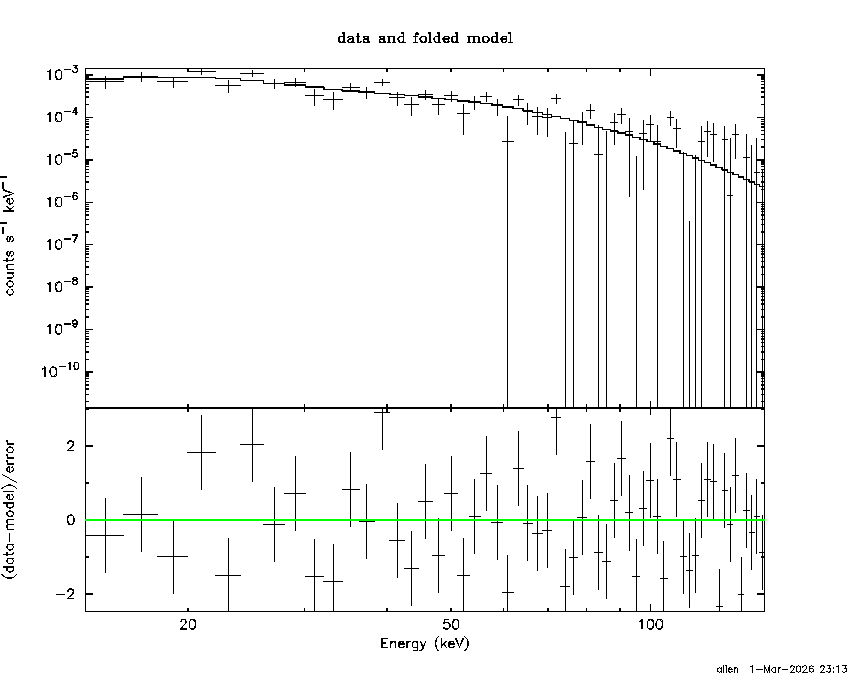
Pre-slew spectrum (Pre-slew PHA with pre-slew DRM)
Power-law model
Spectral model in power-law:
------------------------------------------------------------
Parameters  : value       lower 90%   higher 90%
Photon index: 1.80791     ( -0.154675   0.159869 )
Norm@50keV  : 1.48775E-03    ( -0.000155165   0.000152989 )
------------------------------------------------------------
#Fit statistic  : Chi-Squared                   96.32     using 59 bins.
 Reduced chi-squared =
# Null hypothesis probability of 8.80e-04 with 57 degrees of freedom

Photon flux (15-150 keV)    in 58.05 sec: 0.205641 ( -0.0184209  0.0184263 ) ph/cm2/s
Energy fluence (15-150 keV)             : 7.94873e-07 ( -8.36622e-08  8.49736e-08 ) ergs/cm2
Cutoff power-law model
Spectral model in the cutoff power-law:
------------------------------------------------------------
Parameters  : value       lower 90%   higher 90%
Photon index: 0.803240     ( -0.826165   0.687341 )
Epeak [keV] : 51.4764      ( -9.12344 23.3433 )
Norm@50keV  : 5.47315E-03    ( -0.00318936   0.010543 )
------------------------------------------------------------
#Fit statistic  : Chi-Squared                   89.62     using 59 bins.
 Reduced chi-squared =
# Null hypothesis probability of 2.89e-03 with 56 degrees of freedom

Photon flux (15-150 keV)    in 58.05 sec: 0.198303 ( -0.018992  0.019016 ) ph/cm2/s
Energy fluence (15-150 keV)             : 7.24255e-07 ( -9.02097e-08  9.50046e-08 ) ergs/cm2
Band function
Spectral model in the Band function:
------------------------------------------------------------
Parameters  : value       lower 90%   higher 90%
alpha       :    (     )
beta        :     (     )
Epeak [keV] :       (   )
Norm@50keV   :     (     )
------------------------------------------------------------

Photon flux (15-150 keV)    in  sec:  (    ) ph/cm2/s
Energy fluence (15-150 keV)             : 0 ( 0  0 ) ergs/cm2
S(25-50 keV) vs. S(50-100 keV) plot

S(25-50 keV)  = 2.45e-07
S(50-100 keV) = 2.72e-07
T90 vs. Hardness ratio plot

T90                                   = 55.3959999084473 sec.
Hardness ratio (energy fluence ratio) = 1.1102
Color vs. Color plot

Count Ratio  (25-50 keV) / (15-25 keV) = 1.11258
Count Ratio (50-100 keV) / (15-25 keV) = 0.588136
Mask shadow pattern

IMX = -1.401396433593152E-01, IMY = -1.265561355325417E-01
TIME vs. PHA plot around the trigger time

Blue+Cyan dotted lines: Time interval of the scaled map
From 0.000000 to 2.048000
TIME vs. DetID plot around the trigger time

Blue+Cyan dotted lines: Time interval of the scaled map
From 0.000000 to 2.048000
100 us light curve (15-350 keV)

Blue+Cyan dotted lines: Time interval of the scaled map
From 0.000000 to 2.048000
Spacecraft aspect plot

Bright source in the pre-burst/pre-slew/post-slew images
Pre-burst image of 15-350 keV band
Time interval of the image:
-239.544000 -28.296000

# RAcent  DECcent POSerr Theta    Phi  PeakCts   SNR AngSep     Name
#  [deg]    [deg]    ['] [deg]  [deg]                   [']
254.6977  35.3559  182.6  11.6    8.2   0.0188   0.1   11.8	Her X-1
262.7819 -24.7207    9.5  50.6 -139.1   1.7215   1.2   12.5	GX 1+4
268.4865  -1.5464   16.8  28.0 -151.7  -0.2407  -0.7    9.1	SW J1753.5-0127
270.3767 -25.1881    9.0  51.6 -147.9  -1.2501  -1.3    8.2	GX 5-1
270.2973 -25.7364    3.6  52.2 -147.7  -3.3800  -3.2    0.5	GRS 1758-258
273.9875 -14.0407    3.1  41.5 -155.8   1.8909   3.8    1.1	GX 17+2
275.9641 -30.4318   90.6  57.8 -152.5   0.2396   0.1    4.4	H1820-303
285.1059 -24.9565    5.4  55.3 -163.9   2.2402   2.1    4.4	HT1900.1-2455
288.8674  10.8800    5.8  29.1  157.3   0.8839   2.0    5.7	GRS 1915+105
299.6022  35.2128    0.8  33.1  105.8   7.5155  14.3    0.9	Cyg X-1
308.3252  40.9140    8.9  40.6   97.7   1.2336   1.3   10.0	Cyg X-3
291.1667  48.9991    3.3  32.1   77.7   1.9698   3.5 ------	UNKNOWN
Pre-slew background subtracted image of 15-350 keV band
Time interval of the image:
-28.296000 29.756600

# RAcent  DECcent POSerr Theta    Phi  PeakCts   SNR AngSep     Name
#  [deg]    [deg]    ['] [deg]  [deg]                   [']
254.5198  35.3607   14.0  11.7    7.6   0.0737   0.8    3.2	Her X-1
262.8758 -24.7128  506.4  50.6 -139.2  -0.0090  -0.0    7.5	GX 1+4
268.3195  -1.6010   76.5  28.0 -151.3  -0.0152  -0.2    9.4	SW J1753.5-0127
270.1544 -25.0402   11.3  51.4 -147.7  -0.3210  -1.0    7.4	GX 5-1
270.3005 -25.7762    6.0  52.2 -147.7   0.6366   1.9    2.0	GRS 1758-258
274.0271 -14.1973    7.2  41.6 -155.8   0.2425   1.6    9.7	GX 17+2
275.8555 -30.4203  200.2  57.7 -152.4   0.0313   0.1    4.8	H1820-303
284.9882 -24.7733    4.5  55.1 -163.8   0.9223   2.6    9.2	HT1900.1-2455
288.7304  11.0754    5.4  28.9  157.1   0.2501   2.1    8.8	GRS 1915+105
299.8076  35.1430    0.0  33.3  106.0   0.2739   1.6   11.2	Cyg X-1
308.1052  40.8780   29.1  40.5   97.7   0.1608   0.4    4.5	Cyg X-3
279.2537  25.5610    2.4  15.2  128.7   0.4746   4.8 ------	UNKNOWN
274.0820  24.1606    0.7  10.7  137.9   1.6634  17.9 ------	UNKNOWN
267.4139 -28.1820    2.2  54.3 -144.1   2.5549   5.2 ------	UNKNOWN
Post-slew image of 15-350 keV band
Time interval of the image:
69.556600 95.934500
97.456000 962.507300

# RAcent  DECcent POSerr Theta    Phi  PeakCts   SNR AngSep     Name
#  [deg]    [deg]    ['] [deg]  [deg]                   [']
254.2470  35.3064   13.1  20.4  -13.2  -1.0857  -0.9   10.5	Her X-1
268.3304  -1.3977   12.8  26.2 -127.8   1.2448   0.9    4.0	SW J1753.5-0127
270.4907 -25.1132    4.1  49.5 -136.5  15.4589   2.8   11.4	GX 5-1
270.1762 -25.7260    7.3  50.1 -136.2   9.4716   1.6    6.9	GRS 1758-258
274.0835 -14.0311    5.9  38.3 -140.8   4.0346   2.0    4.5	GX 17+2
284.9163 -24.9722    7.0  50.3 -153.6  -5.2235  -1.7    7.2	HT1900.1-2455
289.0018  10.9035    0.0  19.5  169.8  -1.5369  -1.3   12.2	GRS 1915+105
299.6157  35.2184    0.7  24.7   97.0  28.6082  16.4    1.6	Cyg X-1
308.1418  40.9594   49.3  33.0   90.5   0.5231   0.2    1.5	Cyg X-3
212.8188  38.0384    2.5  53.2  -20.2  15.2713   4.5 ------	UNKNOWN
Plot creation:
Sun Mar  1 23:13:34 EST 2026