Special notes of this burst
Image
Pre-slew 15.0-350.0 keV image (Event data)
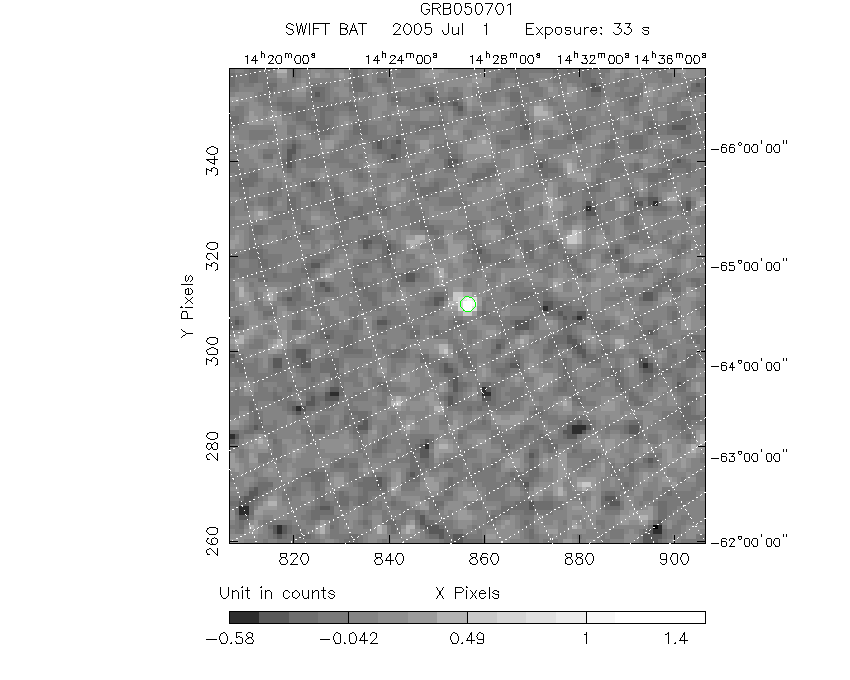
#   RAcent    DECcent   POSerr    Theta     Phi              Peak Cts       SNR   Name
  227.2447   -59.4003   0.0186    19.4777    82.1230         1.5764245     10.345 TRIG_00143708

Foreground time interval of the image:
 -4.732  28.408 (delta_t =  33.140 [sec])
Background time interval of the image:
-10.072  -4.732 (delta_t =   5.340 [sec])
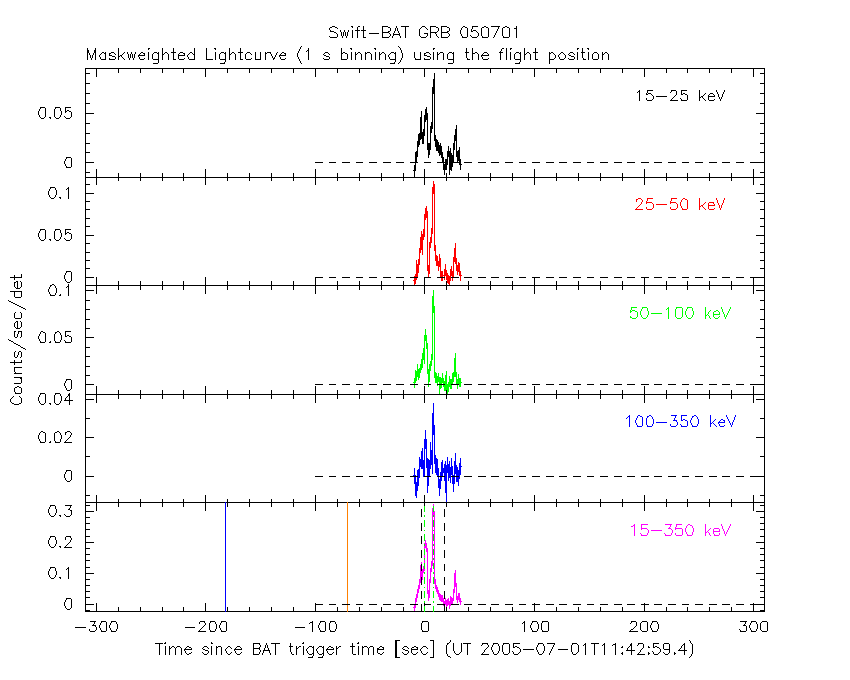
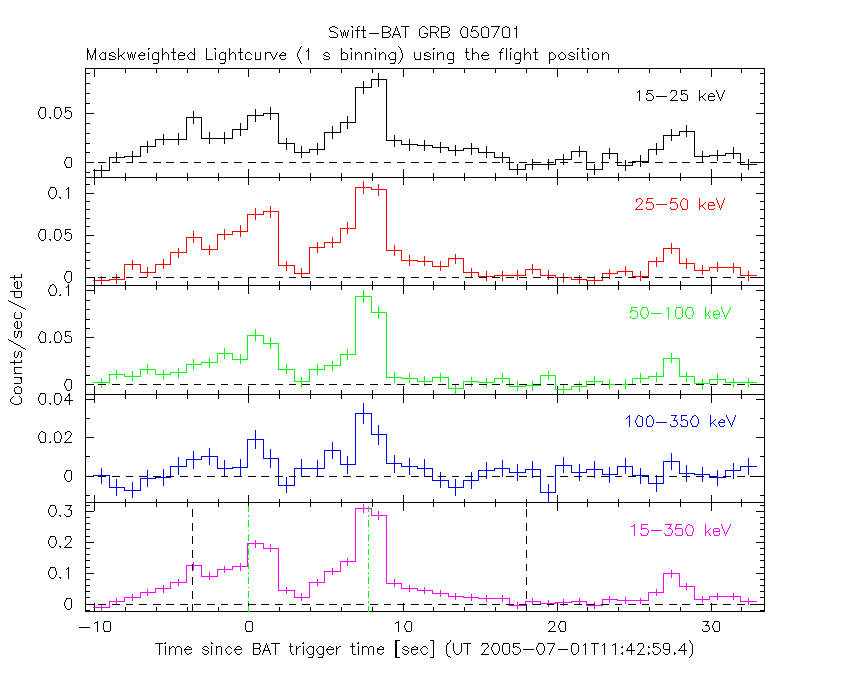
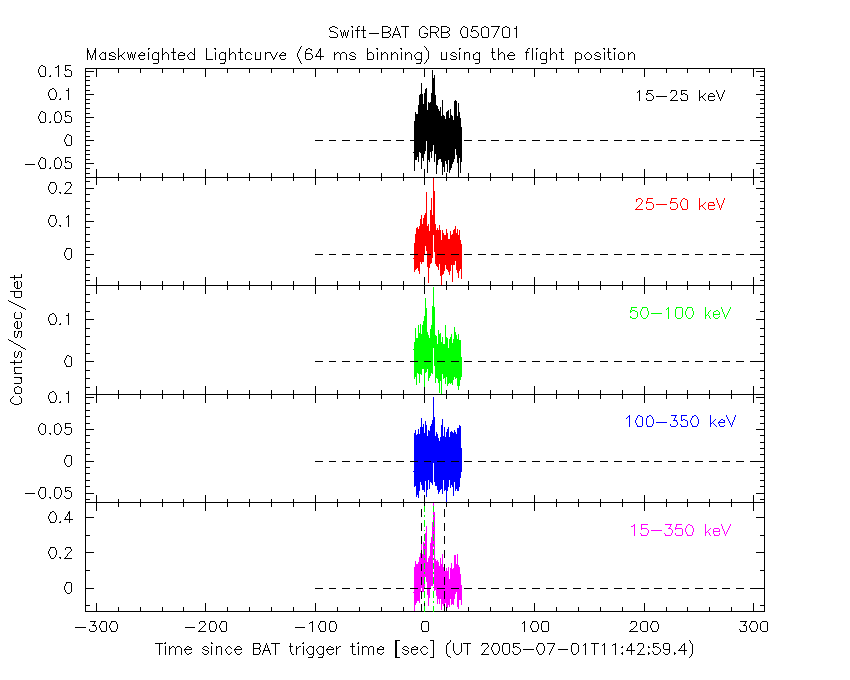
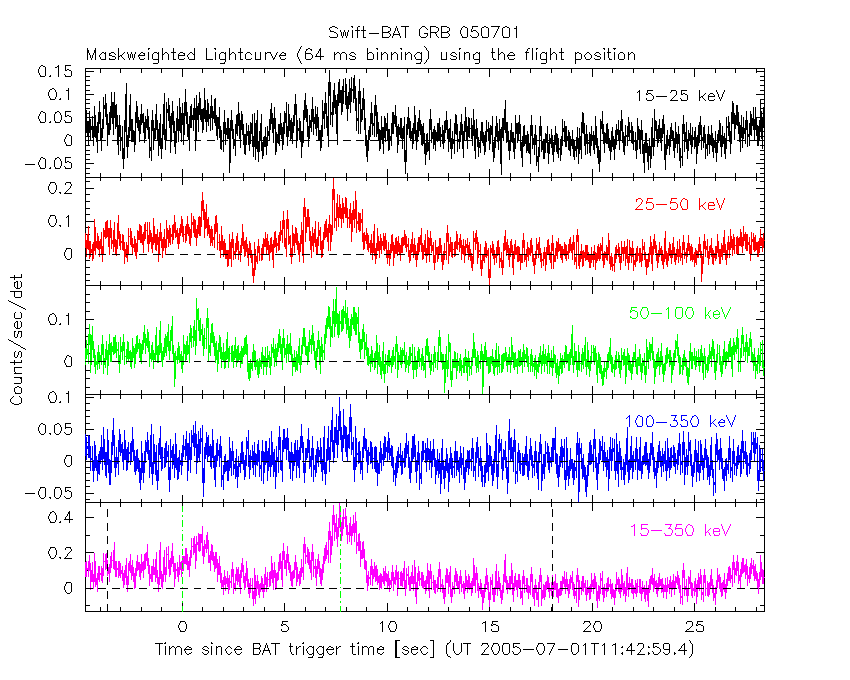
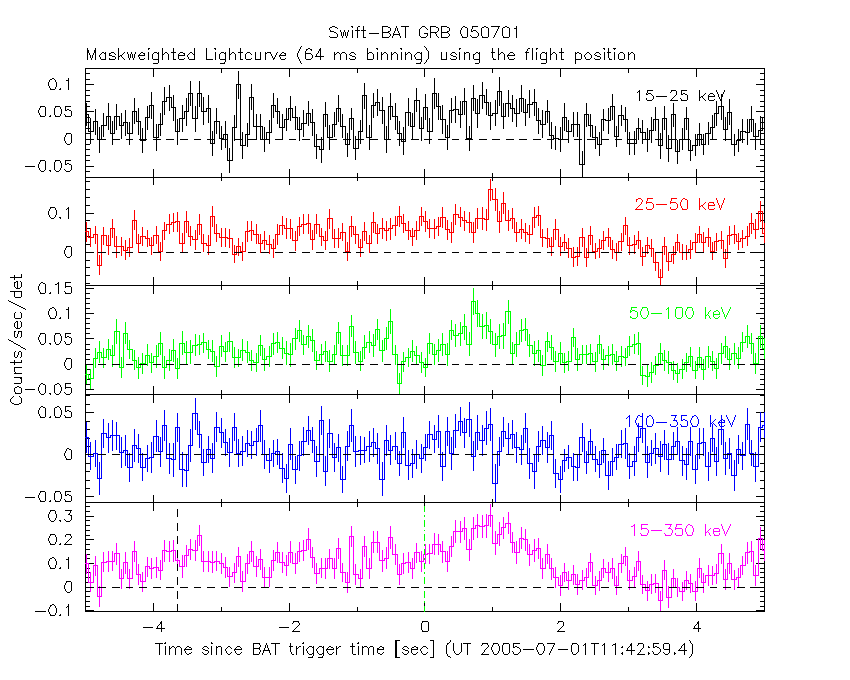
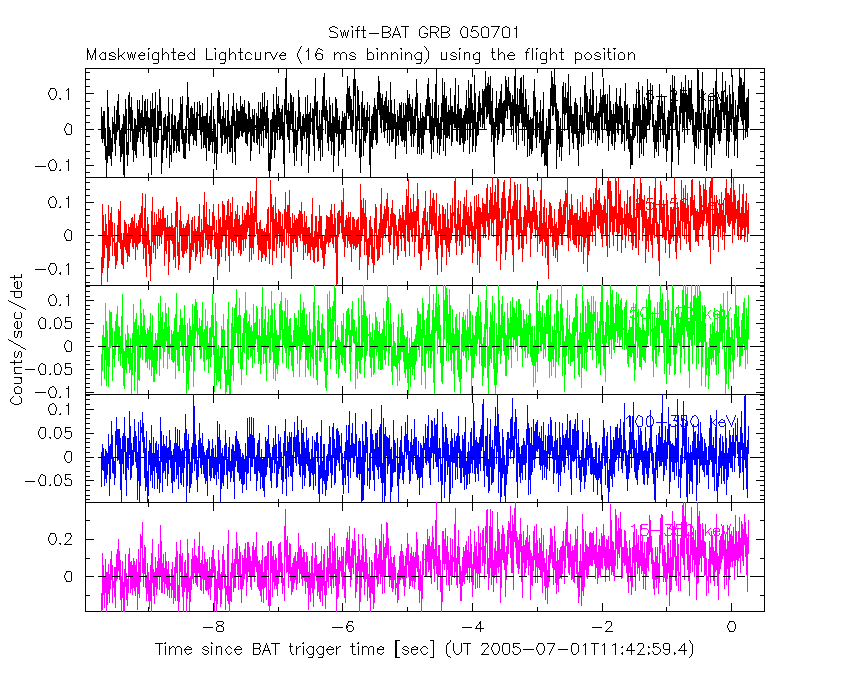
Lightcurves
Notes:
- 1) The mask-weighted light curves are using the flight position.
- 2) Multiple plots of different time binning/intervals are shown to cover all scenarios of short/long GRBs, rate/image triggers, and real/false positives.
- 3) For all the mask-weighted lightcurves, the y-axis units are counts/sec/det where a det is 0.4 x 0.4 = 0.16 sq cm.
- 4) The verticle lines correspond to following: green dotted lines are T50 interval, black dotted lines are T90 interval, blue solid line(s) is a spacecraft slew start time, and orange solid line(s) is a spacecraft slew end time.
- 5) Time of each bin is in the middle of the bin.
1 s binning
From T0-310 s to T0+310 s
From T100_start - 20 s to T100_end + 30 s
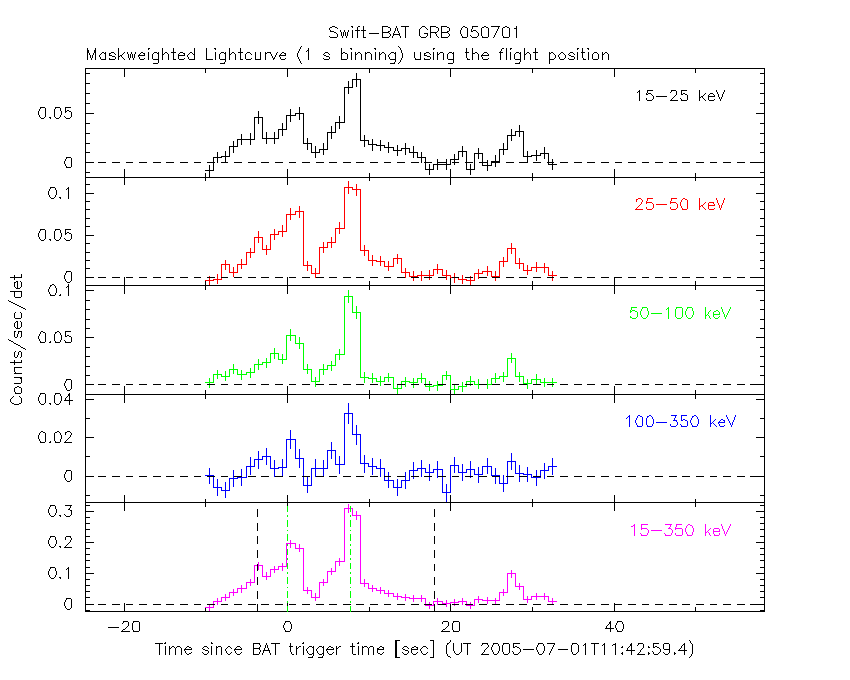
Full time interval
64 ms binning
Full time interval
From T100_start to T100_end
From T0-5 sec to T0+5 sec
16 ms binning
From T100_start-5 s to T100_start+5 s
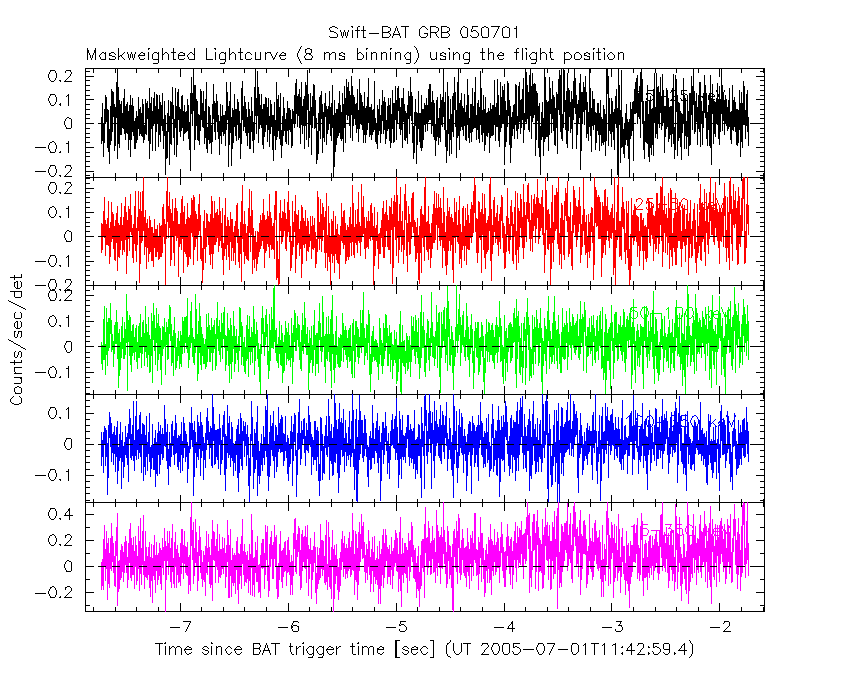
8 ms binning
From T100_start-3 s to T100_start+3 s
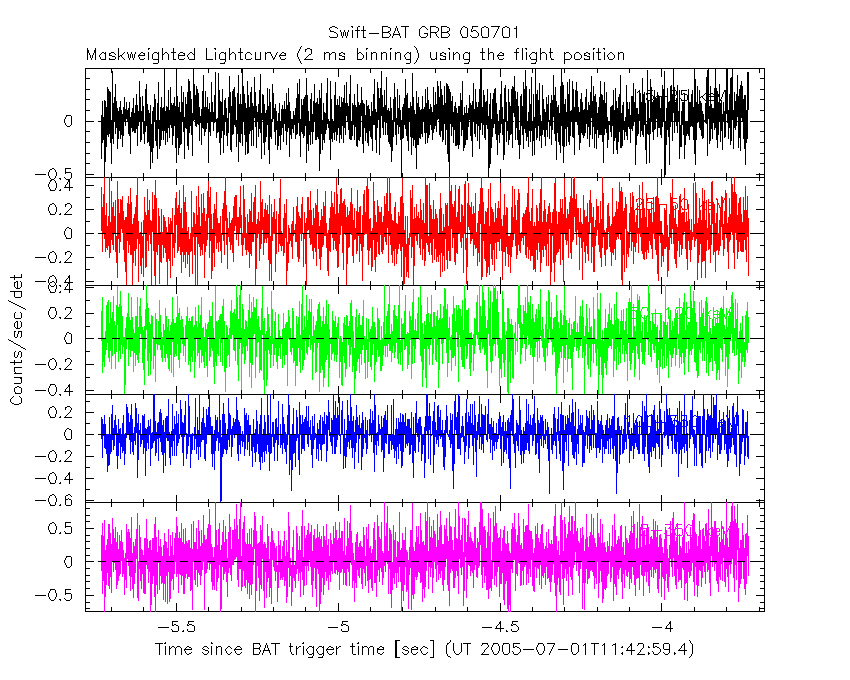
2 ms binning
From T100_start-1 s to T100_start+1 s
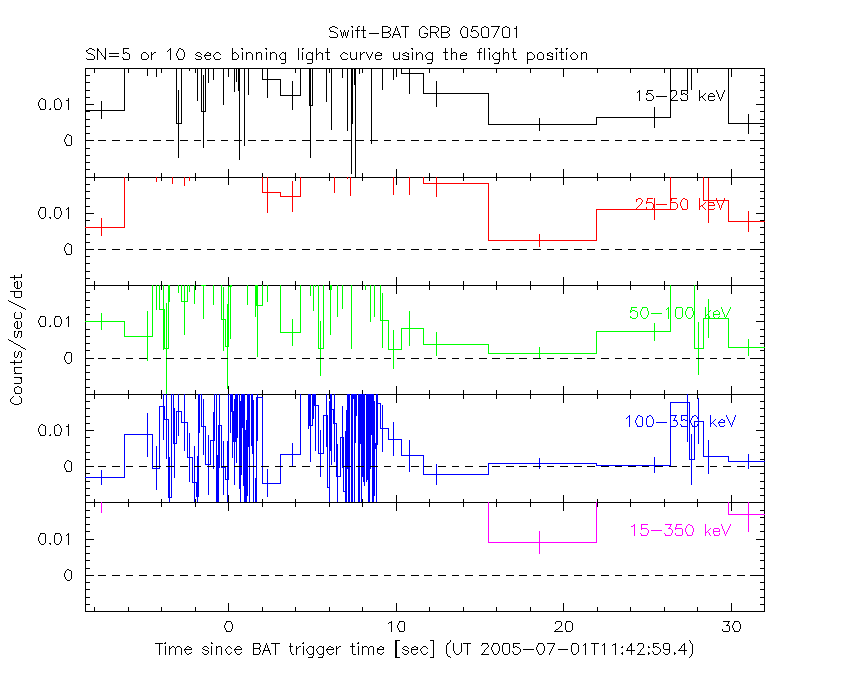
SN=5 or 10 sec. binning (whichever binning is satisfied first)
SN=5 or 10 sec. binning (T < 200 sec)

Quad-rate summed light curves (from T0-300s to T0+1000s)

Spectral Evolution

Spectra
Notes:
- 1) The fitting includes the systematic errors.
- 2) When the burst includes telescope slew time periods, the fitting uses an average response file made from multiple 5-s response files through out the slew time plus single time preiod for the non-slew times, and weighted by the total counts in the corresponding time period using addrmf. An average response file is needed becuase a spectral fit using the pre-slew DRM will introduce some errors in both a spectral shape and a normalization if the PHA file contains a lot of the slew/post-slew time interval.
- 3) For fits to more complicated models (e.g. a power-law over a cutoff power-law), the BAT team has decided to require a chi-square improvement of more than 6 for each extra dof.
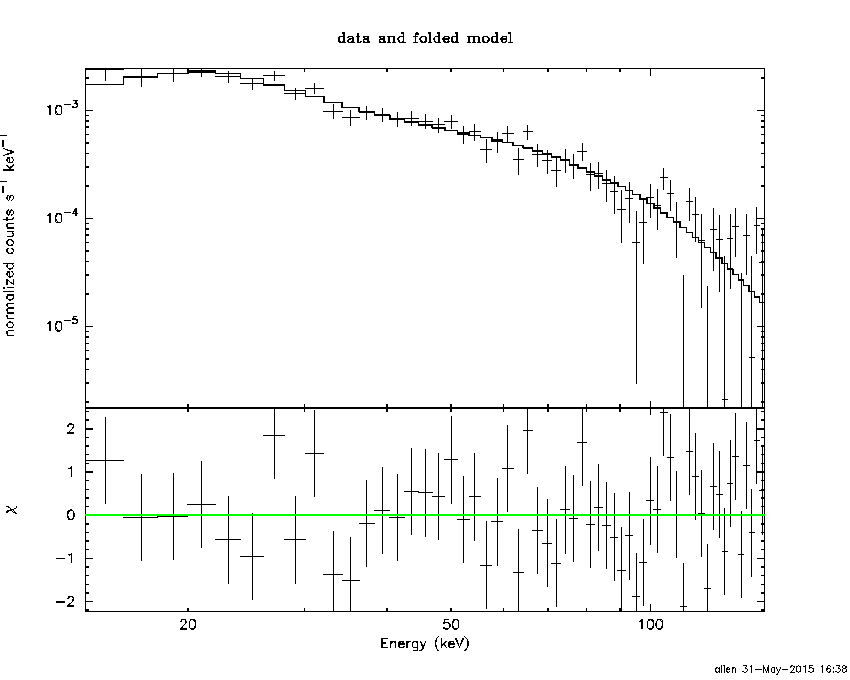
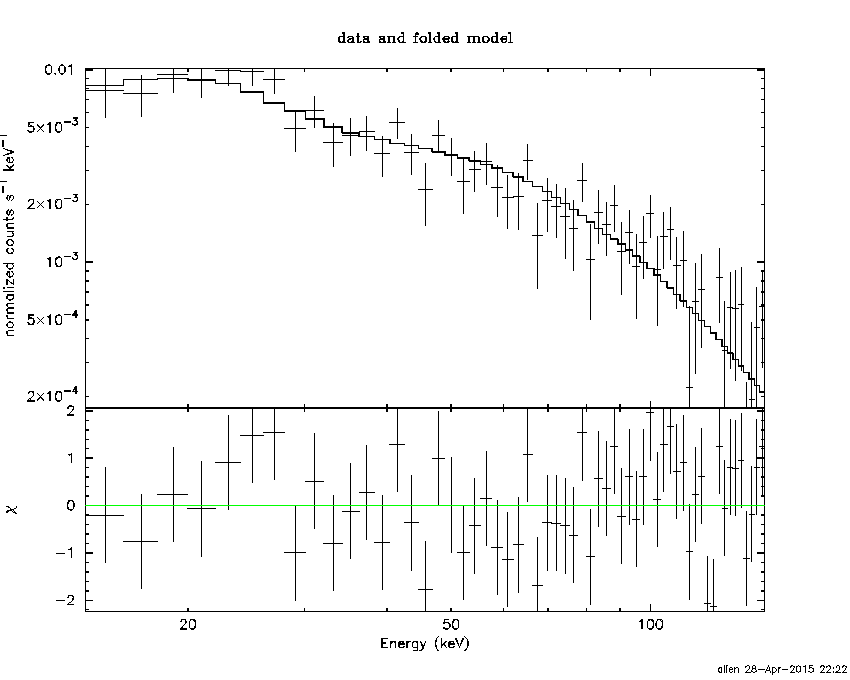
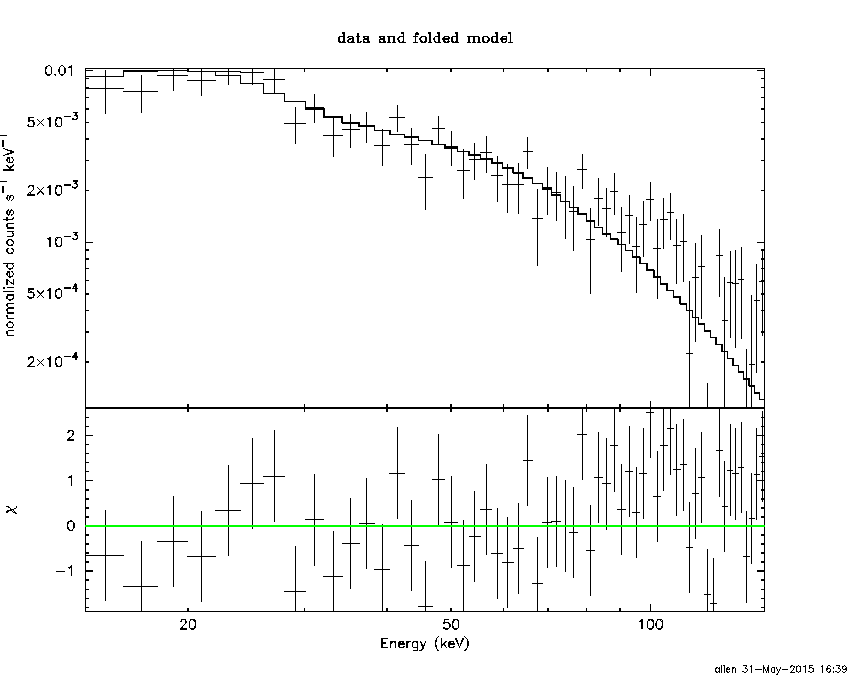
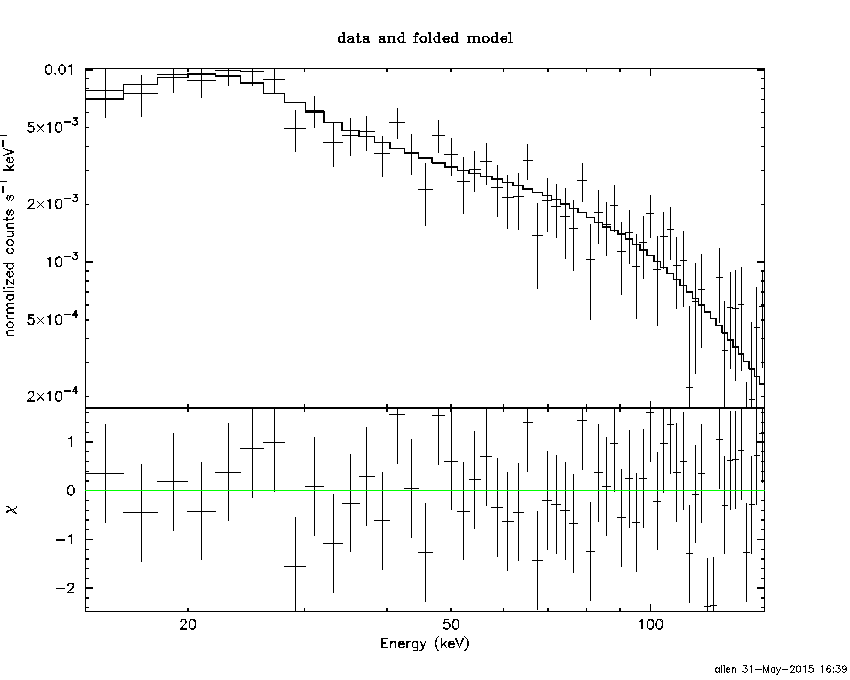
Time averaged spectrum fit using the average DRM
Power-law model

Time interval is from   -4.732 sec. to   28.408 sec.

Spectral model in power-law:
------------------------------------------------------------
Parameters  : value       lower 90%   higher 90%
Photon index: 1.68442     ( -0.0840815   0.0848213 )
Norm@50keV  : 4.43188E-03    ( -0.000207115   0.000206145 )
------------------------------------------------------------
#Fit statistic : Chi-Squared =          61.47 using 59 PHA bins.
# Reduced chi-squared =          1.079 for     57 degrees of freedom
# Null hypothesis probability =   3.189229e-01

Photon flux (15-150 keV)    in 33.14 sec: 0.585436 ( -0.026887  0.0269378 ) ph/cm2/s
Energy fluence (15-150 keV)             : 1.36161e-06 ( -6.7189e-08  6.75642e-08 ) ergs/cm2
Cutoff power-law model

Time interval is from   -4.732 sec. to   28.408 sec.
Spectral model in the cutoff power-law:
------------------------------------------------------------
Parameters  : value       lower 90%   higher 90%
Photon index: 1.57294     ( -0.333402   0.185948 )
Epeak [keV] : 186.079      (   )
Norm@50keV  : 5.05546E-03    (     )
------------------------------------------------------------
#Fit statistic : Chi-Squared =          61.11 using 59 PHA bins.
# Reduced chi-squared =          1.091 for     56 degrees of freedom
# Null hypothesis probability =   2.974469e-01

Photon flux (15-150 keV)    in 33.14 sec: 0.581268 ( -0.029147  0.029081 ) ph/cm2/s
Energy fluence (15-150 keV)             : 1.34781e-06 ( -7.86313e-08  7.69643e-08 ) ergs/cm2
Band function

Time interval is from   -4.732 sec. to   28.408 sec.

Spectral model in the Band function:
------------------------------------------------------------
Parameters  : value       lower 90%   higher 90%
alpha       : -0.368773   ( 0.95908   0.95908 )
beta        : -1.74606    ( 1.73635   0.107431 )
Epeak [keV] : 35.7848      ( -35.8359 221.307 )
Norm@50keV   : 3.55197E-02    ( -0.0365645   366.273 )
------------------------------------------------------------
#Fit statistic : Chi-Squared =          59.46 using 59 PHA bins.
# Reduced chi-squared =          1.081 for     55 degrees of freedom
# Null hypothesis probability =   3.164805e-01

Photon flux (15-150 keV)    in 33.14 sec:  (    ) ph/cm2/s
Energy fluence (15-150 keV)             : 0 ( 0  0 ) ergs/cm2
Single BB

Spectral model blackbody:
------------------------------------------------------------
Parameters  : value    Lower 90%  Upper 90%
kT [keV]    : 13.2401  (  )
R^2/D10^2   : 9.56434E-02  (   )
(R is the radius in km and D10 is the distance to the source in units of 10 kpc)
------------------------------------------------------------
#Fit statistic : Chi-Squared =         185.00 using 59 PHA bins.
# Reduced chi-squared =         3.2456 for     57 degrees of freedom
# Null hypothesis probability =   1.943303e-15

Energy  Fluence     90% Error
[keV]   [erg/cm2]   [erg/cm2]
15- 25  1.178e-07   9.478e-09
25- 50  4.137e-07   2.071e-08
50-150  4.634e-07   4.557e-08
15-150  9.949e-07   5.286e-08
Thermal bremsstrahlung (OTTB)

Spectral model: thermal bremsstrahlung
------------------------------------------------------------
Parameters  : value         Lower 90%    Upper 90%
kT [keV]    : 147.618       (-31.6668      38.6801)
Norm        : 2.38237       (-0.0648377     0.157814)
------------------------------------------------------------
#Fit statistic : Chi-Squared =          63.25 using 59 PHA bins.
# Reduced chi-squared =          1.110 for     57 degrees of freedom
# Null hypothesis probability =   2.652248e-01

Energy  Fluence     90% Error
[keV]   [erg/cm2]   [erg/cm2]
15- 25  2.030e-07   1.415e-08
25- 50  3.755e-07   3.369e-08
50-150  7.362e-07   2.089e-07
15-150  1.315e-06   2.522e-07
Double BB
Spectral model: bbodyrad<1> + bbodyrad<2>
------------------------------------------------------------
Parameters  : value         Lower 90%    Upper 90%
kT1 [keV]   : 6.80600        (-0.923402      1.0127)
R1^2/D10^2  : 0.752713        (-0.282837      0.514771)
kT2 [keV]   : 25.9953        (-4.03541      6.33158)
R2^2/D10^2  : 6.53899E-03    (-0.00348317   0.00569175)
------------------------------------------------------------
#Fit statistic : Chi-Squared =          62.69 using 59 PHA bins.
# Reduced chi-squared =          1.140 for     55 degrees of freedom
# Null hypothesis probability =   2.223187e-01

Energy  Fluence     90% Error
[keV]   [erg/cm2]   [erg/cm2]
15- 25  2.050e-07   2.701e-08
25- 50  3.775e-07   3.889e-08
50-150  7.521e-07   1.572e-07
15-150  1.335e-06   1.748e-07
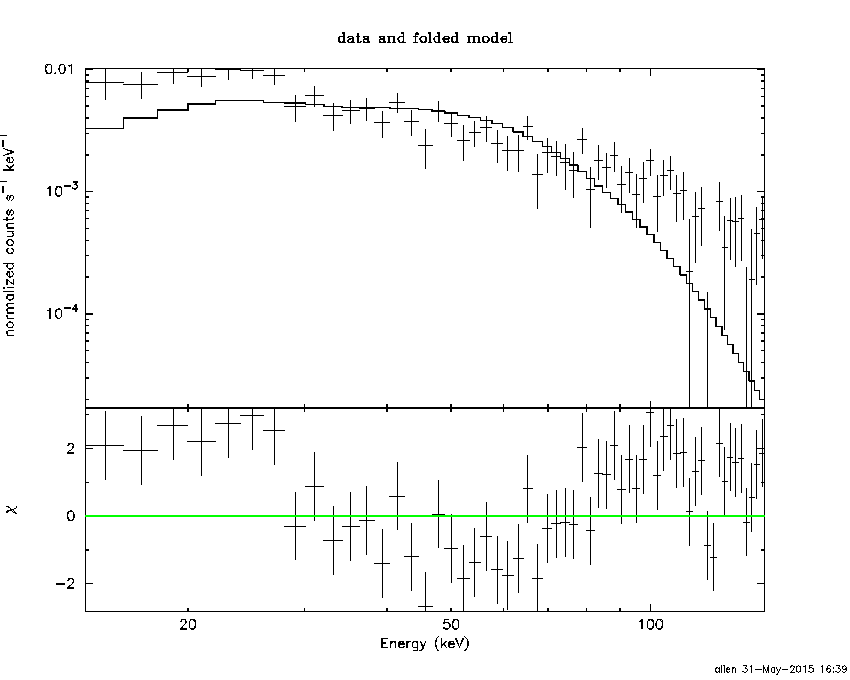
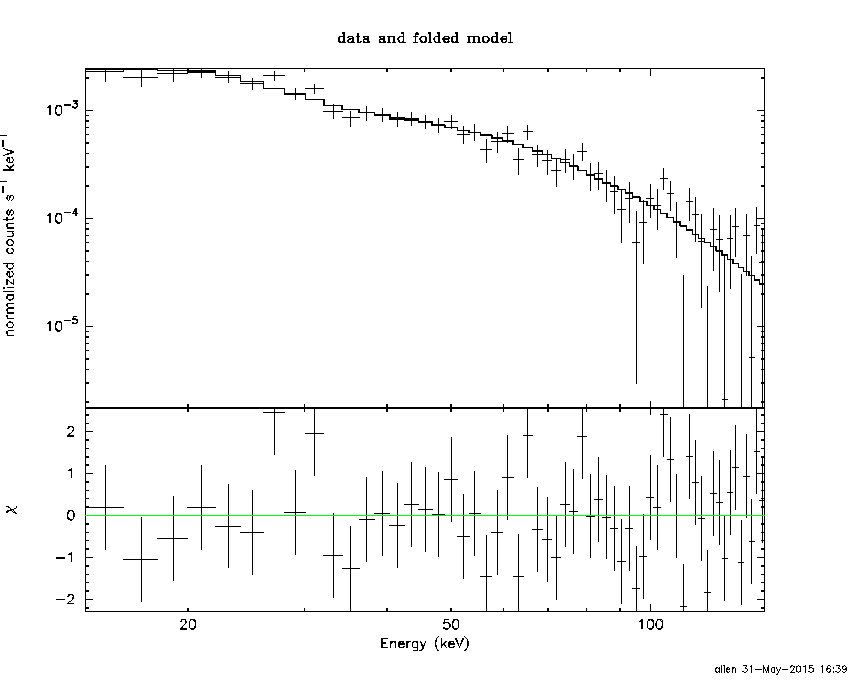
Peak spectrum fit
Power-law model

Time interval is from    7.364 sec. to    8.364 sec.

Spectral model in power-law:
------------------------------------------------------------
Parameters  : value       lower 90%   higher 90%
Photon index: 1.33944     ( -0.116605   0.116288 )
Norm@50keV  : 2.27875E-02    ( -0.00143074   0.0014267 )
------------------------------------------------------------
#Fit statistic : Chi-Squared =          56.93 using 59 PHA bins.
# Reduced chi-squared =         0.9988 for     57 degrees of freedom
# Null hypothesis probability =   4.776745e-01

Photon flux (15-150 keV)    in 1 sec: 2.73934 ( -0.174039  0.174364 ) ph/cm2/s
Energy fluence (15-150 keV)             : 2.23093e-07 ( -1.58984e-08  1.60087e-08 ) ergs/cm2
Cutoff power-law model
Time interval is from    7.364 sec. to    8.364 sec.
Spectral model in the cutoff power-law:
------------------------------------------------------------
Parameters  : value       lower 90%   higher 90%
Photon index: 1.33485     ( -0.202994   0.118172 )
Epeak [keV] : 9999.30      ( -9999.35 -9999.35 )
Norm@50keV  : 2.28723E-02    ( -0.0014368   0.00501687 )
------------------------------------------------------------
#Fit statistic : Chi-Squared =          56.98 using 59 PHA bins.
# Reduced chi-squared =          1.017 for     56 degrees of freedom
# Null hypothesis probability =   4.385606e-01

Photon flux (15-150 keV)    in 1 sec: 2.74244 ( -0.09094  0.17116 ) ph/cm2/s
Energy fluence (15-150 keV)             : 2.21768e-07 ( -1.4692e-08  1.7018e-08 ) ergs/cm2
Band function
Time interval is from    7.364 sec. to    8.364 sec.

Spectral model in the Band function:
------------------------------------------------------------
Parameters  : value       lower 90%   higher 90%
alpha       : 4.95857   ( -4.95857   -4.95857 )
beta        : -1.36600    ( -0.124874   0.123293 )
Epeak [keV] : 22.1389      ( -22.1389 5.12092 )
Norm@50keV   : 4046.02    ( -250.723   9.19341e+06 )
------------------------------------------------------------
#Fit statistic : Chi-Squared =          56.59 using 59 PHA bins.
# Reduced chi-squared =          1.029 for     55 degrees of freedom
# Null hypothesis probability =   4.155650e-01

Photon flux (15-150 keV)    in 1 sec:  (    ) ph/cm2/s
Energy fluence (15-150 keV)             : 0 ( 0  0 ) ergs/cm2
Single BB
Spectral model blackbody:
------------------------------------------------------------
Parameters  : value    Lower 90%  Upper 90%
kT [keV]    : 16.6413  (  )
R^2/D10^2   : 0.214243  (   )
(R is the radius in km and D10 is the distance to the source in units of 10 kpc)
------------------------------------------------------------
#Fit statistic : Chi-Squared =         149.43 using 59 PHA bins.
# Reduced chi-squared =         2.6216 for     57 degrees of freedom
# Null hypothesis probability =   3.205446e-10

Energy  Fluence     90% Error
[keV]   [erg/cm2]   [erg/cm2]
15- 25  1.215e-08   1.595e-09
25- 50  5.285e-08   4.820e-09
50-150  1.038e-07   1.280e-08
15-150  1.688e-07   1.385e-08
Thermal bremsstrahlung (OTTB)
Spectral model: thermal bremsstrahlung
------------------------------------------------------------
Parameters  : value         Lower 90%    Upper 90%
kT [keV]    : 200.000       (      )
Norm        : 11.2574       (-0.704725     0.70467)
------------------------------------------------------------
#Fit statistic : Chi-Squared =          70.49 using 59 PHA bins.
# Reduced chi-squared =          1.237 for     57 degrees of freedom
# Null hypothesis probability =   1.081203e-01

Energy  Fluence     90% Error
[keV]   [erg/cm2]   [erg/cm2]
15- 25  2.804e-08   1.915e-09
25- 50  5.393e-08   5.480e-09
50-150  1.183e-07   2.434e-08
15-150  2.003e-07   3.140e-08
Double BB
Spectral model: bbodyrad<1> + bbodyrad<2>
------------------------------------------------------------
Parameters  : value         Lower 90%    Upper 90%
kT1 [keV]   : 7.37109        (-1.07979      1.22034)
R1^2/D10^2  : 2.53785        (-1.03799      1.91754)
kT2 [keV]   : 39.3704        (-8.26166      15.4077)
R2^2/D10^2  : 1.16936E-02    (-0.00679329   0.0118173)
------------------------------------------------------------
#Fit statistic : Chi-Squared =          50.25 using 59 PHA bins.
# Reduced chi-squared =         0.9136 for     55 degrees of freedom
# Null hypothesis probability =   6.564427e-01

Energy  Fluence     90% Error
[keV]   [erg/cm2]   [erg/cm2]
15- 25  2.566e-08   4.865e-09
25- 50  5.125e-08   9.075e-09
50-150  1.575e-07   5.176e-08
15-150  2.344e-07   6.205e-08
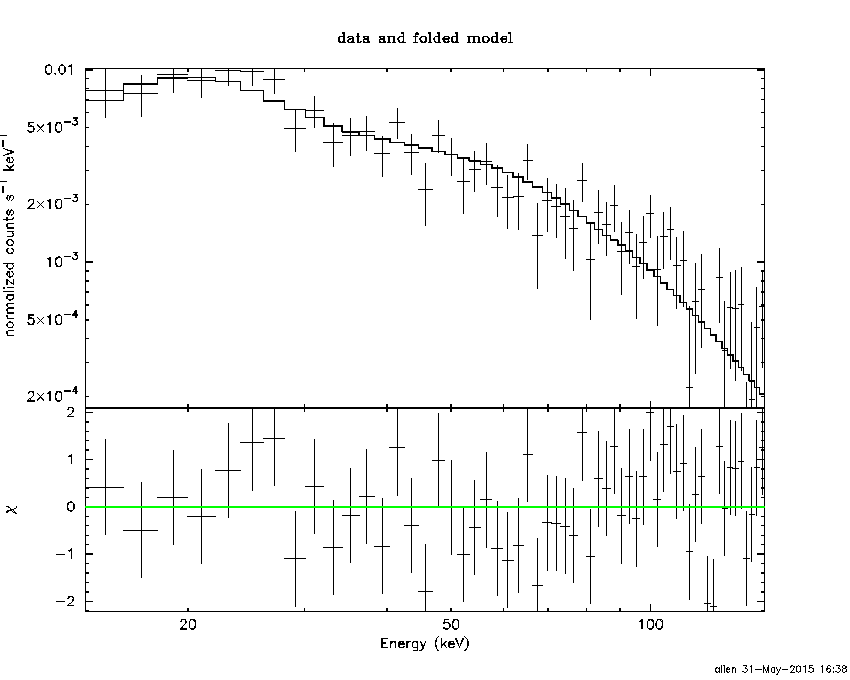
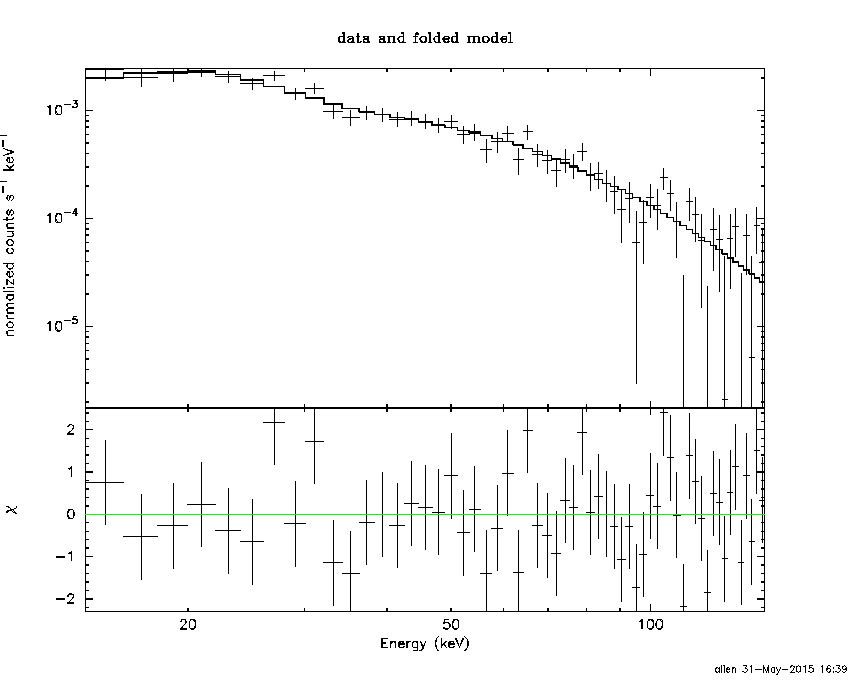
Pre-slew spectrum (Pre-slew PHA with pre-slew DRM)
Power-law model

Spectral model in power-law:
------------------------------------------------------------
Parameters  : value       lower 90%   higher 90%
Photon index: 1.68442     ( -0.0840815   0.0848213 )
Norm@50keV  : 4.43188E-03    ( -0.000207115   0.000206145 )
------------------------------------------------------------
#Fit statistic : Chi-Squared =          61.47 using 59 PHA bins.
# Reduced chi-squared =          1.079 for     57 degrees of freedom
# Null hypothesis probability =   3.189229e-01

Photon flux (15-150 keV)    in 33.14 sec: 0.585436 ( -0.026887  0.0269378 ) ph/cm2/s
Energy fluence (15-150 keV)             : 1.36161e-06 ( -6.7189e-08  6.75642e-08 ) ergs/cm2
Cutoff power-law model
Spectral model in the cutoff power-law:
------------------------------------------------------------
Parameters  : value       lower 90%   higher 90%
Photon index: 1.57294     ( -0.333402   0.185948 )
Epeak [keV] : 186.079      (   )
Norm@50keV  : 5.05546E-03    (     )
------------------------------------------------------------
#Fit statistic : Chi-Squared =          61.11 using 59 PHA bins.
# Reduced chi-squared =          1.091 for     56 degrees of freedom
# Null hypothesis probability =   2.974469e-01

Photon flux (15-150 keV)    in 33.14 sec: 0.581268 ( -0.029147  0.029081 ) ph/cm2/s
Energy fluence (15-150 keV)             : 1.34781e-06 ( -7.86313e-08  7.69643e-08 ) ergs/cm2
Band function
Spectral model in the Band function:
------------------------------------------------------------
Parameters  : value       lower 90%   higher 90%
alpha       : -0.368773   ( 0.95908   0.95908 )
beta        : -1.74606    ( 1.73635   0.107431 )
Epeak [keV] : 35.7848      ( -35.8359 221.307 )
Norm@50keV   : 3.55197E-02    ( -0.0365645   366.274 )
------------------------------------------------------------
#Fit statistic : Chi-Squared =          59.46 using 59 PHA bins.
# Reduced chi-squared =          1.081 for     55 degrees of freedom
# Null hypothesis probability =   3.164805e-01

Photon flux (15-150 keV)    in 33.14 sec:  (    ) ph/cm2/s
Energy fluence (15-150 keV)             : 0 ( 0  0 ) ergs/cm2
S(25-50 keV) vs. S(50-100 keV) plot
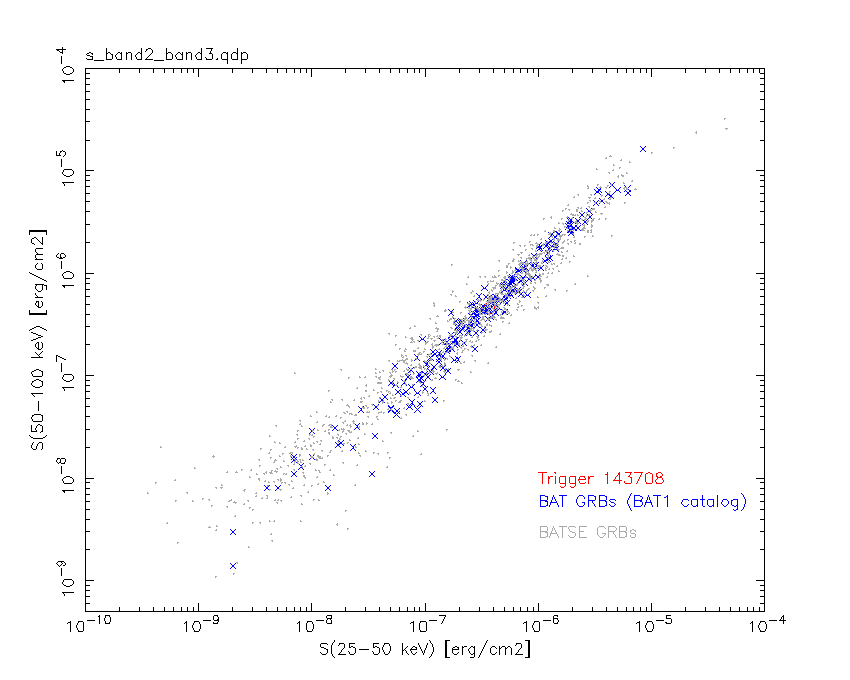
S(25-50 keV)  = 3.66e-07
S(50-100 keV) = 4.56e-07
T90 vs. Hardness ratio plot
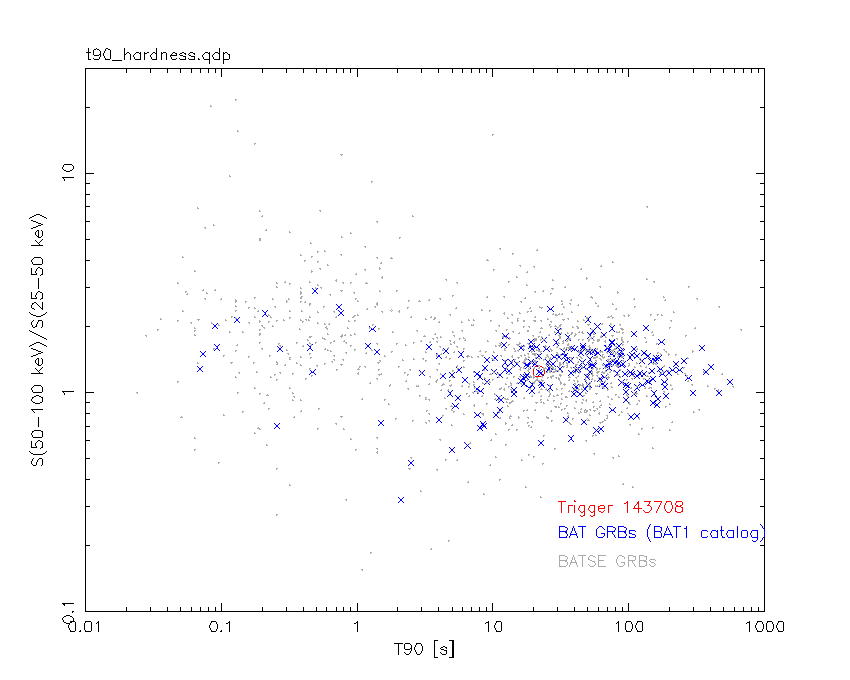
T90                                   = 21.6960000097752 sec.
Hardness ratio (energy fluence ratio) = 1.2459
Color vs. Color plot
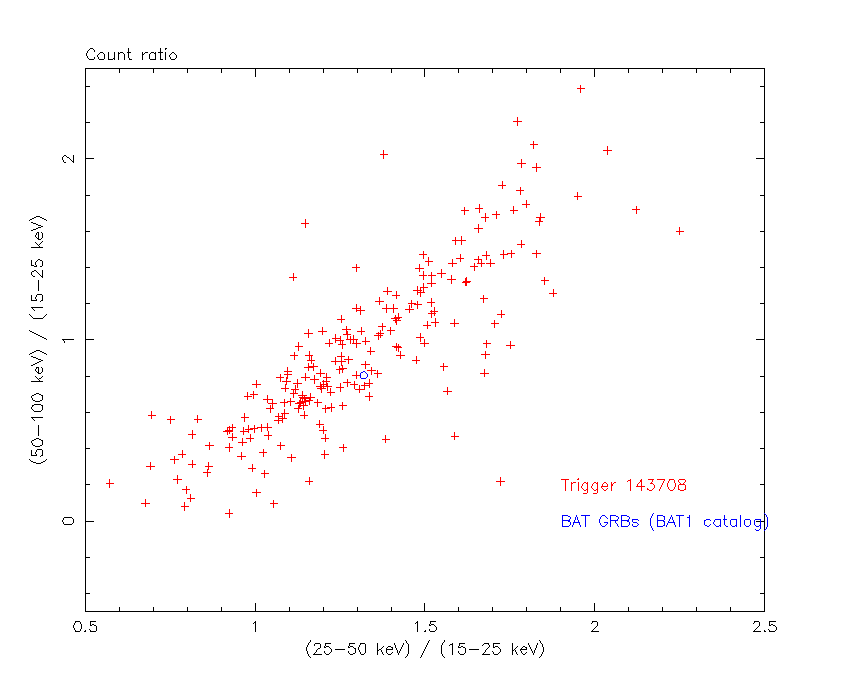
Count Ratio  (25-50 keV) / (15-25 keV) = 1.31942
Count Ratio (50-100 keV) / (15-25 keV) = 0.805355
Mask shadow pattern
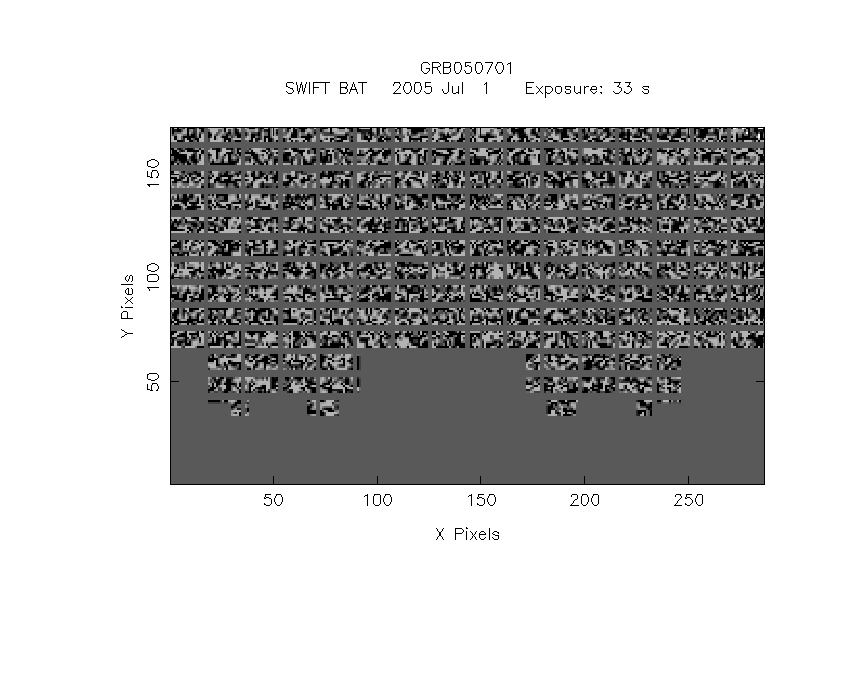
IMX = 4.847090538993031E-02, IMY = -3.503441877668790E-01
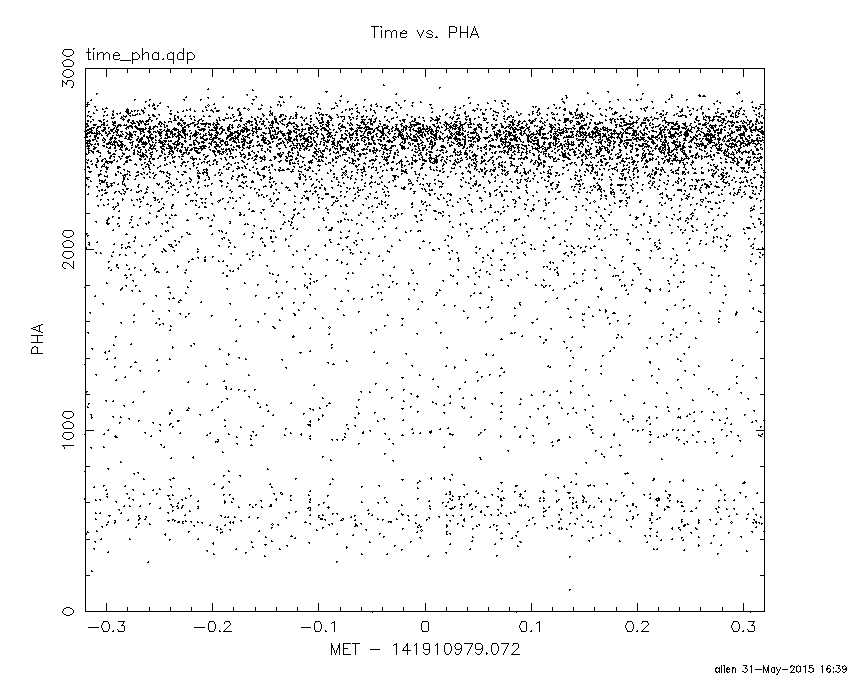
TIME vs. PHA plot around the trigger time
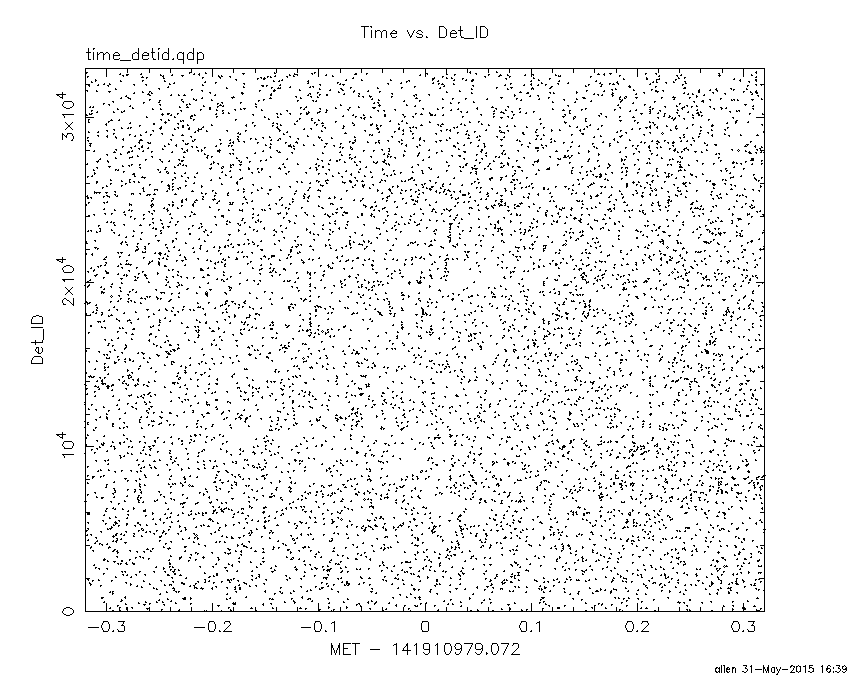
TIME vs. DetID plot around the trigger time
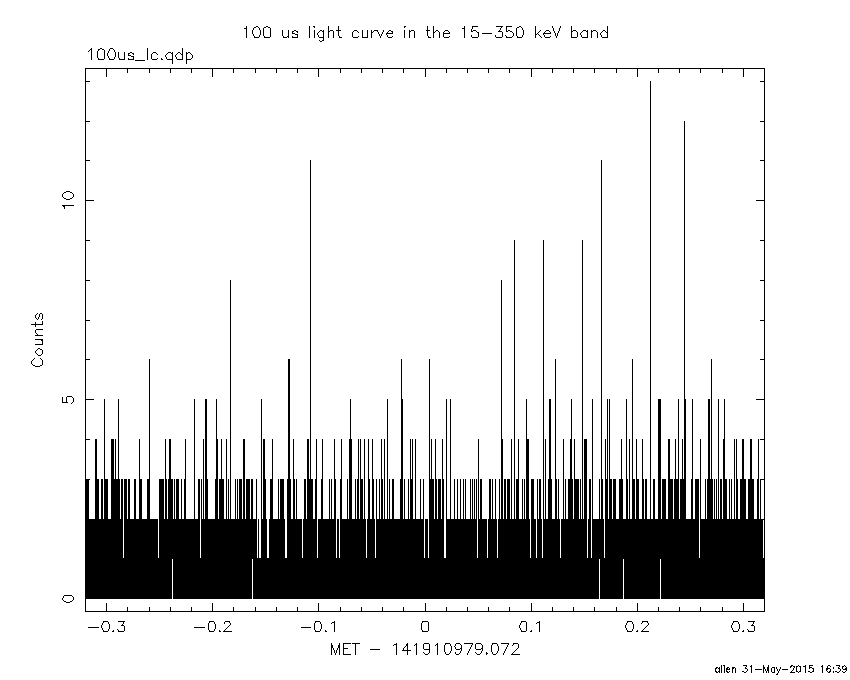
100 us light curve (15-350 keV)
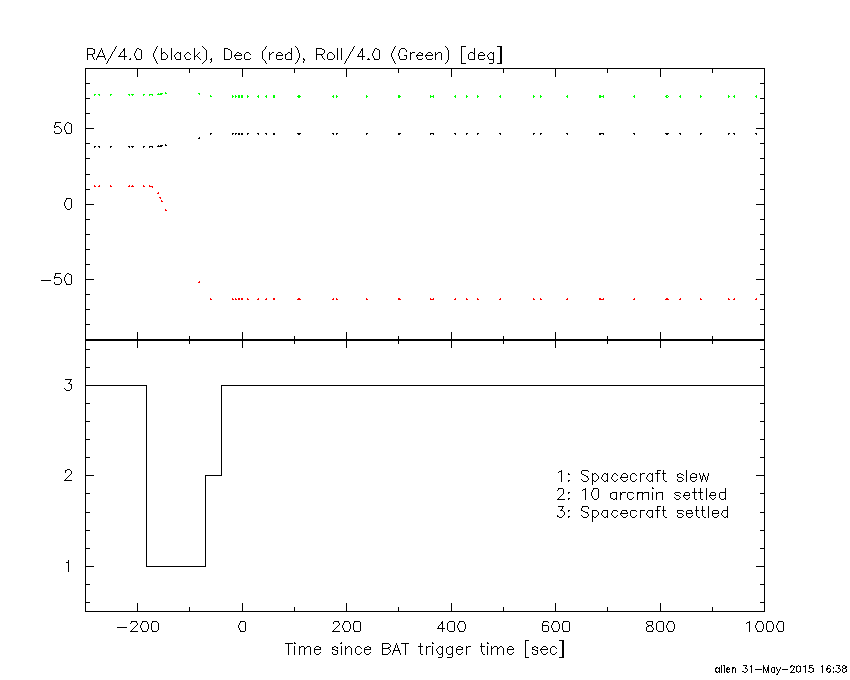
Spacecraft aspect plot
Bright source in the pre-burst/pre-slew/post-slew images
Pre-burst image of 15-350 keV band
Time interval of the image:
-10.072000 -4.732000

# RAcent  DECcent POSerr Theta    Phi  PeakCts   SNR AngSep     Name
#  [deg]    [deg]    ['] [deg]  [deg]                   [']
135.6411 -40.6780   11.6  37.2  -93.1  -0.0500  -1.0    9.0	Vela X-1
170.2044 -60.7621   82.1   8.1  -96.2   0.0026   0.1    9.0	Cen X-3
186.2514 -62.8738    0.0   0.3  -61.6   0.0293   1.7   12.7	GX 301-2
227.2846 -59.4519    1.8  19.5   82.3   0.1483   6.3 ------	UNKNOWN
208.1890 -11.5160    2.5  53.8   10.8   0.3861   4.6 ------	UNKNOWN
Pre-slew background subtracted image of 15-350 keV band
Time interval of the image:
-4.732000 28.408000

# RAcent  DECcent POSerr Theta    Phi  PeakCts   SNR AngSep     Name
#  [deg]    [deg]    ['] [deg]  [deg]                   [']
135.7644 -40.6168    0.0  37.2  -92.9   0.2718   0.8   11.4	Vela X-1
170.7263 -60.5729   22.5   8.0  -94.2   0.0617   0.5   12.5	Cen X-3
186.2514 -62.8738    0.0   0.3  -61.6  -0.2432  -2.2   12.7	GX 301-2
227.2447 -59.4002    1.1  19.5   82.1   1.5747  10.3 ------	UNKNOWN
 82.1541 -68.6268    2.4  37.9 -160.5   0.8296   4.9 ------	UNKNOWN
Post-slew image of 15-350 keV band
Time interval of the image:
-10.072000 32.998000

# RAcent  DECcent POSerr Theta    Phi  PeakCts   SNR AngSep     Name
#  [deg]    [deg]    ['] [deg]  [deg]                   [']
135.5428 -40.6387    6.7  37.3  -93.2  -0.3250  -1.7    5.1	Vela X-1
170.6544 -60.5710    5.0   8.0  -94.3   0.1479   2.3   10.5	Cen X-3
186.4304 -62.5853    0.0   0.5  -32.0   0.0222   0.3   12.7	GX 301-2
356.2718 -66.4253    2.1  50.3  159.1   1.1453   5.4 ------	UNKNOWN
227.2623 -59.4255    0.3  19.5   82.2   2.7438  35.3 ------	UNKNOWN
 50.9465 -52.8983    3.4  59.0 -166.1   1.3023   3.4 ------	UNKNOWN
106.8834 -57.6921    2.9  37.2 -135.1   0.3700   4.0 ------	UNKNOWN
129.4186 -39.2781    3.8  41.1  -98.0   0.8555   3.0 ------	UNKNOWN
Plot creation:
Sun May 31 16:39:50 EDT 2015