Estimated redshift from machine learning (Ukwatta et al. 2016) - may take a few minutes to calcaulte
Image
Pre-slew 15-350 keV image (Event data; bkg subtracted)

#   RAcent  DECcent POSerr  Theta    Phi     Peak Cts     SNR  Name
  357.3805  +9.0007 0.0459   53.2 -166.3       0.1311     4.2  TRIG_01439093
------------------------------------------

Foreground time interval of the image:
  0.000   1.024 (delta_t =   1.024 [sec])
Background time interval of the image:
-60.584  -3.584 (delta_t =  57.000 [sec])
Lightcurves
Notes:
- 1) All plots contain as much data as has been downloaded to date.
- 2) The mask-weighted light curves are using the flight position.
- 3) Multiple plots of different time binning/intervals are shown to cover all scenarios of short/long GRBs, rate/image triggers, and real/false positives.
- 4) For all the mask-weighted lightcurves, the y-axis units are counts/sec/det where a det is 0.4 x 0.4 = 0.16 sq cm.
- 5) The verticle lines correspond to following: green dotted lines are T50 interval, black dotted lines are T90 interval, blue solid line(s) is a spacecraft slew start time, and orange solid line(s) is a spacecraft slew end time.
- 6) Time of each bin is in the middle of the bin.
1 s binning
From T0-310 s to T0+310 s

From T100_start - 20 s to T100_end + 30 s

Full time interval

64 ms binning
Full time interval

From T100_start to T100_end

From T0-5 sec to T0+5 sec

16 ms binning
From T100_start-5 s to T100_start+5 s

8 ms binning
From T100_start-3 s to T100_start+3 s

2 ms binning
From T100_start-1 s to T100_start+1 s

SN=5 or 10 sec. binning (whichever binning is satisfied first)

SN=5 or 10 sec. binning (T < 200 sec)

Spectra
Notes:
- 1) The fitting includes the systematic errors.
- 2) For long bursts, a spectral fit of the pre-slew DRM will introduce some errors in both a spectral shape and a normalization if the PHA file contains a lot of the slew/post-slew time interval.
- 3) For fits to more complicated models (e.g. a power-law over a cutoff power-law), the BAT team has decided to require a chi-square improvement of more than 6 for each extra dof.
- 4) For short bursts (T90<1sec), the specrtum is also fit with Blackbody, OTTB, and Double Blackbody.
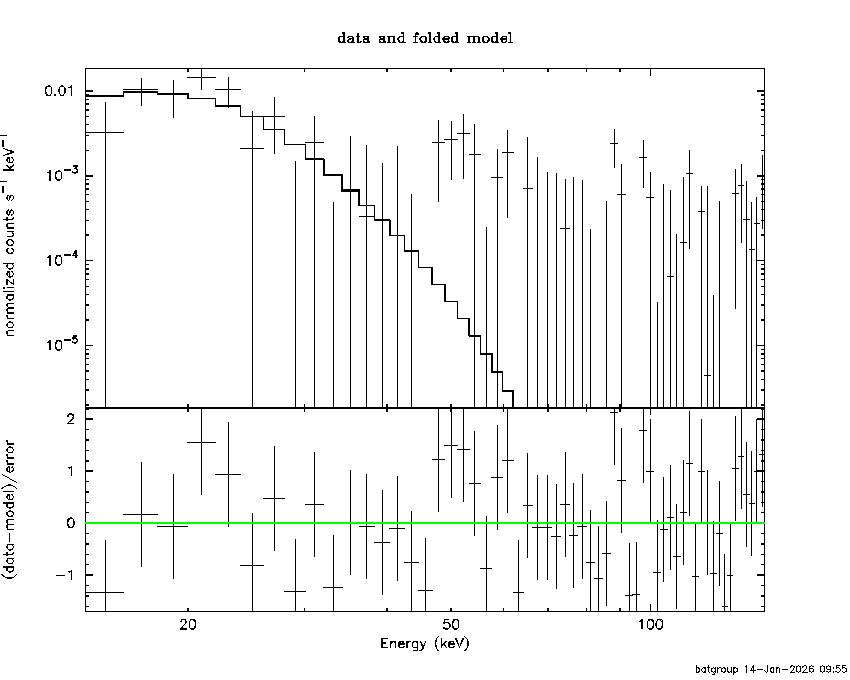
Time averaged spectrum fit using the pre-slew DRM
Power-law model

Time interval is from    0.000 sec. to    1.024 sec.

Spectral model in power-law:
------------------------------------------------------------
Parameters  : value       lower 90%   higher 90%
Photon index: 3.70875     ( -0.892731   1.21208 )
Norm@50keV  : 3.16750E-03    ( -0.00317026   0.00363124 )
------------------------------------------------------------
#Fit statistic : Chi-Squared =          56.88 using 59 PHA bins.
# Reduced chi-squared =         0.9979 for     57 degrees of freedom
# Null hypothesis probability =   4.794675e-01

Photon flux (15-150 keV)    in 1.024 sec: 1.52208 ( -0.508969  0.512729 ) ph/cm2/s
Energy fluence (15-150 keV)             : 5.83327e-08 ( -2.22913e-08  2.56702e-08 ) ergs/cm2
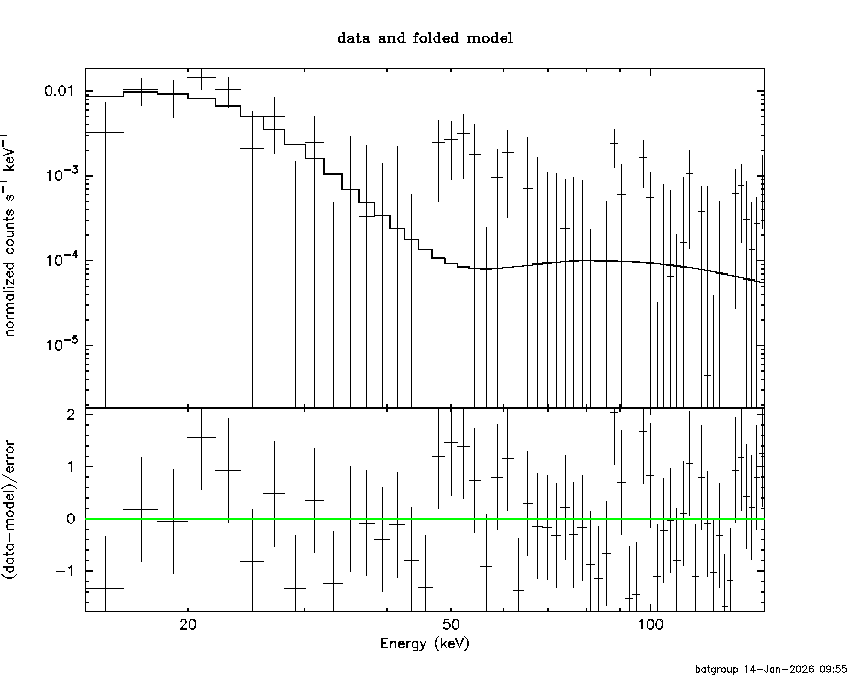
Cutoff power-law model

Time interval is from    0.000 sec. to    1.024 sec.
Spectral model in the cutoff power-law:
------------------------------------------------------------
Parameters  : value       lower 90%   higher 90%
Photon index: 1.00000     (     )
Epeak [keV] : 50.0000      (   )
Norm@50keV  : 2.11497E-02    (     )
------------------------------------------------------------
#Fit statistic : Chi-Squared =          70.48 using 59 PHA bins.
# Reduced chi-squared =          1.259 for     56 degrees of freedom
# Null hypothesis probability =   9.226363e-02

Photon flux (15-150 keV)    in 1.024 sec: 1.60734 1.60828 (    ) ph/cm2/s
Energy fluence (15-150 keV)             : 2.70201e-15 ( 0  0 ) ergs/cm2
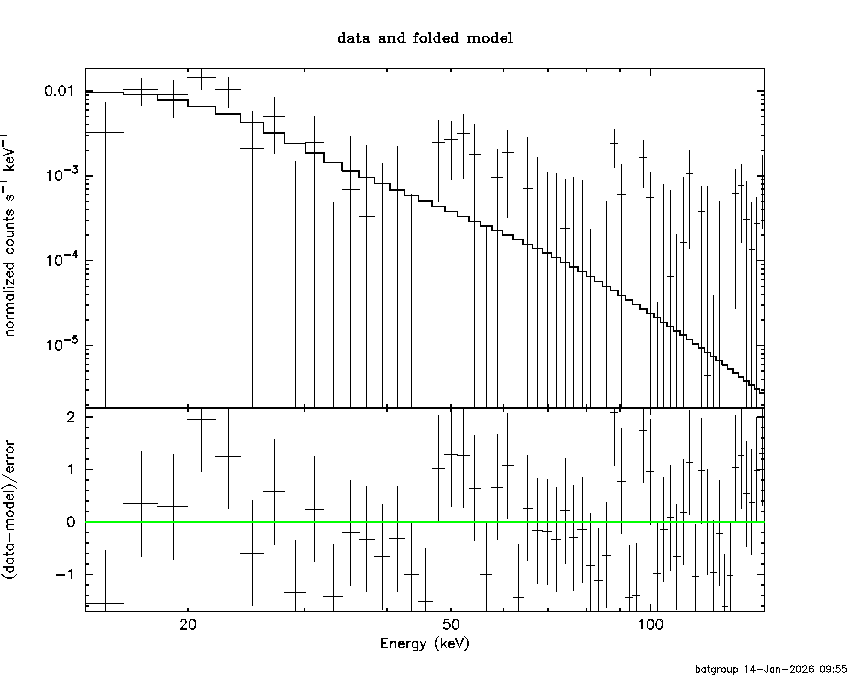
Band function

Time interval is from    0.000 sec. to    1.024 sec.

Spectral model in the Band function:
------------------------------------------------------------
Parameters  : value       lower 90%   higher 90%
alpha       : 4.38550   ( 1.58134   1.58134 )
beta        : -8.80399    ( 6.52911   15.3054 )
Epeak [keV] : 16.9839      ( -3.39441 4.27781 )
Norm@50keV   : 1.32594E+04    ( -13221.5   225730 )
------------------------------------------------------------
#Fit statistic : Chi-Squared =          52.55 using 59 PHA bins.
# Reduced chi-squared =         0.9555 for     55 degrees of freedom
# Null hypothesis probability =   5.687445e-01

Photon flux (15-150 keV)    in 1.024 sec:  (    ) ph/cm2/s
Energy fluence (15-150 keV)             : 0 ( 0  0 ) ergs/cm2
Single BB

Spectral model blackbody:
------------------------------------------------------------
Parameters  : value    Lower 90%  Upper 90%
kT [keV]    : 3.79267  (-0.838909  1.0949)
R^2/D10^2   : 56.1988  (-56.163   172.438)
(R is the radius in km and D10 is the distance to the source in units of 10 kpc)
------------------------------------------------------------
#Fit statistic : Chi-Squared =          53.69 using 59 PHA bins.
# Reduced chi-squared =         0.9420 for     57 degrees of freedom
# Null hypothesis probability =   5.998775e-01

Energy  Fluence     90% Error
[keV]   [erg/cm2]   [erg/cm2]
15- 25  4.020e-08   2.446e-08
25- 50  1.244e-08   7.869e-09
50-150  1.086e-10   1.104e-10
15-150  5.275e-08   3.190e-08
Thermal bremsstrahlung (OTTB)

XSPEC12>exit
 XSPEC: quit


Spectral model: thermal bremsstrahlung
------------------------------------------------------------
Parameters  : value         Lower 90%    Upper 90%
kT [keV]    : 9.26449       (-3.58371      7.95852)
Norm        : 62.7317       (-62.6817     142.892)
------------------------------------------------------------
 Reduced chi-squared =

Energy  Fluence     90% Error
[keV]   [erg/cm2]   [erg/cm2]
15- 25  3.757e-08   2.248e-08
25- 50  1.455e-08   1.035e-08
50-150  8.055e-10   8.637e-10
15-150  5.293e-08   3.243e-08
Double BB

XSPEC12>exit
 XSPEC: quit


Spectral model: bbodyrad<1> + bbodyrad<2>
------------------------------------------------------------
Parameters  : value         Lower 90%    Upper 90%
kT1 [keV]   : 3.79118        (-0.866919      1.047)
R1^2/D10^2  : 56.0934        (-41.3374      158.513)
kT2 [keV]   : 199.363        (-199.363      -199.363)
R2^2/D10^2  : 3.86579E-05    (-3.8711e-05   0.00279047)
------------------------------------------------------------
 Reduced chi-squared =

Energy  Fluence     90% Error
[keV]   [erg/cm2]   [erg/cm2]
15- 25  4.006e-08   2.385e-08
25- 50  1.260e-08   8.397e-09
50-150  5.037e-09   1.405e-10
15-150  5.770e-08   3.215e-08
Peak spectrum fit
Power-law model

Time interval is from    0.000 sec. to    1.024 sec.

Spectral model in power-law:
------------------------------------------------------------
Parameters  : value       lower 90%   higher 90%
Photon index: 3.70875     ( -0.892731   1.21208 )
Norm@50keV  : 3.16750E-03    ( -0.00317026   0.00363124 )
------------------------------------------------------------
#Fit statistic : Chi-Squared =          56.88 using 59 PHA bins.
# Reduced chi-squared =         0.9979 for     57 degrees of freedom
# Null hypothesis probability =   4.794675e-01

Photon flux (15-150 keV)    in 1.024 sec: 1.52208 ( -0.508969  0.512729 ) ph/cm2/s
Energy fluence (15-150 keV)             : 5.83327e-08 ( -2.22913e-08  2.56702e-08 ) ergs/cm2
Cutoff power-law model

Time interval is from    0.000 sec. to    1.024 sec.
Spectral model in the cutoff power-law:
------------------------------------------------------------
Parameters  : value       lower 90%   higher 90%
Photon index: 1.00000     (     )
Epeak [keV] : 50.0000      (   )
Norm@50keV  : 2.11497E-02    (     )
------------------------------------------------------------
#Fit statistic : Chi-Squared =          70.48 using 59 PHA bins.
# Reduced chi-squared =          1.259 for     56 degrees of freedom
# Null hypothesis probability =   9.226363e-02

Photon flux (15-150 keV)    in 1.024 sec: 1.60734 1.60828 (    ) ph/cm2/s
Energy fluence (15-150 keV)             : 2.70201e-15 ( 0  0 ) ergs/cm2
Band function

Time interval is from    0.000 sec. to    1.024 sec.

Spectral model in the Band function:
------------------------------------------------------------
Parameters  : value       lower 90%   higher 90%
alpha       : 4.38550   ( 1.58134   1.58134 )
beta        : -8.80399    ( 6.52911   15.3054 )
Epeak [keV] : 16.9839      ( -3.39441 4.27781 )
Norm@50keV   : 1.32594E+04    ( -13221.5   225730 )
------------------------------------------------------------
#Fit statistic : Chi-Squared =          52.55 using 59 PHA bins.
# Reduced chi-squared =         0.9555 for     55 degrees of freedom
# Null hypothesis probability =   5.687445e-01

Photon flux (15-150 keV)    in 1.024 sec:  (    ) ph/cm2/s
Energy fluence (15-150 keV)             : 0 ( 0  0 ) ergs/cm2
Single BB
 XSPEC: quit


Spectral model blackbody:
------------------------------------------------------------
Parameters  : value    Lower 90%  Upper 90%
kT [keV]    : 3.79267  (-0.838909  1.0949)
R^2/D10^2   : 56.1988  (-56.163   172.438)
(R is the radius in km and D10 is the distance to the source in units of 10 kpc)
------------------------------------------------------------
 Reduced chi-squared =

Energy  Fluence     90% Error
[keV]   [erg/cm2]   [erg/cm2]
15- 25  4.020e-08   2.407e-08
25- 50  1.244e-08   8.049e-09
50-150  1.086e-10   1.175e-10
15-150  5.275e-08   3.211e-08
Thermal bremsstrahlung (OTTB)

XSPEC12>exit
 XSPEC: quit


Spectral model: thermal bremsstrahlung
------------------------------------------------------------
Parameters  : value         Lower 90%    Upper 90%
kT [keV]    : 9.26449       (-3.58371      7.95852)
Norm        : 62.7317       (-62.6817     142.892)
------------------------------------------------------------
 Reduced chi-squared =

Energy  Fluence     90% Error
[keV]   [erg/cm2]   [erg/cm2]
15- 25  3.757e-08   2.187e-08
25- 50  1.455e-08   9.708e-09
50-150  8.055e-10   8.428e-10
15-150  5.293e-08   3.242e-08
Double BB
XSPEC12>exit
 XSPEC: quit


Spectral model: bbodyrad<1> + bbodyrad<2>
------------------------------------------------------------
Parameters  : value         Lower 90%    Upper 90%
kT1 [keV]   : 3.79118        (-0.866919      1.047)
R1^2/D10^2  : 56.0934        (-41.3374      158.531)
kT2 [keV]   : 199.363        (-199.363      -199.363)
R2^2/D10^2  : 3.86579E-05    (-3.8711e-05   0.00303669)
------------------------------------------------------------
 Reduced chi-squared =

Energy  Fluence     90% Error
[keV]   [erg/cm2]   [erg/cm2]
15- 25  4.006e-08   2.359e-08
25- 50  1.260e-08   8.499e-09
50-150  5.037e-09   1.424e-10
15-150  5.770e-08   3.076e-08
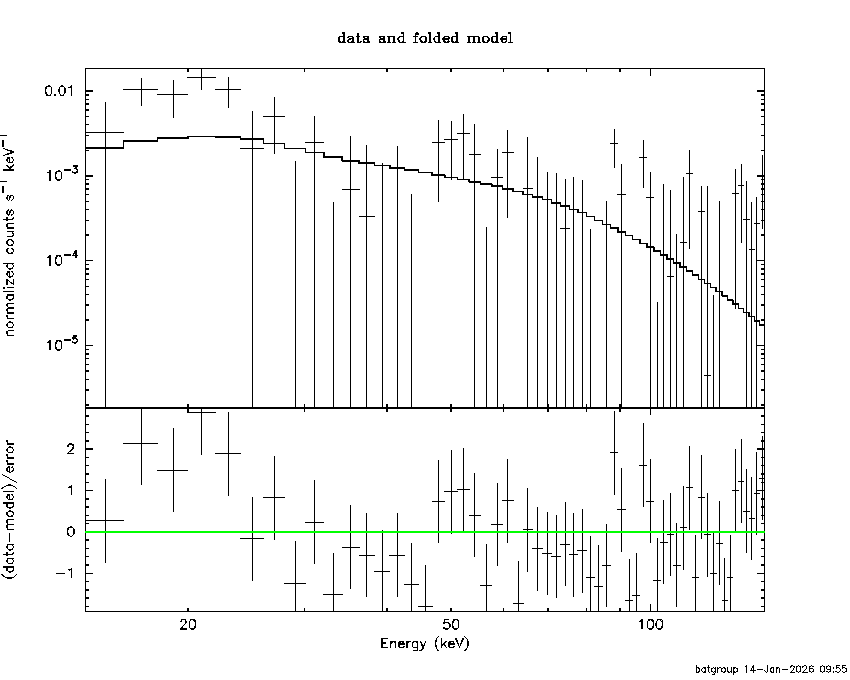
Pre-slew spectrum (Pre-slew PHA with pre-slew DRM)
Power-law model
Spectral model in power-law:
------------------------------------------------------------
Parameters  : value       lower 90%   higher 90%
Photon index: 3.70875     ( -0.892731   1.21208 )
Norm@50keV  : 3.16750E-03    ( -0.00317026   0.00363124 )
------------------------------------------------------------
#Fit statistic : Chi-Squared =          56.88 using 59 PHA bins.
# Reduced chi-squared =         0.9979 for     57 degrees of freedom
# Null hypothesis probability =   4.794675e-01

Photon flux (15-150 keV)    in 1.024 sec: 1.52208 ( -0.508969  0.512729 ) ph/cm2/s
Energy fluence (15-150 keV)             : 5.83327e-08 ( -2.22913e-08  2.56702e-08 ) ergs/cm2
Cutoff power-law model
Spectral model in the cutoff power-law:
------------------------------------------------------------
Parameters  : value       lower 90%   higher 90%
Photon index: 1.00000     (     )
Epeak [keV] : 50.0000      (   )
Norm@50keV  : 2.11497E-02    (     )
------------------------------------------------------------
#Fit statistic : Chi-Squared =          70.48 using 59 PHA bins.
# Reduced chi-squared =          1.259 for     56 degrees of freedom
# Null hypothesis probability =   9.226363e-02

Photon flux (15-150 keV)    in 1.024 sec: 1.60734 1.60828 (    ) ph/cm2/s
Energy fluence (15-150 keV)             : 2.70201e-15 ( 0  0 ) ergs/cm2
Band function

Spectral model in the Band function:
------------------------------------------------------------
Parameters  : value       lower 90%   higher 90%
alpha       : 4.38550   ( 1.58134   1.58134 )
beta        : -8.80399    ( 6.52911   15.3054 )
Epeak [keV] : 16.9839      ( -3.39441 4.27781 )
Norm@50keV   : 1.32594E+04    ( -13221.5   225730 )
------------------------------------------------------------
#Fit statistic : Chi-Squared =          52.55 using 59 PHA bins.
# Reduced chi-squared =         0.9555 for     55 degrees of freedom
# Null hypothesis probability =   5.687445e-01

Photon flux (15-150 keV)    in 1.024 sec:  (    ) ph/cm2/s
Energy fluence (15-150 keV)             : 0 ( 0  0 ) ergs/cm2
S(25-50 keV) vs. S(50-100 keV) plot

S(25-50 keV)  = 1.73e-08
S(50-100 keV) = 5.28e-09
T90 vs. Hardness ratio plot

T90                                   = 1.02400004863739 sec.
Hardness ratio (energy fluence ratio) = 0.305202
Color vs. Color plot

Count Ratio  (25-50 keV) / (15-25 keV) = 0.10208
Count Ratio (50-100 keV) / (15-25 keV) = 0.120085
Mask shadow pattern

IMX = -1.298080530371251E+00, IMY = 3.158210712614559E-01
TIME vs. PHA plot around the trigger time

TIME vs. DetID plot around the trigger time

100 us light curve (15-350 keV)

Spacecraft aspect plot

Bright source in the pre-burst/pre-slew/post-slew images
Pre-burst image of 15-350 keV band
Time interval of the image:
-60.584000 -3.584000

# RAcent  DECcent POSerr Theta    Phi  PeakCts   SNR AngSep     Name
#  [deg]    [deg]    ['] [deg]  [deg]                   [']
254.4658  35.2239    9.7  42.9   -0.5  -0.2120  -1.2    7.1	Her X-1
288.9017  11.0281   19.7  35.8  -64.0   0.1191   0.6    7.8	GRS 1915+105
299.5966  35.1932    1.0  10.3  -47.6   1.2252  11.5    0.6	Cyg X-1
308.1181  40.9663    5.3   1.5  -48.2   0.2320   2.2    0.9	Cyg X-3
326.0602  38.5121    0.0  12.9  179.2  -0.0281  -0.2   12.6	Cyg X-2
Pre-slew background subtracted image of 15-350 keV band
Time interval of the image:
0.000000 1.024000

# RAcent  DECcent POSerr Theta    Phi  PeakCts   SNR AngSep     Name
#  [deg]    [deg]    ['] [deg]  [deg]                   [']
254.3476  35.2443    4.7  43.0   -0.4  -0.0473  -2.5    8.0	Her X-1
288.6704  10.9167    4.7  36.0  -63.7   0.0513   2.5    7.7	GRS 1915+105
299.6337  35.0494  109.8  10.4  -48.3  -0.0012  -0.1    9.4	Cyg X-1
308.1103  40.9525   14.0   1.5  -48.5  -0.0087  -0.8    0.0	Cyg X-3
326.4174  38.4035    0.0  13.2  179.2  -0.0092  -0.8   12.6	Cyg X-2
264.7256   7.2369    2.2  52.6  -38.6   0.3017   5.1 ------	UNKNOWN
Post-slew image of 15-350 keV band
Time interval of the image:
119.116600 242.506000

# RAcent  DECcent POSerr Theta    Phi  PeakCts   SNR AngSep     Name
#  [deg]    [deg]    ['] [deg]  [deg]                   [']
308.1761  41.0422    5.7  53.8  -17.3  -1.0533  -2.0    6.1	Cyg X-3
326.2635  38.4175    8.2  40.5  -10.8   0.3697   1.4    7.2	Cyg X-2
 12.4927 -36.8208    2.6  48.0 -168.6   1.6322   4.5 ------	UNKNOWN
  8.4626 -47.0178    2.4  56.9 -161.3   4.2951   4.8 ------	UNKNOWN
310.7194  27.5157    2.3  47.6  -33.1   2.1077   5.1 ------	UNKNOWN
Plot creation:
Wed Jan 14 09:56:20 EST 2026