Special notes of this burst
Image
Pre-slew 15.0-350.0 keV image (Event data)

#   RAcent    DECcent   POSerr    Theta     Phi              Peak Cts       SNR   Name
  169.6858   -15.5447   0.0226    46.3730  -171.4621         1.0907411      8.436 TRIG_00145994

Foreground time interval of the image:
 13.492  68.248 (delta_t =  54.756 [sec])
Background time interval of the image:
-159.299 -83.000 (delta_t =  76.300 [sec])
-82.000  13.492 (delta_t =  95.492 [sec])
Lightcurves
Notes:
- 1) The mask-weighted light curves are using the flight position.
- 2) Multiple plots of different time binning/intervals are shown to cover all scenarios of short/long GRBs, rate/image triggers, and real/false positives.
- 3) For all the mask-weighted lightcurves, the y-axis units are counts/sec/det where a det is 0.4 x 0.4 = 0.16 sq cm.
- 4) The verticle lines correspond to following: green dotted lines are T50 interval, black dotted lines are T90 interval, blue solid line(s) is a spacecraft slew start time, and orange solid line(s) is a spacecraft slew end time.
- 5) Time of each bin is in the middle of the bin.
1 s binning
From T0-310 s to T0+310 s
From T100_start - 20 s to T100_end + 30 s

Full time interval

64 ms binning
Full time interval
From T100_start to T100_end

From T0-5 sec to T0+5 sec
16 ms binning
From T100_start-5 s to T100_start+5 s

Blue+Cyan dotted lines: Time interval of the scaled map
From 0.000000 to 64.000000
8 ms binning
From T100_start-3 s to T100_start+3 s

Blue+Cyan dotted lines: Time interval of the scaled map
From 0.000000 to 64.000000
2 ms binning
From T100_start-1 s to T100_start+1 s
Blue+Cyan dotted lines: Time interval of the scaled map
From 0.000000 to 64.000000
SN=5 or 10 sec. binning (whichever binning is satisfied first)
SN=5 or 10 sec. binning (T < 200 sec)
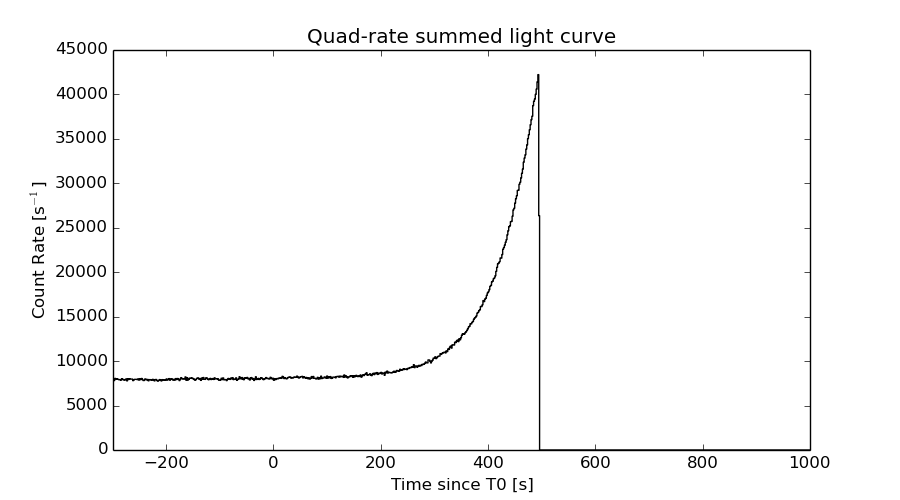
Quad-rate summed light curves (from T0-300s to T0+1000s)
Spectral Evolution

Spectra
Notes:
- 1) The fitting includes the systematic errors.
- 2) When the burst includes telescope slew time periods, the fitting uses an average response file made from multiple 5-s response files through out the slew time plus single time preiod for the non-slew times, and weighted by the total counts in the corresponding time period using addrmf. An average response file is needed becuase a spectral fit using the pre-slew DRM will introduce some errors in both a spectral shape and a normalization if the PHA file contains a lot of the slew/post-slew time interval.
- 3) For fits to more complicated models (e.g. a power-law over a cutoff power-law), the BAT team has decided to require a chi-square improvement of more than 6 for each extra dof.
Time averaged spectrum fit using the average DRM
Power-law model

Time interval is from   13.492 sec. to   68.248 sec.

Spectral model in power-law:
------------------------------------------------------------
Parameters  : value       lower 90%   higher 90%
Photon index: 2.39618     ( -0.261876   0.290435 )
Norm@50keV  : 1.18008E-03    ( -0.000253678   0.000251516 )
------------------------------------------------------------
#Fit statistic : Chi-Squared =          59.86 using 59 PHA bins.
# Reduced chi-squared =          1.050 for     57 degrees of freedom
# Null hypothesis probability =   3.722271e-01

Photon flux (15-150 keV)    in 54.76 sec: 0.217856 ( -0.0311277  0.0311277 ) ph/cm2/s
Energy fluence (15-150 keV)             : 6.29756e-07 ( -1.07095e-07  1.11098e-07 ) ergs/cm2
Cutoff power-law model

Time interval is from   13.492 sec. to   68.248 sec.
Spectral model in the cutoff power-law:
------------------------------------------------------------
Parameters  : value       lower 90%   higher 90%
Photon index: -2.72899E-02     ( -2.01284   1.48911 )
Epeak [keV] : 30.1552      ( -6.10122 6.13116 )
Norm@50keV  : 3.91151E-02    ( -0.0402669   0.76658 )
------------------------------------------------------------
#Fit statistic : Chi-Squared =          50.75 using 59 PHA bins.
# Reduced chi-squared =         0.9063 for     56 degrees of freedom
# Null hypothesis probability =   6.732335e-01

Photon flux (15-150 keV)    in 54.76 sec: 0.208863 ( -0.030757  0.030934 ) ph/cm2/s
Energy fluence (15-150 keV)             : 5.50272e-07 ( -9.18123e-08  1.02494e-07 ) ergs/cm2
Band function

Time interval is from   13.492 sec. to   68.248 sec.

Spectral model in the Band function:
------------------------------------------------------------
Parameters  : value       lower 90%   higher 90%
alpha       : -5.82674E-02   ( -1.38805   2.12286 )
beta        : -9.37167    ( 9.37167   19.3705 )
Epeak [keV] : 30.2831      ( -5.47734 6.04733 )
Norm@50keV   : 3.39434E-02    ( -0.0339729   6.9897 )
------------------------------------------------------------
#Fit statistic : Chi-Squared =          50.77 using 59 PHA bins.
# Reduced chi-squared =         0.9231 for     55 degrees of freedom
# Null hypothesis probability =   6.369030e-01

Photon flux (15-150 keV)    in 54.76 sec:  (    ) ph/cm2/s
Energy fluence (15-150 keV)             : 0 ( 0  0 ) ergs/cm2
Single BB

Spectral model blackbody:
------------------------------------------------------------
Parameters  : value    Lower 90%  Upper 90%
kT [keV]    : 8.12895  (-1.11525  1.25491)
R^2/D10^2   : 0.235353  (-0.104144   0.19336)
(R is the radius in km and D10 is the distance to the source in units of 10 kpc)
------------------------------------------------------------
#Fit statistic : Chi-Squared =          52.62 using 59 PHA bins.
# Reduced chi-squared =         0.9231 for     57 degrees of freedom
# Null hypothesis probability =   6.400416e-01

Energy  Fluence     90% Error
[keV]   [erg/cm2]   [erg/cm2]
15- 25  1.558e-07   3.863e-08
25- 50  2.803e-07   5.399e-08
50-150  7.756e-08   3.188e-08
15-150  5.137e-07   9.709e-08
Thermal bremsstrahlung (OTTB)

Spectral model: thermal bremsstrahlung
------------------------------------------------------------
Parameters  : value         Lower 90%    Upper 90%
kT [keV]    : 35.5534       (-9.45311      14.2251)
Norm        : 1.56697       (-0.369703     0.503835)
------------------------------------------------------------
#Fit statistic : Chi-Squared =          53.03 using 59 PHA bins.
# Reduced chi-squared =         0.9303 for     57 degrees of freedom
# Null hypothesis probability =   6.248813e-01

Energy  Fluence     90% Error
[keV]   [erg/cm2]   [erg/cm2]
15- 25  1.887e-07   3.376e-08
25- 50  2.353e-07   4.712e-08
50-150  1.592e-07   7.319e-08
15-150  5.831e-07   1.246e-07
Double BB

Spectral model: bbodyrad<1> + bbodyrad<2>
------------------------------------------------------------
Parameters  : value         Lower 90%    Upper 90%
kT1 [keV]   : 4.38649        (-4.37823      41.5297)
R1^2/D10^2  : 1.14003        (-1.14372      -1.14372)
kT2 [keV]   : 10.0037        (-10.0001      -10.0001)
R2^2/D10^2  : 7.89141E-02    (-0.0791024   0.223345)
------------------------------------------------------------
#Fit statistic : Chi-Squared =          50.39 using 59 PHA bins.
# Reduced chi-squared =         0.9162 for     55 degrees of freedom
# Null hypothesis probability =   6.511402e-01

Energy  Fluence     90% Error
[keV]   [erg/cm2]   [erg/cm2]
15- 25  1.753e-07   9.397e-08
25- 50  2.598e-07   1.397e-07
50-150  1.153e-07   7.335e-08
15-150  5.504e-07   2.806e-07
Peak spectrum fit
Power-law model

Time interval is from   55.168 sec. to   56.168 sec.

Spectral model in power-law:
------------------------------------------------------------
Parameters  : value       lower 90%   higher 90%
Photon index: 2.01151     ( -0.720297   0.904169 )
Norm@50keV  : 3.66710E-03    ( -0.0036671   0.00178842 )
------------------------------------------------------------
#Fit statistic : Chi-Squared =          57.33 using 59 PHA bins.
# Reduced chi-squared =          1.006 for     57 degrees of freedom
# Null hypothesis probability =   4.629935e-01

Photon flux (15-150 keV)    in 1 sec: 0.552998 ( -0.219589  0.219697 ) ph/cm2/s
Energy fluence (15-150 keV)             : 3.38389e-08 ( -1.55874e-08  1.6667e-08 ) ergs/cm2
Cutoff power-law model

Time interval is from   55.168 sec. to   56.168 sec.
Spectral model in the cutoff power-law:
------------------------------------------------------------
Parameters  : value       lower 90%   higher 90%
Photon index: 1.87009     ( -1.885   0.217032 )
Epeak [keV] : 38.8236      (   )
Norm@50keV  : 4.42248E-03    (     )
------------------------------------------------------------
#Fit statistic : Chi-Squared =          57.31 using 59 PHA bins.
# Reduced chi-squared =          1.023 for     56 degrees of freedom
# Null hypothesis probability =   4.261630e-01

Photon flux (15-150 keV)    in 1 sec: 0.551054 ( -0.219184  0.22096 ) ph/cm2/s
Energy fluence (15-150 keV)             : 3.3456e-08 ( -3.3456e-08  1.69822e-08 ) ergs/cm2
Band function

Time interval is from   55.168 sec. to   56.168 sec.

Spectral model in the Band function:
------------------------------------------------------------
Parameters  : value       lower 90%   higher 90%
alpha       : 3.96348   ( -5.8265   -3.98557 )
beta        : -2.12951    ( 2.3997   1.07509 )
Epeak [keV] : 21.2211      ( -21.0239 115.065 )
Norm@50keV   : 258.607    ( -286.166   640.663 )
------------------------------------------------------------
#Fit statistic : Chi-Squared =          57.05 using 59 PHA bins.
# Reduced chi-squared =          1.037 for     55 degrees of freedom
# Null hypothesis probability =   3.989399e-01

Photon flux (15-150 keV)    in 1 sec: 0.550343 (    ) ph/cm2/s
Energy fluence (15-150 keV)             : 0 ( 0  0 ) ergs/cm2
Single BB

Spectral model blackbody:
------------------------------------------------------------
Parameters  : value    Lower 90%  Upper 90%
kT [keV]    : 7.34888  (-2.59362  7.08793)
R^2/D10^2   : 0.841480  (-0.841401   4.24994)
(R is the radius in km and D10 is the distance to the source in units of 10 kpc)
------------------------------------------------------------
#Fit statistic : Chi-Squared =          59.00 using 59 PHA bins.
# Reduced chi-squared =          1.035 for     57 degrees of freedom
# Null hypothesis probability =   4.022108e-01

Energy  Fluence     90% Error
[keV]   [erg/cm2]   [erg/cm2]
15- 25  7.657e-09   4.932e-09
25- 50  1.150e-08   7.825e-09
50-150  2.266e-09   2.165e-09
15-150  2.143e-08   1.387e-08
Thermal bremsstrahlung (OTTB)

Spectral model: thermal bremsstrahlung
------------------------------------------------------------
Parameters  : value         Lower 90%    Upper 90%
kT [keV]    : 68.0144       (-68.0095      -68.0095)
Norm        : 2.74664       (-1.34513     3.85129)
------------------------------------------------------------
#Fit statistic : Chi-Squared =          57.47 using 59 PHA bins.
# Reduced chi-squared =          1.008 for     57 degrees of freedom
# Null hypothesis probability =   4.576355e-01

Energy  Fluence     90% Error
[keV]   [erg/cm2]   [erg/cm2]
15- 25  7.024e-09   4.535e-09
25- 50  1.109e-08   7.065e-09
50-150  1.394e-08   1.279e-08
15-150  3.205e-08   2.279e-08
Double BB

Spectral model: bbodyrad<1> + bbodyrad<2>
------------------------------------------------------------
Parameters  : value         Lower 90%    Upper 90%
kT1 [keV]   : 5.86029        (-2.05392      3.71053)
R1^2/D10^2  : 1.72141        (-0.862292      20.6607)
kT2 [keV]   : 27.1497        (-27.7649      -27.7652)
R2^2/D10^2  : 4.20512E-03    (-0.00402863   0.0167474)
------------------------------------------------------------
#Fit statistic : Chi-Squared =          56.04 using 59 PHA bins.
# Reduced chi-squared =          1.019 for     55 degrees of freedom
# Null hypothesis probability =   4.358078e-01

Energy  Fluence     90% Error
[keV]   [erg/cm2]   [erg/cm2]
15- 25  8.102e-09   5.340e-09
25- 50  1.022e-08   5.985e-09
50-150  1.693e-08   1.018e-08
15-150  3.526e-08   1.926e-08
Pre-slew spectrum (Pre-slew PHA with pre-slew DRM)
Power-law model

Spectral model in power-law:
------------------------------------------------------------
Parameters  : value       lower 90%   higher 90%
Photon index: 2.39618     ( -0.261876   0.290435 )
Norm@50keV  : 1.18008E-03    ( -0.000253678   0.000251516 )
------------------------------------------------------------
#Fit statistic : Chi-Squared =          59.86 using 59 PHA bins.
# Reduced chi-squared =          1.050 for     57 degrees of freedom
# Null hypothesis probability =   3.722271e-01

Photon flux (15-150 keV)    in 54.76 sec: 0.217856 ( -0.0311277  0.0311277 ) ph/cm2/s
Energy fluence (15-150 keV)             : 6.29756e-07 ( -1.07095e-07  1.11098e-07 ) ergs/cm2
Cutoff power-law model
Spectral model in the cutoff power-law:
------------------------------------------------------------
Parameters  : value       lower 90%   higher 90%
Photon index: -2.72899E-02     ( -2.01284   1.48911 )
Epeak [keV] : 30.1552      ( -6.10122 6.13116 )
Norm@50keV  : 3.91151E-02    ( -0.0402669   0.76658 )
------------------------------------------------------------
#Fit statistic : Chi-Squared =          50.75 using 59 PHA bins.
# Reduced chi-squared =         0.9063 for     56 degrees of freedom
# Null hypothesis probability =   6.732335e-01

Photon flux (15-150 keV)    in 54.76 sec: 0.208863 ( -0.030757  0.030934 ) ph/cm2/s
Energy fluence (15-150 keV)             : 5.50272e-07 ( -9.18123e-08  1.02494e-07 ) ergs/cm2
Band function

Spectral model in the Band function:
------------------------------------------------------------
Parameters  : value       lower 90%   higher 90%
alpha       : -5.82674E-02   ( -1.38805   2.12286 )
beta        : -9.37167    ( 9.37167   19.3705 )
Epeak [keV] : 30.2831      ( -5.47734 6.04733 )
Norm@50keV   : 3.39434E-02    ( -0.0339729   6.9897 )
------------------------------------------------------------
#Fit statistic : Chi-Squared =          50.77 using 59 PHA bins.
# Reduced chi-squared =         0.9231 for     55 degrees of freedom
# Null hypothesis probability =   6.369030e-01

Photon flux (15-150 keV)    in 54.76 sec:  (    ) ph/cm2/s
Energy fluence (15-150 keV)             : 0 ( 0  0 ) ergs/cm2
S(25-50 keV) vs. S(50-100 keV) plot
S(25-50 keV)  = 2.06e-07
S(50-100 keV) = 1.57e-07
T90 vs. Hardness ratio plot

T90                                   = 49.363999992609 sec.
Hardness ratio (energy fluence ratio) = 0.762136
Color vs. Color plot

Count Ratio  (25-50 keV) / (15-25 keV) = 1.06415
Count Ratio (50-100 keV) / (15-25 keV) = 0.210363
Mask shadow pattern

IMX = -1.037486857582655E+00, IMY = 1.557545036574831E-01
TIME vs. PHA plot around the trigger time

Blue+Cyan dotted lines: Time interval of the scaled map
From 0.000000 to 64.000000
TIME vs. DetID plot around the trigger time

Blue+Cyan dotted lines: Time interval of the scaled map
From 0.000000 to 64.000000
100 us light curve (15-350 keV)
Blue+Cyan dotted lines: Time interval of the scaled map
From 0.000000 to 64.000000
Spacecraft aspect plot

Bright source in the pre-burst/pre-slew/post-slew images
Pre-burst image of 15-350 keV band
Time interval of the image:
-159.299400 -82.999600
-82.000000 13.492000

# RAcent  DECcent POSerr Theta    Phi  PeakCts   SNR AngSep     Name
#  [deg]    [deg]    ['] [deg]  [deg]                   [']
Pre-slew background subtracted image of 15-350 keV band
Time interval of the image:
13.492000 68.248000

# RAcent  DECcent POSerr Theta    Phi  PeakCts   SNR AngSep     Name
#  [deg]    [deg]    ['] [deg]  [deg]                   [']
216.8186  42.4002    2.8  29.0   39.9   0.3602   4.1 ------	UNKNOWN
169.6857 -15.5447    1.4  46.4 -171.5   1.0906   8.4 ------	UNKNOWN
Post-slew image of 15-350 keV band
Time interval of the image:
137.700600 303.047800

# RAcent  DECcent POSerr Theta    Phi  PeakCts   SNR AngSep     Name
#  [deg]    [deg]    ['] [deg]  [deg]                   [']
135.3561 -40.5859   66.9  38.9 -169.9   0.0288   0.2    8.1	Vela X-1
170.2992 -60.7195    5.0  45.2  146.7   0.8953   2.3    5.8	Cen X-3
182.7583 -60.8693    2.9  46.3  138.4   2.0378   4.0 ------	UNKNOWN
202.1198  32.1615    2.2  56.9   -0.1   4.0612   5.2 ------	UNKNOWN
184.2853  35.6777    2.4  53.0  -18.1   1.7173   4.8 ------	UNKNOWN
Plot creation:
Sun May 31 16:34:50 EDT 2015