Special notes of this burst
Image
Pre-slew 15.0-350.0 keV image (Event data)
#   RAcent    DECcent   POSerr    Theta     Phi              Peak Cts       SNR   Name
  155.6423    -0.0268   0.0099    20.7989   -76.4775         2.4420073     19.465 TRIG_00146129

Foreground time interval of the image:
-73.147  54.952 (delta_t = 128.099 [sec])
Background time interval of the image:
Lightcurves
Notes:
- 1) The mask-weighted light curves are using the flight position.
- 2) Multiple plots of different time binning/intervals are shown to cover all scenarios of short/long GRBs, rate/image triggers, and real/false positives.
- 3) For all the mask-weighted lightcurves, the y-axis units are counts/sec/det where a det is 0.4 x 0.4 = 0.16 sq cm.
- 4) The verticle lines correspond to following: green dotted lines are T50 interval, black dotted lines are T90 interval, blue solid line(s) is a spacecraft slew start time, and orange solid line(s) is a spacecraft slew end time.
- 5) Time of each bin is in the middle of the bin.
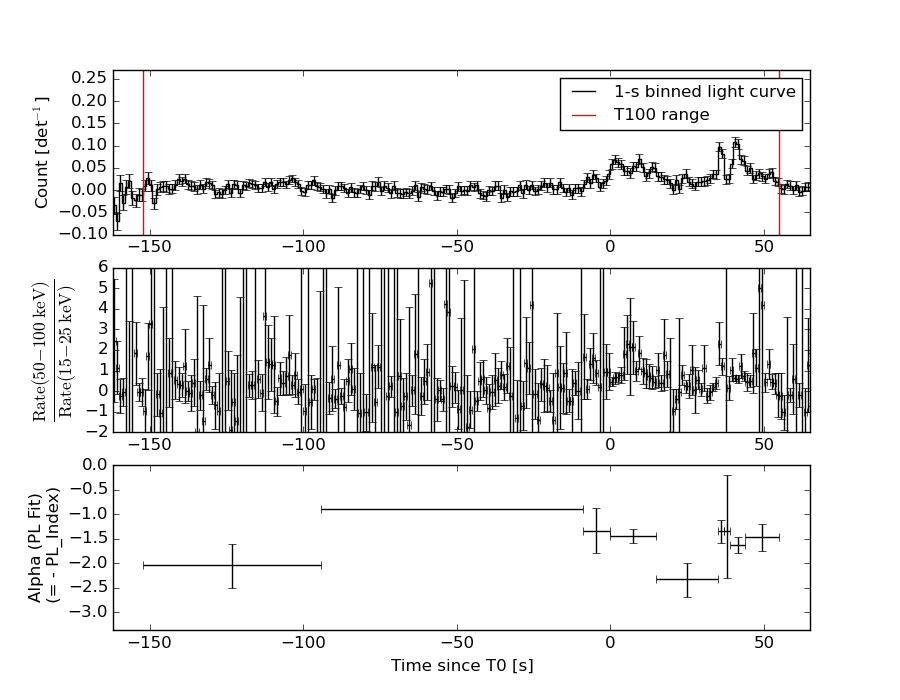
1 s binning
From T0-310 s to T0+310 s
From T100_start - 20 s to T100_end + 30 s
Full time interval
64 ms binning
Full time interval
From T100_start to T100_end
From T0-5 sec to T0+5 sec
16 ms binning
From T100_start-5 s to T100_start+5 s
Blue+Cyan dotted lines: Time interval of the scaled map
From 0.000000 to 4.096000
8 ms binning
From T100_start-3 s to T100_start+3 s
Blue+Cyan dotted lines: Time interval of the scaled map
From 0.000000 to 4.096000
2 ms binning
From T100_start-1 s to T100_start+1 s
Blue+Cyan dotted lines: Time interval of the scaled map
From 0.000000 to 4.096000
SN=5 or 10 sec. binning (whichever binning is satisfied first)
SN=5 or 10 sec. binning (T < 200 sec)
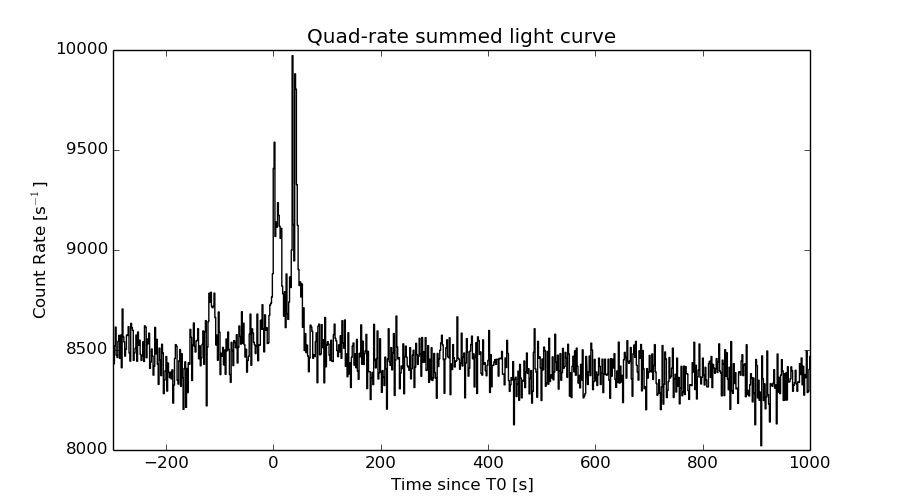
Quad-rate summed light curves (from T0-300s to T0+1000s)
Spectral Evolution
Spectra
Notes:
- 1) The fitting includes the systematic errors.
- 2) When the burst includes telescope slew time periods, the fitting uses an average response file made from multiple 5-s response files through out the slew time plus single time preiod for the non-slew times, and weighted by the total counts in the corresponding time period using addrmf. An average response file is needed becuase a spectral fit using the pre-slew DRM will introduce some errors in both a spectral shape and a normalization if the PHA file contains a lot of the slew/post-slew time interval.
- 3) For fits to more complicated models (e.g. a power-law over a cutoff power-law), the BAT team has decided to require a chi-square improvement of more than 6 for each extra dof.
Time averaged spectrum fit using the average DRM
Power-law model
Time interval is from -152.048 sec. to   54.952 sec.

Spectral model in power-law:
------------------------------------------------------------
Parameters  : value       lower 90%   higher 90%
Photon index: 1.65796     ( -0.145915   0.148025 )
Norm@50keV  : 9.10084E-04    ( -7.7398e-05   7.63475e-05 )
------------------------------------------------------------
#Fit statistic : Chi-Squared =          40.83 using 59 PHA bins.
# Reduced chi-squared =         0.7163 for     57 degrees of freedom
# Null hypothesis probability =   9.477576e-01

Photon flux (15-150 keV)    in 207 sec: 0.119148 ( -0.0091893  0.00920098 ) ph/cm2/s
Energy fluence (15-150 keV)             : 1.7507e-06 ( -1.58929e-07  1.61069e-07 ) ergs/cm2
Cutoff power-law model
Time interval is from -152.048 sec. to   54.952 sec.
Spectral model in the cutoff power-law:
------------------------------------------------------------
Parameters  : value       lower 90%   higher 90%
Photon index: 2.17739     (     )
Epeak [keV] : 67.8447      (   )
Norm@50keV  : 4.92641E-04    (     )
------------------------------------------------------------
#Fit statistic : Chi-Squared =          40.57 using 59 PHA bins.
# Reduced chi-squared =         0.7244 for     56 degrees of freedom
# Null hypothesis probability =   9.399632e-01

Photon flux (15-150 keV)    in 207 sec: 0.119237 ( -0.004663  0.009092 ) ph/cm2/s
Energy fluence (15-150 keV)             : 1.74067e-06 ( -1.49957e-07  1.66395e-07 ) ergs/cm2
Band function
Time interval is from -152.048 sec. to   54.952 sec.

Spectral model in the Band function:
------------------------------------------------------------
Parameters  : value       lower 90%   higher 90%
alpha       : 4.42830   ( -4.4283   -4.4283 )
beta        : -1.69125    ( -0.163049   0.15542 )
Epeak [keV] : 20.2862      ( -20.2862 23.1233 )
Norm@50keV   : 139.748    ( -10.6418   612609 )
------------------------------------------------------------
#Fit statistic : Chi-Squared =          40.49 using 59 PHA bins.
# Reduced chi-squared =         0.7362 for     55 degrees of freedom
# Null hypothesis probability =   9.282270e-01

Photon flux (15-150 keV)    in 207 sec:  (    ) ph/cm2/s
Energy fluence (15-150 keV)             : 0 ( 0  0 ) ergs/cm2
Single BB
Spectral model blackbody:
------------------------------------------------------------
Parameters  : value    Lower 90%  Upper 90%
kT [keV]    : 11.7803  (-1.22975  1.42909)
R^2/D10^2   : 2.98039E-02  (-0.010155   0.0149462)
(R is the radius in km and D10 is the distance to the source in units of 10 kpc)
------------------------------------------------------------
#Fit statistic : Chi-Squared =          94.70 using 59 PHA bins.
# Reduced chi-squared =          1.661 for     57 degrees of freedom
# Null hypothesis probability =   1.264006e-03

Energy  Fluence     90% Error
[keV]   [erg/cm2]   [erg/cm2]
15- 25  1.808e-07   2.502e-08
25- 50  5.565e-07   5.216e-08
50-150  4.586e-07   9.460e-08
15-150  1.196e-06   1.206e-07
Thermal bremsstrahlung (OTTB)
Spectral model: thermal bremsstrahlung
------------------------------------------------------------
Parameters  : value         Lower 90%    Upper 90%
kT [keV]    : 159.907       (-57.329      -158.741)
Norm        : 0.484212       (-0.0404144     0.054001)
------------------------------------------------------------
#Fit statistic : Chi-Squared =          44.43 using 59 PHA bins.
# Reduced chi-squared =         0.7794 for     57 degrees of freedom
# Null hypothesis probability =   8.875745e-01

Energy  Fluence     90% Error
[keV]   [erg/cm2]   [erg/cm2]
15- 25  2.560e-07   3.084e-08
25- 50  4.787e-07   1.085e-07
50-150  9.697e-07   4.730e-07
15-150  1.704e-06   5.867e-07
Double BB
Spectral model: bbodyrad<1> + bbodyrad<2>
------------------------------------------------------------
Parameters  : value         Lower 90%    Upper 90%
kT1 [keV]   : 7.64661        (-1.37876      1.46294)
R1^2/D10^2  : 0.118970        (-0.0533512      0.115506)
kT2 [keV]   : 47.0334        (-19.2994      -47.181)
R2^2/D10^2  : 2.36271E-04    (-0.000186789   0.000859177)
------------------------------------------------------------
#Fit statistic : Chi-Squared =          38.88 using 59 PHA bins.
# Reduced chi-squared =         0.7070 for     55 degrees of freedom
# Null hypothesis probability =   9.509321e-01

Energy  Fluence     90% Error
[keV]   [erg/cm2]   [erg/cm2]
15- 25  2.636e-07   5.119e-08
25- 50  4.942e-07   9.895e-08
50-150  1.105e-06   5.332e-07
15-150  1.863e-06   6.090e-07
Peak spectrum fit
Power-law model
Time interval is from   39.952 sec. to   40.952 sec.

Spectral model in power-law:
------------------------------------------------------------
Parameters  : value       lower 90%   higher 90%
Photon index: 1.78070     ( -0.27725   0.295139 )
Norm@50keV  : 6.37436E-03    ( -0.001228   0.0011925 )
------------------------------------------------------------
#Fit statistic : Chi-Squared =          71.13 using 59 PHA bins.
# Reduced chi-squared =          1.248 for     57 degrees of freedom
# Null hypothesis probability =   9.878573e-02

Photon flux (15-150 keV)    in 1 sec: 0.871888 ( -0.137011  0.137012 ) ph/cm2/s
Energy fluence (15-150 keV)             : 5.87276e-08 ( -1.13205e-08  1.17441e-08 ) ergs/cm2
Cutoff power-law model
Time interval is from   39.952 sec. to   40.952 sec.
Spectral model in the cutoff power-law:
------------------------------------------------------------
Parameters  : value       lower 90%   higher 90%
Photon index: 1.13475     ( -1.4005   1.03444 )
Epeak [keV] : 56.5607      ( -48.9277 -56.5607 )
Norm@50keV  : 1.49984E-02    ( -0.00955673   0.0840504 )
------------------------------------------------------------
#Fit statistic : Chi-Squared =          70.06 using 59 PHA bins.
# Reduced chi-squared =          1.251 for     56 degrees of freedom
# Null hypothesis probability =   9.805894e-02

Photon flux (15-150 keV)    in 1 sec: 0.851274 ( -0.140615  0.140859 ) ph/cm2/s
Energy fluence (15-150 keV)             : 5.46048e-08 ( -1.25195e-08  1.34656e-08 ) ergs/cm2
Band function
Time interval is from   39.952 sec. to   40.952 sec.

Spectral model in the Band function:
------------------------------------------------------------
Parameters  : value       lower 90%   higher 90%
alpha       : -1.15076   ( -1.64128   1.00769 )
beta        : -9.37165    ( 9.37167   19.3717 )
Epeak [keV] : 57.1690      ( -21.8114 -57.1355 )
Norm@50keV   : 1.46504E-02    ( -0.00747394   0.00662913 )
------------------------------------------------------------
#Fit statistic : Chi-Squared =          70.06 using 59 PHA bins.
# Reduced chi-squared =          1.274 for     55 degrees of freedom
# Null hypothesis probability =   8.311142e-02

Photon flux (15-150 keV)    in 1 sec:  (    ) ph/cm2/s
Energy fluence (15-150 keV)             : 0 ( 0  0 ) ergs/cm2
Single BB
Spectral model blackbody:
------------------------------------------------------------
Parameters  : value    Lower 90%  Upper 90%
kT [keV]    : 10.6685  (-1.98059  2.5463)
R^2/D10^2   : 0.323835  (-0.17587   0.369952)
(R is the radius in km and D10 is the distance to the source in units of 10 kpc)
------------------------------------------------------------
#Fit statistic : Chi-Squared =          77.35 using 59 PHA bins.
# Reduced chi-squared =          1.357 for     57 degrees of freedom
# Null hypothesis probability =   3.770111e-02

Energy  Fluence     90% Error
[keV]   [erg/cm2]   [erg/cm2]
15- 25  7.649e-09   2.467e-09
25- 50  2.078e-08   4.990e-09
50-150  1.304e-08   5.583e-09
15-150  4.147e-08   9.890e-09
Thermal bremsstrahlung (OTTB)
Spectral model: thermal bremsstrahlung
------------------------------------------------------------
Parameters  : value         Lower 90%    Upper 90%
kT [keV]    : 95.4222       (-41.2791      -95.4222)
Norm        : 3.91712       (-0.767625     1.04298)
------------------------------------------------------------
#Fit statistic : Chi-Squared =          70.10 using 59 PHA bins.
# Reduced chi-squared =          1.230 for     57 degrees of freedom
# Null hypothesis probability =   1.141201e-01

Energy  Fluence     90% Error
[keV]   [erg/cm2]   [erg/cm2]
15- 25  1.023e-08   2.296e-09
25- 50  1.753e-08   4.400e-09
50-150  2.765e-08   1.884e-08
15-150  5.541e-08   2.496e-08
Double BB

Spectral model: bbodyrad<1> + bbodyrad<2>
------------------------------------------------------------
Parameters  : value         Lower 90%    Upper 90%
kT1 [keV]   : 6.21332        (-2.78348      3.06873)
R1^2/D10^2  : 1.59281        (-1.14432      11.9164)
kT2 [keV]   : 20.7819        (-8.16187      32.3339)
R2^2/D10^2  : 1.91532E-02    (-0.018309   0.122681)
------------------------------------------------------------
#Fit statistic : Chi-Squared =          69.56 using 59 PHA bins.
# Reduced chi-squared =          1.265 for     55 degrees of freedom
# Null hypothesis probability =   8.944874e-02

Energy  Fluence     90% Error
[keV]   [erg/cm2]   [erg/cm2]
15- 25  1.015e-08   6.025e-09
25- 50  1.724e-08   9.220e-09
50-150  2.675e-08   1.618e-08
15-150  5.414e-08   2.880e-08
Pre-slew spectrum (Pre-slew PHA with pre-slew DRM)
Power-law model

Spectral model in power-law:
------------------------------------------------------------
Parameters  : value       lower 90%   higher 90%
Photon index: 1.55910     ( -0.140072   0.141358 )
Norm@50keV  : 1.20636E-03    ( -9.63468e-05   9.54785e-05 )
------------------------------------------------------------
#Fit statistic : Chi-Squared =          53.57 using 59 PHA bins.
# Reduced chi-squared =         0.9399 for     57 degrees of freedom
# Null hypothesis probability =   6.043575e-01

Photon flux (15-150 keV)    in 128.1 sec: 0.153123 ( -0.0116105  0.0116238 ) ph/cm2/s
Energy fluence (15-150 keV)             : 1.45294e-06 ( -1.27235e-07  1.28685e-07 ) ergs/cm2
Cutoff power-law model

Spectral model in the cutoff power-law:
------------------------------------------------------------
Parameters  : value       lower 90%   higher 90%
Photon index: 1.55544     ( -0.139161   0.143743 )
Epeak [keV] : 9999.35      ( -9999.36 -9999.36 )
Norm@50keV  : 1.20988E-03    ( -0.00120978   0.000578854 )
------------------------------------------------------------
#Fit statistic : Chi-Squared =          53.59 using 59 PHA bins.
# Reduced chi-squared =         0.9569 for     56 degrees of freedom
# Null hypothesis probability =   5.667383e-01

Photon flux (15-150 keV)    in 128.1 sec: 0.153191 ( -0.011676  0.011508 ) ph/cm2/s
Energy fluence (15-150 keV)             : 1.44998e-06 ( -6.31277e-08  1.28036e-07 ) ergs/cm2
Band function
Spectral model in the Band function:
------------------------------------------------------------
Parameters  : value       lower 90%   higher 90%
alpha       : -0.815668   ( 1.05064   1.05064 )
beta        : -1.61328    ( -0.265576   0.180112 )
Epeak [keV] : 47.2662      ( -46.663 -46.663 )
Norm@50keV   : 3.87157E-03    ( -0.00410447   178.35 )
------------------------------------------------------------
#Fit statistic : Chi-Squared =          53.17 using 59 PHA bins.
# Reduced chi-squared =         0.9667 for     55 degrees of freedom
# Null hypothesis probability =   5.448129e-01

Photon flux (15-150 keV)    in 128.1 sec:  (    ) ph/cm2/s
Energy fluence (15-150 keV)             : 0 ( 0  0 ) ergs/cm2
S(25-50 keV) vs. S(50-100 keV) plot
S(25-50 keV)  = 4.66e-07
S(50-100 keV) = 5.90e-07
T90 vs. Hardness ratio plot
T90                                   = 187 sec.
Hardness ratio (energy fluence ratio) = 1.26609
Color vs. Color plot
Count Ratio  (25-50 keV) / (15-25 keV) = 1.1192
Count Ratio (50-100 keV) / (15-25 keV) = 0.727445
Mask shadow pattern
IMX = 8.881739870735185E-02, IMY = 3.693123778236507E-01
TIME vs. PHA plot around the trigger time
Blue+Cyan dotted lines: Time interval of the scaled map
From 0.000000 to 4.096000
TIME vs. DetID plot around the trigger time
Blue+Cyan dotted lines: Time interval of the scaled map
From 0.000000 to 4.096000
100 us light curve (15-350 keV)
Blue+Cyan dotted lines: Time interval of the scaled map
From 0.000000 to 4.096000
Spacecraft aspect plot
Bright source in the pre-burst/pre-slew/post-slew images
Pre-burst image of 15-350 keV band
Time interval of the image:
Pre-slew background subtracted image of 15-350 keV band
Time interval of the image:
-73.147400 54.952000

# RAcent  DECcent POSerr Theta    Phi  PeakCts   SNR AngSep     Name
#  [deg]    [deg]    ['] [deg]  [deg]                   [']
135.5571 -40.5675    2.3  38.8 -170.3   0.7486   5.1    1.5	Vela X-1
170.1517 -60.6468    4.5  45.1  146.4   0.8015   2.5    5.0	Cen X-3
134.7994 -64.1533    2.6  54.2  164.7   2.4622   4.5 ------	UNKNOWN
201.9929  25.8735    2.3  51.9    4.4   1.5868   5.0 ------	UNKNOWN
124.8658 -46.0112    2.6  48.2 -172.2   0.8956   4.4 ------	UNKNOWN
155.6422  -0.0268    0.6  20.8  -76.5   2.4408  19.5 ------	UNKNOWN
Post-slew image of 15-350 keV band
Time interval of the image:
-299.048000 302.982500

# RAcent  DECcent POSerr Theta    Phi  PeakCts   SNR AngSep     Name
#  [deg]    [deg]    ['] [deg]  [deg]                   [']
135.5293 -40.5307    2.2  38.8 -170.3   2.0013   5.3    1.4	Vela X-1
169.9306 -60.6494    4.2  45.2  146.6   2.4685   2.7   11.4	Cen X-3
187.2392 -23.5969    3.6  18.4   85.6   0.9447   3.2 ------	UNKNOWN
155.6105  -0.0109    1.5  20.8  -76.5   2.5744   7.8 ------	UNKNOWN
165.4564  23.4044    2.7  39.1  -39.5   1.9134   4.3 ------	UNKNOWN
111.2478 -26.7376    5.0  55.2 -145.3   4.8600   2.3 ------	UNKNOWN
133.0447   3.8790    3.5  41.1  -98.2   5.8000   3.3 ------	UNKNOWN
Plot creation:
Sun May 31 16:33:21 EDT 2015