Special notes of this burst
Image
Pre-slew 15.0-350.0 keV image (Event data)
#   RAcent    DECcent   POSerr    Theta     Phi              Peak Cts       SNR   Name
  253.4607   -28.3903   0.0174    39.0992    91.3758         6.9084507     11.009 TRIG_00146970

Foreground time interval of the image:
 -3.640 118.981 (delta_t = 122.621 [sec])
Background time interval of the image:
-295.119  -3.640 (delta_t = 291.479 [sec])
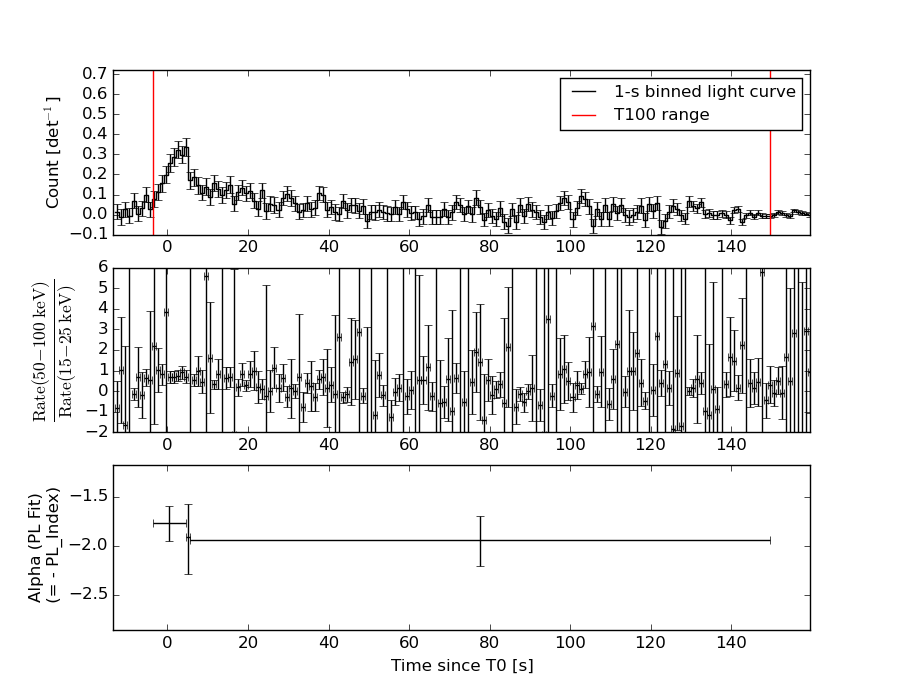
Lightcurves
Notes:
- 1) The mask-weighted light curves are using the flight position.
- 2) Multiple plots of different time binning/intervals are shown to cover all scenarios of short/long GRBs, rate/image triggers, and real/false positives.
- 3) For all the mask-weighted lightcurves, the y-axis units are counts/sec/det where a det is 0.4 x 0.4 = 0.16 sq cm.
- 4) The verticle lines correspond to following: green dotted lines are T50 interval, black dotted lines are T90 interval, blue solid line(s) is a spacecraft slew start time, and orange solid line(s) is a spacecraft slew end time.
- 5) Time of each bin is in the middle of the bin.
1 s binning
From T0-310 s to T0+310 s
From T100_start - 20 s to T100_end + 30 s
Full time interval
64 ms binning
Full time interval
From T100_start to T100_end
From T0-5 sec to T0+5 sec
16 ms binning
From T100_start-5 s to T100_start+5 s
8 ms binning
From T100_start-3 s to T100_start+3 s

2 ms binning
From T100_start-1 s to T100_start+1 s
SN=5 or 10 sec. binning (whichever binning is satisfied first)
SN=5 or 10 sec. binning (T < 200 sec)
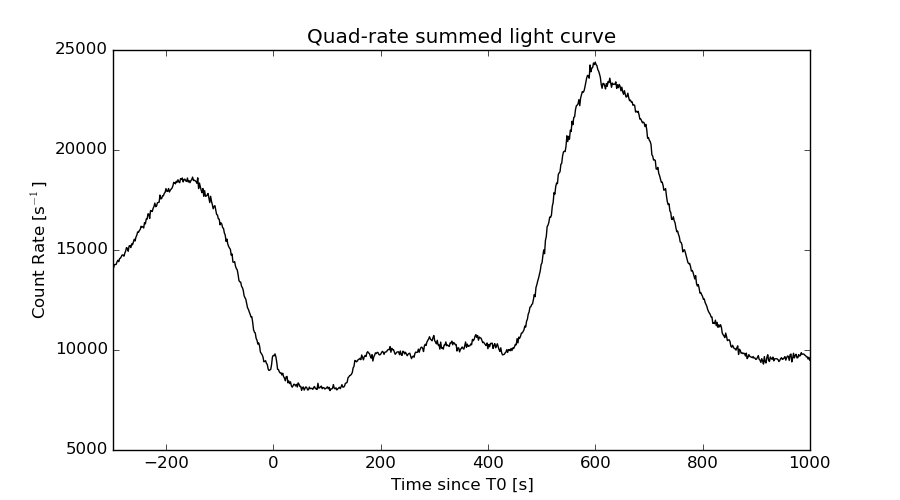
Quad-rate summed light curves (from T0-300s to T0+1000s)
Spectral Evolution
Spectra
Notes:
- 1) The fitting includes the systematic errors.
- 2) When the burst includes telescope slew time periods, the fitting uses an average response file made from multiple 5-s response files through out the slew time plus single time preiod for the non-slew times, and weighted by the total counts in the corresponding time period using addrmf. An average response file is needed becuase a spectral fit using the pre-slew DRM will introduce some errors in both a spectral shape and a normalization if the PHA file contains a lot of the slew/post-slew time interval.
- 3) For fits to more complicated models (e.g. a power-law over a cutoff power-law), the BAT team has decided to require a chi-square improvement of more than 6 for each extra dof.
Time averaged spectrum fit using the average DRM
Power-law model

Time interval is from   -3.640 sec. to  149.552 sec.

Spectral model in power-law:
------------------------------------------------------------
Parameters  : value       lower 90%   higher 90%
Photon index: 1.86189     ( -0.178105   0.183808 )
Norm@50keV  : 2.82300E-03    ( -0.000314075   0.000309855 )
------------------------------------------------------------
#Fit statistic : Chi-Squared =          89.68 using 59 PHA bins.
# Reduced chi-squared =          1.573 for     57 degrees of freedom
# Null hypothesis probability =   3.717259e-03

Photon flux (15-150 keV)    in 153.2 sec: 0.398733 ( -0.0415079  0.0416345 ) ph/cm2/s
Energy fluence (15-150 keV)             : 3.97618e-06 ( -4.39278e-07  4.43425e-07 ) ergs/cm2
Cutoff power-law model
Time interval is from   -3.640 sec. to  149.552 sec.
Spectral model in the cutoff power-law:
------------------------------------------------------------
Parameters  : value       lower 90%   higher 90%
Photon index: 1.09201     ( -0.951499   0.779838 )
Epeak [keV] : 54.4154      ( -13.1486 516.425 )
Norm@50keV  : 7.27549E-03    ( -0.00442856   0.0160311 )
------------------------------------------------------------
#Fit statistic : Chi-Squared =          86.87 using 59 PHA bins.
# Reduced chi-squared =          1.551 for     56 degrees of freedom
# Null hypothesis probability =   5.125119e-03

Photon flux (15-150 keV)    in 153.2 sec: 0.384036 ( -0.044123  0.044166 ) ph/cm2/s
Energy fluence (15-150 keV)             : 3.73943e-06 ( -4.92247e-07  5.03553e-07 ) ergs/cm2
Band function
Time interval is from   -3.640 sec. to  149.552 sec.

Spectral model in the Band function:
------------------------------------------------------------
Parameters  : value       lower 90%   higher 90%
alpha       : -0.954756   ( -0.855987   0.893033 )
beta        : -2.35962    ( 2.34117   0.52076 )
Epeak [keV] : 50.9099      ( -24.0001 124.235 )
Norm@50keV   : 8.78891E-03    ( -0.0108705   118.499 )
------------------------------------------------------------
#Fit statistic : Chi-Squared =          86.69 using 59 PHA bins.
# Reduced chi-squared =          1.576 for     55 degrees of freedom
# Null hypothesis probability =   4.115929e-03

Photon flux (15-150 keV)    in 153.2 sec:  (    ) ph/cm2/s
Energy fluence (15-150 keV)             : 3.77186e-06 ( 0  0 ) ergs/cm2
Single BB
Spectral model blackbody:
------------------------------------------------------------
Parameters  : value    Lower 90%  Upper 90%
kT [keV]    : 11.9193  (-1.31588  1.49146)
R^2/D10^2   : 9.68204E-02  (-0.0350777   0.0543561)
(R is the radius in km and D10 is the distance to the source in units of 10 kpc)
------------------------------------------------------------
#Fit statistic : Chi-Squared =         101.65 using 59 PHA bins.
# Reduced chi-squared =         1.7833 for     57 degrees of freedom
# Null hypothesis probability =   2.541922e-04

Energy  Fluence     90% Error
[keV]   [erg/cm2]   [erg/cm2]
15- 25  4.454e-07   8.418e-08
25- 50  1.391e-06   1.765e-07
50-150  1.183e-06   2.673e-07
15-150  3.019e-06   3.822e-07
Thermal bremsstrahlung (OTTB)
Spectral model: thermal bremsstrahlung
------------------------------------------------------------
Parameters  : value         Lower 90%    Upper 90%
kT [keV]    : 89.6945       (-25.1916      44.8991)
Norm        : 1.80655       (-0.260314     0.314254)
------------------------------------------------------------
#Fit statistic : Chi-Squared =          87.03 using 59 PHA bins.
# Reduced chi-squared =          1.527 for     57 degrees of freedom
# Null hypothesis probability =   6.378041e-03

Energy  Fluence     90% Error
[keV]   [erg/cm2]   [erg/cm2]
15- 25  7.221e-07   1.057e-07
25- 50  1.220e-06   1.335e-07
50-150  1.854e-06   7.554e-07
15-150  3.797e-06   8.717e-07
Double BB
------------------------------------------------------------
Parameters  : value         Lower 90%    Upper 90%
kT1 [keV]   : 6.44879        (      )
R1^2/D10^2  : 0.578043        (-0.399742      3.93983)
kT2 [keV]   : 19.0493        (-5.19064      26.6469)
R2^2/D10^2  : 1.18589E-02    (-0.0116246   0.0370266)
------------------------------------------------------------
#Fit statistic : Chi-Squared =          89.11 using 59 PHA bins.
#Fit statistic : Chi-Squared =          87.78 using 59 PHA bins.
# Reduced chi-squared =          1.620 for     55 degrees of freedom
# Reduced chi-squared =          1.596 for     55 degrees of freedom
# Null hypothesis probability =   2.460868e-03
# Null hypothesis probability =   3.273252e-03

Energy  Fluence     90% Error
[keV]   [erg/cm2]   [erg/cm2]
15- 25  6.490e-07   3.878e-07
25- 50  1.180e-06   5.766e-07
50-150  1.545e-06   8.505e-07
15-150  3.373e-06   1.776e-06
Peak spectrum fit
Power-law model
Time interval is from    3.896 sec. to    4.896 sec.

Spectral model in power-law:
------------------------------------------------------------
Parameters  : value       lower 90%   higher 90%
Photon index: 2.34866     ( -0.30055   0.35113 )
Norm@50keV  : 1.56427E-02    ( -0.00430484   0.00424607 )
------------------------------------------------------------
#Fit statistic : Chi-Squared =          86.89 using 59 PHA bins.
# Reduced chi-squared =          1.524 for     57 degrees of freedom
# Null hypothesis probability =   6.556256e-03

Photon flux (15-150 keV)    in 1 sec: 2.80882 ( -0.630419  0.631575 ) ph/cm2/s
Energy fluence (15-150 keV)             : 1.51085e-07 ( -3.61485e-08  3.67044e-08 ) ergs/cm2
Cutoff power-law model

Time interval is from    3.896 sec. to    4.896 sec.
Spectral model in the cutoff power-law:
------------------------------------------------------------
Parameters  : value       lower 90%   higher 90%
Photon index: -1.80512     ( -3.4711   2.01808 )
Epeak [keV] : 38.9815      ( -6.53693 6.63483 )
Norm@50keV  : 3.64586    ( -4.51379   290.329 )
------------------------------------------------------------
#Fit statistic : Chi-Squared =          71.15 using 59 PHA bins.
# Reduced chi-squared =          1.271 for     56 degrees of freedom
# Null hypothesis probability =   8.357197e-02

Photon flux (15-150 keV)    in 1 sec: 2.78846 ( -0.629  0.63502 ) ph/cm2/s
Energy fluence (15-150 keV)             : 1.52136e-07 ( -3.3196e-08  3.5118e-08 ) ergs/cm2
Band function

Time interval is from    3.896 sec. to    4.896 sec.

Spectral model in the Band function:
------------------------------------------------------------
Parameters  : value       lower 90%   higher 90%
alpha       : 1.84491   ( -2.04776   -1.86886 )
beta        : -9.37167    ( 9.37167   19.3498 )
Epeak [keV] : 39.1990      ( -6.28435 6.38766 )
Norm@50keV   : 3.76843    ( -3.9502   154.208 )
------------------------------------------------------------
#Fit statistic : Chi-Squared =          71.15 using 59 PHA bins.
# Reduced chi-squared =          1.294 for     55 degrees of freedom
# Null hypothesis probability =   7.037546e-02

Photon flux (15-150 keV)    in 1 sec:  (    ) ph/cm2/s
Energy fluence (15-150 keV)             : 1.52671e-07 ( 0  0 ) ergs/cm2
Single BB

Spectral model blackbody:
------------------------------------------------------------
Parameters  : value    Lower 90%  Upper 90%
kT [keV]    : 10.0231  (-1.57937  1.73854)
R^2/D10^2   : 1.56297  (-0.745826   1.46946)
(R is the radius in km and D10 is the distance to the source in units of 10 kpc)
------------------------------------------------------------
#Fit statistic : Chi-Squared =          71.06 using 59 PHA bins.
# Reduced chi-squared =          1.247 for     57 degrees of freedom
# Null hypothesis probability =   9.966657e-02

Energy  Fluence     90% Error
[keV]   [erg/cm2]   [erg/cm2]
15- 25  3.200e-08   1.275e-08
25- 50  7.983e-08   2.250e-08
50-150  4.195e-08   2.103e-08
15-150  1.538e-07   4.728e-08
Thermal bremsstrahlung (OTTB)
Spectral model: thermal bremsstrahlung
------------------------------------------------------------
Parameters  : value         Lower 90%    Upper 90%
kT [keV]    : 42.7247       (-13.1128      20.2857)
Norm        : 19.1096       (-5.33873     7.15653)
------------------------------------------------------------
#Fit statistic : Chi-Squared =          78.82 using 59 PHA bins.
# Reduced chi-squared =          1.383 for     57 degrees of freedom
# Null hypothesis probability =   2.940133e-02

Energy  Fluence     90% Error
[keV]   [erg/cm2]   [erg/cm2]
15- 25  4.482e-08   1.097e-08
25- 50  6.062e-08   1.759e-08
50-150  5.033e-08   2.763e-08
15-150  1.558e-07   4.809e-08
Double BB
Spectral model: bbodyrad<1> + bbodyrad<2>
------------------------------------------------------------
Parameters  : value         Lower 90%    Upper 90%
kT1 [keV]   : 3.49152        (-3.5771      -3.5771)
R1^2/D10^2  : 2.69312        (-2.25303      -2.25303)
kT2 [keV]   : 10.0952        (-1.6405      -10.0946)
R2^2/D10^2  : 1.50646    (-1.50543   1.52732)
------------------------------------------------------------
#Fit statistic : Chi-Squared =          71.06 using 59 PHA bins.
# Reduced chi-squared =          1.292 for     55 degrees of freedom
# Null hypothesis probability =   7.140537e-02

Energy  Fluence     90% Error
[keV]   [erg/cm2]   [erg/cm2]
15- 25  3.258e-08   2.183e-08
25- 50  7.933e-08   4.909e-08
50-150  4.240e-08   2.761e-08
15-150  1.543e-07   1.003e-07
Pre-slew spectrum (Pre-slew PHA with pre-slew DRM)
Power-law model

Spectral model in power-law:
------------------------------------------------------------
Parameters  : value       lower 90%   higher 90%
Photon index: 1.81100     ( -0.178156   0.183006 )
Norm@50keV  : 3.43142E-03    ( -0.000371172   0.000366815 )
------------------------------------------------------------
#Fit statistic : Chi-Squared =          87.19 using 59 PHA bins.
# Reduced chi-squared =          1.530 for     57 degrees of freedom
# Null hypothesis probability =   6.170637e-03

Photon flux (15-150 keV)    in 122.6 sec: 0.474873 ( -0.0493652  0.0495374 ) ph/cm2/s
Energy fluence (15-150 keV)             : 3.87151e-06 ( -4.22384e-07  4.26102e-07 ) ergs/cm2
Cutoff power-law model
Spectral model in the cutoff power-law:
------------------------------------------------------------
Parameters  : value       lower 90%   higher 90%
Photon index: 1.26032     ( -0.907819   0.784029 )
Epeak [keV] : 63.5504      ( -18.1131 -63.5523 )
Norm@50keV  : 6.67800E-03    ( -0.0034802   0.0131538 )
------------------------------------------------------------
#Fit statistic : Chi-Squared =          85.68 using 59 PHA bins.
# Reduced chi-squared =          1.530 for     56 degrees of freedom
# Null hypothesis probability =   6.518269e-03

Photon flux (15-150 keV)    in 122.6 sec: 0.461725 ( -0.052636  0.052618 ) ph/cm2/s
Energy fluence (15-150 keV)             : 3.70758e-06 ( -4.80506e-07  4.82995e-07 ) ergs/cm2
Band function

Spectral model in the Band function:
------------------------------------------------------------
Parameters  : value       lower 90%   higher 90%
alpha       : -0.985253   ( 0.985717   0.985717 )
beta        : -2.17876    ( 2.17518   0.457844 )
Epeak [keV] : 53.1536      ( -52.5692 -52.5692 )
Norm@50keV   : 9.77814E-03    ( -0.0102019   150.502 )
------------------------------------------------------------
#Fit statistic : Chi-Squared =          85.28 using 59 PHA bins.
# Reduced chi-squared =          1.551 for     55 degrees of freedom
# Null hypothesis probability =   5.499816e-03

Photon flux (15-150 keV)    in 122.6 sec:  (    ) ph/cm2/s
Energy fluence (15-150 keV)             : 3.72009e-06 ( -3.71923e-06  -4.66983e-07 ) ergs/cm2
S(25-50 keV) vs. S(50-100 keV) plot
S(25-50 keV)  = 1.14e-06
S(50-100 keV) = 1.26e-06
T90 vs. Hardness ratio plot
T90                                   = 104.700000017881 sec.
Hardness ratio (energy fluence ratio) = 1.10526
Color vs. Color plot

Count Ratio  (25-50 keV) / (15-25 keV) = 1.19561
Count Ratio (50-100 keV) / (15-25 keV) = 0.75684
Mask shadow pattern

IMX = -1.951130092065932E-02, IMY = -8.124193839852702E-01
TIME vs. PHA plot around the trigger time

TIME vs. DetID plot around the trigger time
100 us light curve (15-350 keV)
Spacecraft aspect plot
Bright source in the pre-burst/pre-slew/post-slew images
Pre-burst image of 15-350 keV band
Time interval of the image:
-295.119400 -3.640000

# RAcent  DECcent POSerr Theta    Phi  PeakCts   SNR AngSep     Name
#  [deg]    [deg]    ['] [deg]  [deg]                   [']
170.2943 -60.6154   39.7  54.1 -179.8  -0.3215  -0.3    0.8	Cen X-3
186.6598 -62.7761    3.3  50.3  171.3   3.0105   3.5    0.4	GX 301-2
244.9859 -15.6451    0.3  30.6   69.6  20.1100  37.7    0.5	Sco X-1
212.5649 -62.9935    3.7  47.0  156.2   3.1239   3.1 ------	UNKNOWN
160.1296 -57.8419    3.0  57.2 -173.7   5.5827   3.9 ------	UNKNOWN
181.4656 -17.7666    3.0  30.3 -122.0   1.3740   3.9 ------	UNKNOWN
186.9014  14.1596    4.3  39.8  -66.2   2.9076   2.6 ------	UNKNOWN
Pre-slew background subtracted image of 15-350 keV band
Time interval of the image:
-3.640000 118.980600

# RAcent  DECcent POSerr Theta    Phi  PeakCts   SNR AngSep     Name
#  [deg]    [deg]    ['] [deg]  [deg]                   [']
170.2285 -60.7635   16.7  54.2 -179.9  -0.3821  -0.7    8.8	Cen X-3
186.7193 -62.7151   11.2  50.2  171.3  -0.4080  -1.0    3.7	GX 301-2
244.8031 -15.7232    0.0  30.4   69.7   0.1375   0.6   11.3	Sco X-1
253.4607 -28.3904    1.1  39.1   91.4   6.9093  10.9 ------	UNKNOWN
218.7261  28.5732    1.8  44.9  -17.2   1.4512   6.5 ------	UNKNOWN
197.5647  34.1256    2.3  52.3  -40.4   3.5158   5.0 ------	UNKNOWN
Post-slew image of 15-350 keV band
Time interval of the image:
175.580620 302.148000

# RAcent  DECcent POSerr Theta    Phi  PeakCts   SNR AngSep     Name
#  [deg]    [deg]    ['] [deg]  [deg]                   [']
186.4210 -62.7402   32.6  54.6 -149.2   0.2386   0.4    6.7	GX 301-2
244.9850 -15.6452    0.1  14.9  -33.6  11.3360  83.7    0.4	Sco X-1
255.8973 -37.7375    7.0   9.6  167.8   0.2257   1.7    7.7	4U 1700-377
256.4446 -36.3888    4.0   8.4  162.7   0.3995   2.9    2.1	GX 349+2
263.0053 -24.8943   45.7   9.2   69.7   0.0353   0.3    8.9	GX 1+4
264.7249 -44.4764    7.9  18.5  153.4   0.2269   1.5    1.8	4U 1735-44
268.3731  -1.4485    1.2  30.5   30.2   1.6726   9.3    0.4	SW J1753.5-0127
270.2958 -25.1448    3.1  15.4   81.4   0.5617   3.8    4.0	GX 5-1
270.3913 -25.7088    3.0  15.3   83.6   0.6363   4.3    5.2	GRS 1758-258
273.9750 -13.9868    5.6  23.9   56.9   0.3533   2.1    3.5	GX 17+2
276.0314 -30.3170    6.0  19.8  100.8   0.3353   1.9    6.3	H1820-303
285.1086 -24.7680    3.7  28.5   89.8  -0.7216  -3.1   10.0	HT1900.1-2455
262.9191 -33.6907    4.4   9.7  125.1   0.3527   2.6    9.3	GX 354-0
296.1406 -40.7283    3.0  36.9  120.7   1.3051   3.8 ------	UNKNOWN
291.2272 -33.4554    3.0  32.7  108.2   1.0236   3.9 ------	UNKNOWN
273.1932 -66.4767    1.9  40.0  167.5   1.3191   6.0 ------	UNKNOWN
251.1010  -5.5265    2.9  23.0   -6.3   0.5770   4.0 ------	UNKNOWN
233.4858 -26.1754    2.3  17.8  -88.0   0.7766   5.1 ------	UNKNOWN
184.5251 -73.3536    2.9  56.9 -161.8   2.4967   4.0 ------	UNKNOWN
213.1767 -40.9743    2.7  35.0 -122.2   0.9629   4.2 ------	UNKNOWN
Plot creation:
Sun May 31 16:28:29 EDT 2015