Special notes of this burst
Image
Pre-slew 15.0-350.0 keV image (Event data)
#   RAcent    DECcent   POSerr    Theta     Phi              Peak Cts       SNR   Name
  246.1799   -27.5253   0.0152    33.3010    45.6079         0.6278714     12.572 TRIG_00147478

Foreground time interval of the image:
 -0.024   8.701 (delta_t =   8.725 [sec])
Background time interval of the image:
-186.899  -0.024 (delta_t = 186.875 [sec])
Lightcurves
Notes:
- 1) The mask-weighted light curves are using the flight position.
- 2) Multiple plots of different time binning/intervals are shown to cover all scenarios of short/long GRBs, rate/image triggers, and real/false positives.
- 3) For all the mask-weighted lightcurves, the y-axis units are counts/sec/det where a det is 0.4 x 0.4 = 0.16 sq cm.
- 4) The verticle lines correspond to following: green dotted lines are T50 interval, black dotted lines are T90 interval, blue solid line(s) is a spacecraft slew start time, and orange solid line(s) is a spacecraft slew end time.
- 5) Time of each bin is in the middle of the bin.
1 s binning
From T0-310 s to T0+310 s

From T100_start - 20 s to T100_end + 30 s
Full time interval
64 ms binning
Full time interval

From T100_start to T100_end
From T0-5 sec to T0+5 sec
16 ms binning
From T100_start-5 s to T100_start+5 s
Blue+Cyan dotted lines: Time interval of the scaled map
From 0.000000 to 0.064000
8 ms binning
From T100_start-3 s to T100_start+3 s

Blue+Cyan dotted lines: Time interval of the scaled map
From 0.000000 to 0.064000
2 ms binning
From T100_start-1 s to T100_start+1 s
Blue+Cyan dotted lines: Time interval of the scaled map
From 0.000000 to 0.064000
SN=5 or 10 sec. binning (whichever binning is satisfied first)
SN=5 or 10 sec. binning (T < 200 sec)
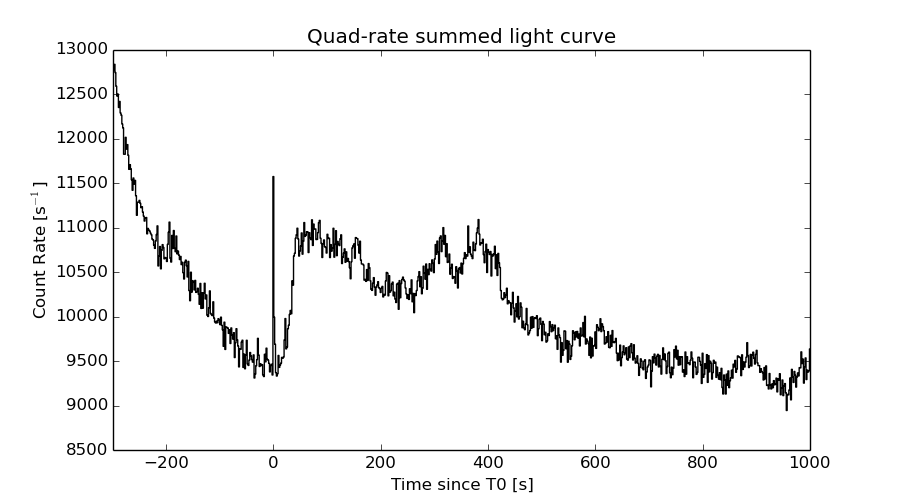
Quad-rate summed light curves (from T0-300s to T0+1000s)
Spectral Evolution

Spectra
Notes:
- 1) The fitting includes the systematic errors.
- 2) When the burst includes telescope slew time periods, the fitting uses an average response file made from multiple 5-s response files through out the slew time plus single time preiod for the non-slew times, and weighted by the total counts in the corresponding time period using addrmf. An average response file is needed becuase a spectral fit using the pre-slew DRM will introduce some errors in both a spectral shape and a normalization if the PHA file contains a lot of the slew/post-slew time interval.
- 3) For fits to more complicated models (e.g. a power-law over a cutoff power-law), the BAT team has decided to require a chi-square improvement of more than 6 for each extra dof.
Time averaged spectrum fit using the average DRM
Power-law model

Time interval is from   -0.024 sec. to  107.140 sec.

Spectral model in power-law:
------------------------------------------------------------
Parameters  : value       lower 90%   higher 90%
Photon index: 1.93423     ( -0.204333   0.21244 )
Norm@50keV  : 1.01934E-03    ( -0.000126117   0.000122932 )
------------------------------------------------------------
#Fit statistic : Chi-Squared =          56.20 using 59 PHA bins.
# Reduced chi-squared =         0.9859 for     57 degrees of freedom
# Null hypothesis probability =   5.051084e-01

Photon flux (15-150 keV)    in 107.2 sec: 0.148458 ( -0.0155345  0.0155838 ) ph/cm2/s
Energy fluence (15-150 keV)             : 1.00518e-06 ( -1.1885e-07  1.21038e-07 ) ergs/cm2
Cutoff power-law model
Time interval is from   -0.024 sec. to  107.140 sec.
Spectral model in the cutoff power-law:
------------------------------------------------------------
Parameters  : value       lower 90%   higher 90%
Photon index: 2.50788     (     )
Epeak [keV] : 179.279      (   )
Norm@50keV  : 5.49201E-04    (     )
------------------------------------------------------------
#Fit statistic : Chi-Squared =          56.21 using 59 PHA bins.
# Reduced chi-squared =          1.004 for     56 degrees of freedom
# Null hypothesis probability =   4.671686e-01

Photon flux (15-150 keV)    in 107.2 sec: 0.148397 (    ) ph/cm2/s
Energy fluence (15-150 keV)             : 1.00119e-06 ( -1.21116e-07  1.22767e-07 ) ergs/cm2
Band function

Time interval is from   -0.024 sec. to  107.140 sec.

Spectral model in the Band function:
------------------------------------------------------------
Parameters  : value       lower 90%   higher 90%
alpha       : -1.67185   ( 1.67188   1.67188 )
beta        : -1.93420    ( 1.9342   0.204247 )
Epeak [keV] : 14.6558      ( -14.6375 -14.6375 )
Norm@50keV   : 1.93902E-03    ( -0.0010309   0.0129655 )
------------------------------------------------------------
#Fit statistic : Chi-Squared =          56.20 using 59 PHA bins.
# Reduced chi-squared =          1.022 for     55 degrees of freedom
# Null hypothesis probability =   4.297502e-01

Photon flux (15-150 keV)    in 107.2 sec:  (    ) ph/cm2/s
Energy fluence (15-150 keV)             : 0 ( 0  0 ) ergs/cm2
Single BB
Spectral model blackbody:
------------------------------------------------------------
Parameters  : value    Lower 90%  Upper 90%
kT [keV]    : 10.3049  (-1.31769  1.56056)
R^2/D10^2   : 5.84959E-02  (-0.0244341   0.0410183)
(R is the radius in km and D10 is the distance to the source in units of 10 kpc)
------------------------------------------------------------
#Fit statistic : Chi-Squared =          83.62 using 59 PHA bins.
# Reduced chi-squared =          1.467 for     57 degrees of freedom
# Null hypothesis probability =   1.237187e-02

Energy  Fluence     90% Error
[keV]   [erg/cm2]   [erg/cm2]
15- 25  1.369e-07   2.863e-08
25- 50  3.550e-07   4.711e-08
50-150  2.020e-07   5.435e-08
15-150  6.939e-07   9.686e-08
Thermal bremsstrahlung (OTTB)
Spectral model: thermal bremsstrahlung
------------------------------------------------------------
Parameters  : value         Lower 90%    Upper 90%
kT [keV]    : 80.3636       (-25.124      48.1937)
Norm        : 0.681616       (-0.103511     0.14278)
------------------------------------------------------------
#Fit statistic : Chi-Squared =          59.16 using 59 PHA bins.
# Reduced chi-squared =          1.038 for     57 degrees of freedom
# Null hypothesis probability =   3.967885e-01

Energy  Fluence     90% Error
[keV]   [erg/cm2]   [erg/cm2]
15- 25  1.897e-07   2.878e-08
25- 50  3.126e-07   3.575e-08
50-150  4.425e-07   1.930e-07
15-150  9.448e-07   1.825e-07
Double BB
Spectral model: bbodyrad<1> + bbodyrad<2>
------------------------------------------------------------
Parameters  : value         Lower 90%    Upper 90%
kT1 [keV]   : 6.93543        (-1.90483      1.83442)
R1^2/D10^2  : 0.220142        (-0.122663      0.275937)
kT2 [keV]   : 33.3695        (-15.1467      165.33)
R2^2/D10^2  : 5.91390E-04    (-0.000517601   0.00409757)
------------------------------------------------------------
#Fit statistic : Chi-Squared =          57.91 using 59 PHA bins.
# Reduced chi-squared =          1.053 for     55 degrees of freedom
# Null hypothesis probability =   3.685151e-01

Energy  Fluence     90% Error
[keV]   [erg/cm2]   [erg/cm2]
15- 25  1.909e-07   7.112e-08
25- 50  3.092e-07   9.878e-08
50-150  5.357e-07   2.849e-07
15-150  1.036e-06   3.889e-07
Peak spectrum fit
Power-law model

Time interval is from   -0.024 sec. to    0.976 sec.

Spectral model in power-law:
------------------------------------------------------------
Parameters  : value       lower 90%   higher 90%
Photon index: 1.65765     ( -0.15835   0.161734 )
Norm@50keV  : 2.56355E-02    ( -0.00231729   0.00229481 )
------------------------------------------------------------
#Fit statistic : Chi-Squared =          55.99 using 59 PHA bins.
# Reduced chi-squared =         0.9822 for     57 degrees of freedom
# Null hypothesis probability =   5.130992e-01

Photon flux (15-150 keV)    in 1 sec: 3.35585 ( -0.294745  0.295747 ) ph/cm2/s
Energy fluence (15-150 keV)             : 2.3824e-07 ( -2.27954e-08  2.29997e-08 ) ergs/cm2
Cutoff power-law model
Time interval is from   -0.024 sec. to    0.976 sec.
Spectral model in the cutoff power-law:
------------------------------------------------------------
Parameters  : value       lower 90%   higher 90%
Photon index: 1.61724     ( -0.607417   0.850922 )
Epeak [keV] : 478.826      ( -478.314 -478.314 )
Norm@50keV  : 2.68595E-02    ( -0.00871504   0.0261677 )
------------------------------------------------------------
#Fit statistic : Chi-Squared =          55.97 using 59 PHA bins.
# Reduced chi-squared =         0.9995 for     56 degrees of freedom
# Null hypothesis probability =   4.759167e-01

Photon flux (15-150 keV)    in 1 sec: 3.34583 ( -0.3103  0.30333 ) ph/cm2/s
Energy fluence (15-150 keV)             : 2.37392e-07 ( -2.4664e-08  2.3727e-08 ) ergs/cm2
Band function
Time interval is from   -0.024 sec. to    0.976 sec.

Spectral model in the Band function:
------------------------------------------------------------
Parameters  : value       lower 90%   higher 90%
alpha       : -1.42468   ( 1.42488   1.42488 )
beta        : -1.65764    ( 1.65764   0.158327 )
Epeak [keV] : 28.8109      ( -28.7027 -28.7027 )
Norm@50keV   : 4.54208E-02    ( -0.0219877   0 )
------------------------------------------------------------
#Fit statistic : Chi-Squared =          55.99 using 59 PHA bins.
# Reduced chi-squared =          1.018 for     55 degrees of freedom
# Null hypothesis probability =   4.375852e-01

Photon flux (15-150 keV)    in 1 sec:  (    ) ph/cm2/s
Energy fluence (15-150 keV)             : 0 ( 0  0 ) ergs/cm2
Single BB

Spectral model blackbody:
------------------------------------------------------------
Parameters  : value    Lower 90%  Upper 90%
kT [keV]    : 14.1851  (-1.62154  1.86075)
R^2/D10^2   : 0.433916  (-0.154221   0.237455)
(R is the radius in km and D10 is the distance to the source in units of 10 kpc)
------------------------------------------------------------
#Fit statistic : Chi-Squared =          95.59 using 59 PHA bins.
# Reduced chi-squared =          1.677 for     57 degrees of freedom
# Null hypothesis probability =   1.036682e-03

Energy  Fluence     90% Error
[keV]   [erg/cm2]   [erg/cm2]
15- 25  1.842e-08   3.160e-09
25- 50  6.940e-08   7.870e-09
50-150  9.256e-08   1.707e-08
15-150  1.804e-07   2.070e-08
Thermal bremsstrahlung (OTTB)

Spectral model: thermal bremsstrahlung
------------------------------------------------------------
Parameters  : value         Lower 90%    Upper 90%
kT [keV]    : 160.316       (-54.9357      -161.569)
Norm        : 13.6074       (-1.30541     1.54762)
------------------------------------------------------------
#Fit statistic : Chi-Squared =          56.98 using 59 PHA bins.
# Reduced chi-squared =         0.9996 for     57 degrees of freedom
# Null hypothesis probability =   4.759336e-01

Energy  Fluence     90% Error
[keV]   [erg/cm2]   [erg/cm2]
15- 25  3.474e-08   4.830e-09
25- 50  6.500e-08   2.262e-08
50-150  1.318e-07   7.111e-08
15-150  2.315e-07   8.944e-08
Double BB

Spectral model: bbodyrad<1> + bbodyrad<2>
------------------------------------------------------------
Parameters  : value         Lower 90%    Upper 90%
kT1 [keV]   : 5.28287        (-1.49333      2.05461)
R1^2/D10^2  : 10.6373        (-7.53637      25.906)
kT2 [keV]   : 22.4751        (-4.29172      7.55603)
R2^2/D10^2  : 7.15175E-02    (-0.0468079   0.0568505)
------------------------------------------------------------
#Fit statistic : Chi-Squared =          57.22 using 59 PHA bins.
# Reduced chi-squared =          1.040 for     55 degrees of freedom
# Null hypothesis probability =   3.928426e-01

Energy  Fluence     90% Error
[keV]   [erg/cm2]   [erg/cm2]
15- 25  3.870e-08   1.625e-08
25- 50  5.938e-08   1.990e-08
50-150  1.351e-07   4.183e-08
15-150  2.331e-07   6.205e-08
Pre-slew spectrum (Pre-slew PHA with pre-slew DRM)
Power-law model

Spectral model in power-law:
------------------------------------------------------------
Parameters  : value       lower 90%   higher 90%
Photon index: 1.86747     ( -0.251182   0.262491 )
Norm@50keV  : 4.36091E-03    ( -0.000666751   0.000645565 )
------------------------------------------------------------
#Fit statistic : Chi-Squared =          46.65 using 59 PHA bins.
# Reduced chi-squared =         0.8183 for     57 degrees of freedom
# Null hypothesis probability =   8.345193e-01

Photon flux (15-150 keV)    in 8.725 sec: 0.617372 ( -0.0812791  0.0815609 ) ph/cm2/s
Energy fluence (15-150 keV)             : 3.49793e-07 ( -5.22465e-08  5.32108e-08 ) ergs/cm2
Cutoff power-law model

Spectral model in the cutoff power-law:
------------------------------------------------------------
Parameters  : value       lower 90%   higher 90%
Photon index: 2.49774     (     )
Epeak [keV] : 175.034      (   )
Norm@50keV  : 2.14039E-03    (     )
------------------------------------------------------------
#Fit statistic : Chi-Squared =          45.76 using 59 PHA bins.
# Reduced chi-squared =         0.8172 for     56 degrees of freedom
# Null hypothesis probability =   8.338339e-01

Photon flux (15-150 keV)    in 8.725 sec: 0.618913 ( -0.083274  0.080176 ) ph/cm2/s
Energy fluence (15-150 keV)             : 3.49203e-07 ( -5.16633e-08  5.37888e-08 ) ergs/cm2
Band function

Spectral model in the Band function:
------------------------------------------------------------
Parameters  : value       lower 90%   higher 90%
alpha       : -1.51110   ( 1.5111   1.5111 )
beta        : -1.86746    ( 1.86746   0.251157 )
Epeak [keV] : 15.1314      ( -15.1308 -15.1308 )
Norm@50keV   : 1.06725E-02    ( -0.0106726   3447.4 )
------------------------------------------------------------
#Fit statistic : Chi-Squared =          46.65 using 59 PHA bins.
# Reduced chi-squared =         0.8481 for     55 degrees of freedom
# Null hypothesis probability =   7.812631e-01

Photon flux (15-150 keV)    in 8.725 sec:  (    ) ph/cm2/s
Energy fluence (15-150 keV)             : 0 ( 0  0 ) ergs/cm2
S(25-50 keV) vs. S(50-100 keV) plot

S(25-50 keV)  = 2.97e-07
S(50-100 keV) = 3.10e-07
T90 vs. Hardness ratio plot
T90                                   = 98.6840000152588 sec.
Hardness ratio (energy fluence ratio) = 1.04377
Color vs. Color plot

Count Ratio  (25-50 keV) / (15-25 keV) = 0.99679
Count Ratio (50-100 keV) / (15-25 keV) = 0.501146
Mask shadow pattern
IMX = 4.595461485119394E-01, IMY = -4.694024223903498E-01
TIME vs. PHA plot around the trigger time
Blue+Cyan dotted lines: Time interval of the scaled map
From 0.000000 to 0.064000
TIME vs. DetID plot around the trigger time
Blue+Cyan dotted lines: Time interval of the scaled map
From 0.000000 to 0.064000
100 us light curve (15-350 keV)

Blue+Cyan dotted lines: Time interval of the scaled map
From 0.000000 to 0.064000
Spacecraft aspect plot
Bright source in the pre-burst/pre-slew/post-slew images
Pre-burst image of 15-350 keV band
Time interval of the image:
-186.899400 -0.024000

# RAcent  DECcent POSerr Theta    Phi  PeakCts   SNR AngSep     Name
#  [deg]    [deg]    ['] [deg]  [deg]                   [']
170.4474 -60.4695    6.1  26.2 -142.0  -0.3391  -1.9   10.0	Cen X-3
186.7901 -62.8613    4.6  19.3 -153.0   0.4330   2.5    6.6	GX 301-2
244.9760 -15.6399    0.3  42.7   33.5  18.4538  35.5    0.2	Sco X-1
256.2256 -37.9311    0.0  32.0   70.4  -0.6045  -1.6   12.5	4U 1700-377
256.4131 -36.4783    4.9  33.0   68.5   0.9660   2.4    3.5	GX 349+2
264.5032 -44.4410   46.5  33.8   86.7  -0.1112  -0.2   10.3	4U 1735-44
263.0285 -33.8460    4.4  38.9   70.9   1.9309   2.6    2.1	GX 354-0
266.0883 -34.9208    2.5  40.1   74.7   4.0195   4.7 ------	UNKNOWN
 93.5979 -60.2851    4.1  59.4 -163.1   3.8316   2.8 ------	UNKNOWN
151.9694 -40.5317    2.7  43.5 -114.6   3.2449   4.4 ------	UNKNOWN
Pre-slew background subtracted image of 15-350 keV band
Time interval of the image:
-0.024000 8.700600

# RAcent  DECcent POSerr Theta    Phi  PeakCts   SNR AngSep     Name
#  [deg]    [deg]    ['] [deg]  [deg]                   [']
170.2551 -60.8231    5.1  26.3 -142.8   0.0701   2.3   12.1	Cen X-3
186.5310 -62.8057   11.7  19.4 -152.7  -0.0265  -1.0    4.0	GX 301-2
245.0739 -15.6749    3.3  42.7   33.7   0.2778   3.5    5.8	Sco X-1
255.8512 -37.9829    5.3  31.7   70.2   0.1227   2.2   10.5	4U 1700-377
256.3124 -36.5795    0.0  32.9   68.5   0.0934   1.6   11.1	GX 349+2
264.6701 -44.3724    7.1  33.9   86.7   0.1085   1.6    5.6	4U 1735-44
263.1571 -33.7865    9.6  39.0   70.9  -0.1306  -1.2    8.9	GX 354-0
246.1799 -27.5253    0.9  33.3   45.6   0.6280  12.6 ------	UNKNOWN
200.0554 -27.1795    2.1  25.8  -43.2   0.1617   5.6 ------	UNKNOWN
Post-slew image of 15-350 keV band
Time interval of the image:
62.500630 303.065000

# RAcent  DECcent POSerr Theta    Phi  PeakCts   SNR AngSep     Name
#  [deg]    [deg]    ['] [deg]  [deg]                   [']
186.6857 -62.7305    3.8  51.9 -154.7   2.1969   3.0    2.5	GX 301-2
244.9809 -15.6433    0.1  11.9  -10.7  23.5581  96.1    0.2	Sco X-1
255.8007 -37.7054   11.3  13.0  139.3   0.2618   1.0   12.1	4U 1700-377
256.5420 -36.4436    3.3  12.5  133.4   0.9058   3.5    5.3	GX 349+2
262.8361 -24.6064    0.0  15.2   77.9  -0.3120  -1.2   12.6	GX 1+4
264.6613 -44.4744    6.5  22.5  139.0   0.5109   1.8    3.8	4U 1735-44
268.3720  -1.4676    1.8  33.6   38.1   2.6984   6.5    0.9	SW J1753.5-0127
270.2497 -24.9876    2.7  21.7   83.9   1.2591   4.2    5.8	GX 5-1
270.2970 -25.7805    2.3  21.5   86.1   1.4936   5.0    2.3	GRS 1758-258
274.1682 -14.1027    5.8  29.2   63.6   0.8209   2.0   10.3	GX 17+2
275.8812 -30.5117    8.2  26.0   98.9   0.5435   1.4    9.0	H1820-303
285.1172 -24.8848   20.2  34.8   89.9   0.3611   0.6    4.9	HT1900.1-2455
262.9803 -33.8293  169.3  15.7  113.0   0.0187   0.1    0.5	GX 354-0
250.5588  29.3055    3.8  57.0   -0.4   4.6772   3.0 ------	UNKNOWN
Plot creation:
Sun May 31 16:26:40 EDT 2015