Special notes of this burst
Image
Pre-slew 15.0-350.0 keV image (Event data)

#   RAcent    DECcent   POSerr    Theta     Phi              Peak Cts       SNR   Name
  200.0247   -32.0650   0.0150    39.9949  -113.2832         2.7383070     12.783 TRIG_00147788

Foreground time interval of the image:
-40.832  15.632 (delta_t =  56.464 [sec])
Background time interval of the image:
-299.472 -40.832 (delta_t = 258.640 [sec])
Lightcurves
Notes:
- 1) The mask-weighted light curves are using the flight position.
- 2) Multiple plots of different time binning/intervals are shown to cover all scenarios of short/long GRBs, rate/image triggers, and real/false positives.
- 3) For all the mask-weighted lightcurves, the y-axis units are counts/sec/det where a det is 0.4 x 0.4 = 0.16 sq cm.
- 4) The verticle lines correspond to following: green dotted lines are T50 interval, black dotted lines are T90 interval, blue solid line(s) is a spacecraft slew start time, and orange solid line(s) is a spacecraft slew end time.
- 5) Time of each bin is in the middle of the bin.
1 s binning
From T0-310 s to T0+310 s
From T100_start - 20 s to T100_end + 30 s

Full time interval

64 ms binning
Full time interval
From T100_start to T100_end

From T0-5 sec to T0+5 sec
16 ms binning
From T100_start-5 s to T100_start+5 s
8 ms binning
From T100_start-3 s to T100_start+3 s

2 ms binning
From T100_start-1 s to T100_start+1 s
SN=5 or 10 sec. binning (whichever binning is satisfied first)
SN=5 or 10 sec. binning (T < 200 sec)
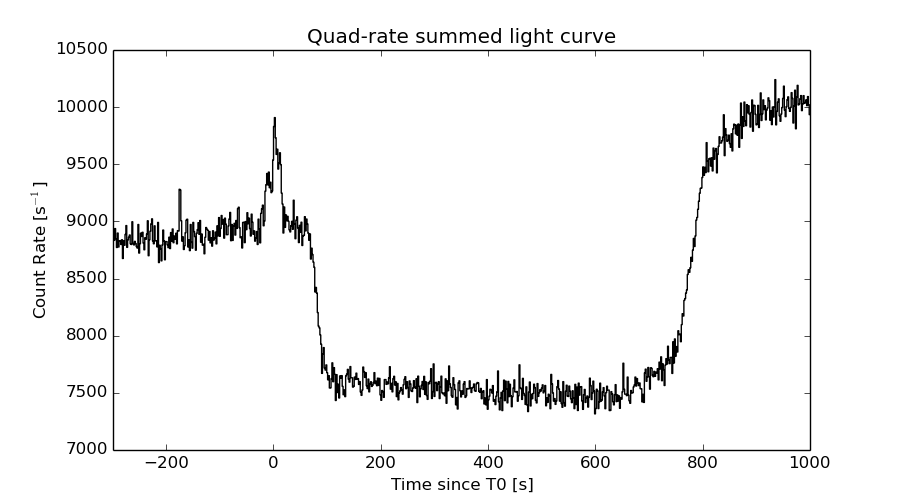
Quad-rate summed light curves (from T0-300s to T0+1000s)
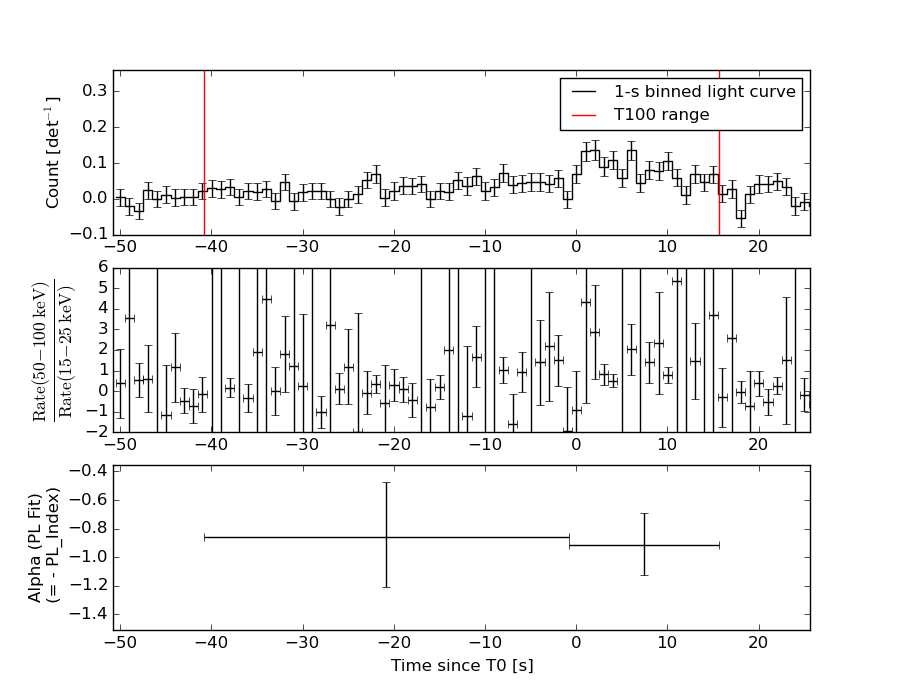
Spectral Evolution
Spectra
Notes:
- 1) The fitting includes the systematic errors.
- 2) When the burst includes telescope slew time periods, the fitting uses an average response file made from multiple 5-s response files through out the slew time plus single time preiod for the non-slew times, and weighted by the total counts in the corresponding time period using addrmf. An average response file is needed becuase a spectral fit using the pre-slew DRM will introduce some errors in both a spectral shape and a normalization if the PHA file contains a lot of the slew/post-slew time interval.
- 3) For fits to more complicated models (e.g. a power-law over a cutoff power-law), the BAT team has decided to require a chi-square improvement of more than 6 for each extra dof.
Time averaged spectrum fit using the average DRM
Power-law model
Time interval is from  -40.832 sec. to   15.632 sec.

Spectral model in power-law:
------------------------------------------------------------
Parameters  : value       lower 90%   higher 90%
Photon index: 0.883089     ( -0.210093   0.197988 )
Norm@50keV  : 3.07608E-03    ( -0.000382823   0.000374532 )
------------------------------------------------------------
#Fit statistic : Chi-Squared =          65.95 using 59 PHA bins.
# Reduced chi-squared =          1.157 for     57 degrees of freedom
# Null hypothesis probability =   1.949553e-01

Photon flux (15-150 keV)    in 56.46 sec: 0.353030 ( -0.0431119  0.0437129 ) ph/cm2/s
Energy fluence (15-150 keV)             : 1.9621e-06 ( -2.14047e-07  2.14165e-07 ) ergs/cm2
Cutoff power-law model

Time interval is from  -40.832 sec. to   15.632 sec.
Spectral model in the cutoff power-law:
------------------------------------------------------------
Parameters  : value       lower 90%   higher 90%
Photon index: 0.273832     ( -1.05259   0.61026 )
Epeak [keV] : 184.035      (   )
Norm@50keV  : 5.26188E-03    (     )
------------------------------------------------------------
#Fit statistic : Chi-Squared =          64.47 using 59 PHA bins.
# Reduced chi-squared =          1.151 for     56 degrees of freedom
# Null hypothesis probability =   2.045038e-01

Photon flux (15-150 keV)    in 56.46 sec: 0.341371 ( -0.045519  0.046382 ) ph/cm2/s
Energy fluence (15-150 keV)             : 1.93145e-06 ( -2.23723e-07  2.21114e-07 ) ergs/cm2
Band function

Time interval is from  -40.832 sec. to   15.632 sec.

Spectral model in the Band function:
------------------------------------------------------------
Parameters  : value       lower 90%   higher 90%
alpha       : -0.858335   ( 0.858337   0.858337 )
beta        : -0.883068    ( -0.198221   0.210023 )
Epeak [keV] : 12.8339      (   )
Norm@50keV   : 4.76171E-03    (     )
------------------------------------------------------------
#Fit statistic : Chi-Squared =          65.95 using 59 PHA bins.
# Reduced chi-squared =          1.199 for     55 degrees of freedom
# Null hypothesis probability =   1.481204e-01

Photon flux (15-150 keV)    in 56.46 sec:  (    ) ph/cm2/s
Energy fluence (15-150 keV)             : 0 ( 0  0 ) ergs/cm2
Single BB

Spectral model blackbody:
------------------------------------------------------------
Parameters  : value    Lower 90%  Upper 90%
kT [keV]    : 26.1742  (-3.59385  4.65189)
R^2/D10^2   : 7.62916E-03  (-0.0030107   0.00455018)
(R is the radius in km and D10 is the distance to the source in units of 10 kpc)
------------------------------------------------------------
#Fit statistic : Chi-Squared =          70.29 using 59 PHA bins.
# Reduced chi-squared =          1.233 for     57 degrees of freedom
# Null hypothesis probability =   1.111536e-01

Energy  Fluence     90% Error
[keV]   [erg/cm2]   [erg/cm2]
15- 25  5.000e-08   1.289e-08
25- 50  2.902e-07   5.654e-08
50-150  1.463e-06   2.433e-07
15-150  1.803e-06   2.764e-07
Thermal bremsstrahlung (OTTB)

Spectral model: thermal bremsstrahlung
------------------------------------------------------------
Parameters  : value         Lower 90%    Upper 90%
kT [keV]    : 200.000       (      )
Norm        : 1.56121       (-0.180994     0.180917)
------------------------------------------------------------
#Fit statistic : Chi-Squared =          99.23 using 59 PHA bins.
# Reduced chi-squared =          1.741 for     57 degrees of freedom
# Null hypothesis probability =   4.510348e-04

Energy  Fluence     90% Error
[keV]   [erg/cm2]   [erg/cm2]
15- 25  2.196e-07   1.215e-07
25- 50  4.225e-07   2.341e-07
50-150  9.266e-07   5.022e-07
15-150  1.569e-06   8.579e-07
Double BB

Spectral model: bbodyrad<1> + bbodyrad<2>
------------------------------------------------------------
Parameters  : value         Lower 90%    Upper 90%
kT1 [keV]   : 12.3384        (-9.21512      6.66136)
R1^2/D10^2  : 3.60977E-02        (-0.0238438      4.47585)
kT2 [keV]   : 40.6899        (-32.2382      -42.3748)
R2^2/D10^2  : 1.63063E-03    (-0.00140009   0.00639117)
------------------------------------------------------------
#Fit statistic : Chi-Squared =          64.48 using 59 PHA bins.
# Reduced chi-squared =          1.172 for     55 degrees of freedom
# Null hypothesis probability =   1.790404e-01

Energy  Fluence     90% Error
[keV]   [erg/cm2]   [erg/cm2]
15- 25  8.517e-08   5.050e-08
25- 50  3.469e-07   1.815e-07
50-150  1.499e-06   7.585e-07
15-150  1.931e-06   9.748e-07
Peak spectrum fit
Power-law model

Time interval is from    1.060 sec. to    2.060 sec.

Spectral model in power-law:
------------------------------------------------------------
Parameters  : value       lower 90%   higher 90%
Photon index: 1.06142     ( -0.457469   0.418868 )
Norm@50keV  : 1.18286E-02    ( -0.00305293   0.00297168 )
------------------------------------------------------------
#Fit statistic : Chi-Squared =          63.78 using 59 PHA bins.
# Reduced chi-squared =          1.119 for     57 degrees of freedom
# Null hypothesis probability =   2.503136e-01

Photon flux (15-150 keV)    in 1 sec: 1.36731 ( -0.3598  0.364499 ) ph/cm2/s
Energy fluence (15-150 keV)             : 1.25238e-07 ( -3.13365e-08  3.14628e-08 ) ergs/cm2
Cutoff power-law model

Time interval is from    1.060 sec. to    2.060 sec.
Spectral model in the cutoff power-law:
------------------------------------------------------------
Parameters  : value       lower 90%   higher 90%
Photon index: 1.05523     ( -0.550312   0.422837 )
Epeak [keV] : 9998.91      ( -9999.03 -9999.03 )
Norm@50keV  : 1.18948E-02    ( -0.00299627   0.0434098 )
------------------------------------------------------------
#Fit statistic : Chi-Squared =          63.78 using 59 PHA bins.
# Reduced chi-squared =          1.139 for     56 degrees of freedom
# Null hypothesis probability =   2.217737e-01

Photon flux (15-150 keV)    in 1 sec: 1.36852 ( -0.36101  0.36133 ) ph/cm2/s
Energy fluence (15-150 keV)             : 1.25235e-07 ( -1.5737e-08  3.1421e-08 ) ergs/cm2
Band function

Time interval is from    1.060 sec. to    2.060 sec.

Spectral model in the Band function:
------------------------------------------------------------
Parameters  : value       lower 90%   higher 90%
alpha       : 5.00000   ( -5   -5 )
beta        : -1.25557    ( -0.593087   0.530773 )
Epeak [keV] : 32.8704      ( -32.8632 53.8883 )
Norm@50keV   : 185.579    ( -44.3792   3.38605e+06 )
------------------------------------------------------------
#Fit statistic : Chi-Squared =          62.31 using 59 PHA bins.
# Reduced chi-squared =          1.133 for     55 degrees of freedom
# Null hypothesis probability =   2.323360e-01

Photon flux (15-150 keV)    in 1 sec:  (    ) ph/cm2/s
Energy fluence (15-150 keV)             : 0 ( 0  0 ) ergs/cm2
Single BB

Spectral model blackbody:
------------------------------------------------------------
Parameters  : value    Lower 90%  Upper 90%
kT [keV]    : 23.9152  (-8.19464  13.2475)
R^2/D10^2   : 3.64666E-02  (-0.026825   0.10281)
(R is the radius in km and D10 is the distance to the source in units of 10 kpc)
------------------------------------------------------------
#Fit statistic : Chi-Squared =          68.78 using 59 PHA bins.
# Reduced chi-squared =          1.207 for     57 degrees of freedom
# Null hypothesis probability =   1.364118e-01

Energy  Fluence     90% Error
[keV]   [erg/cm2]   [erg/cm2]
15- 25  3.707e-09   2.086e-09
25- 50  2.055e-08   1.067e-08
50-150  8.759e-08   4.600e-08
15-150  1.118e-07   5.956e-08
Thermal bremsstrahlung (OTTB)

Spectral model: thermal bremsstrahlung
------------------------------------------------------------
Parameters  : value         Lower 90%    Upper 90%
kT [keV]    : 200.000       (      )
Norm        : 5.85707       (-1.48281     1.48255)
------------------------------------------------------------
#Fit statistic : Chi-Squared =          67.76 using 59 PHA bins.
# Reduced chi-squared =          1.189 for     57 degrees of freedom
# Null hypothesis probability =   1.557306e-01

Energy  Fluence     90% Error
[keV]   [erg/cm2]   [erg/cm2]
15- 25  1.458e-08   8.925e-09
25- 50  2.806e-08   1.700e-08
50-150  6.153e-08   3.604e-08
15-150  1.042e-07   6.375e-08
Double BB

Spectral model: bbodyrad<1> + bbodyrad<2>
------------------------------------------------------------
Parameters  : value         Lower 90%    Upper 90%
kT1 [keV]   : 9.37483        (-4.03732      7.78692)
R1^2/D10^2  : 0.543037        (-0.464453      3.0664)
kT2 [keV]   : 55.5850        (-50.5898      -55.8763)
R2^2/D10^2  : 2.54598E-03    (-0.00244439   0.0239129)
------------------------------------------------------------
#Fit statistic : Chi-Squared =          62.36 using 59 PHA bins.
# Reduced chi-squared =          1.134 for     55 degrees of freedom
# Null hypothesis probability =   2.308544e-01

Energy  Fluence     90% Error
[keV]   [erg/cm2]   [erg/cm2]
15- 25  1.027e-08   6.195e-09
25- 50  2.728e-08   1.644e-08
50-150  8.794e-08   4.870e-08
15-150  1.255e-07   6.350e-08
Pre-slew spectrum (Pre-slew PHA with pre-slew DRM)
Power-law model

Spectral model in power-law:
------------------------------------------------------------
Parameters  : value       lower 90%   higher 90%
Photon index: 0.883089     ( -0.210093   0.197988 )
Norm@50keV  : 3.07608E-03    ( -0.000382823   0.000374532 )
------------------------------------------------------------
#Fit statistic : Chi-Squared =          65.95 using 59 PHA bins.
# Reduced chi-squared =          1.157 for     57 degrees of freedom
# Null hypothesis probability =   1.949553e-01

Photon flux (15-150 keV)    in 56.46 sec: 0.353030 ( -0.0431119  0.0437129 ) ph/cm2/s
Energy fluence (15-150 keV)             : 1.9621e-06 ( -2.14047e-07  2.14165e-07 ) ergs/cm2
Cutoff power-law model
Spectral model in the cutoff power-law:
------------------------------------------------------------
Parameters  : value       lower 90%   higher 90%
Photon index: 0.273832     ( -1.05259   0.61026 )
Epeak [keV] : 184.035      (   )
Norm@50keV  : 5.26188E-03    (     )
------------------------------------------------------------
#Fit statistic : Chi-Squared =          64.47 using 59 PHA bins.
# Reduced chi-squared =          1.151 for     56 degrees of freedom
# Null hypothesis probability =   2.045038e-01

Photon flux (15-150 keV)    in 56.46 sec: 0.341371 ( -0.045519  0.046382 ) ph/cm2/s
Energy fluence (15-150 keV)             : 1.93145e-06 ( -2.23723e-07  2.21114e-07 ) ergs/cm2
Band function

Spectral model in the Band function:
------------------------------------------------------------
Parameters  : value       lower 90%   higher 90%
alpha       : -0.858335   ( 0.858337   0.858337 )
beta        : -0.883068    ( -0.198221   0.210023 )
Epeak [keV] : 12.8339      (   )
Norm@50keV   : 4.76171E-03    (     )
------------------------------------------------------------
#Fit statistic : Chi-Squared =          65.95 using 59 PHA bins.
# Reduced chi-squared =          1.199 for     55 degrees of freedom
# Null hypothesis probability =   1.481204e-01

Photon flux (15-150 keV)    in 56.46 sec:  (    ) ph/cm2/s
Energy fluence (15-150 keV)             : 0 ( 0  0 ) ergs/cm2
S(25-50 keV) vs. S(50-100 keV) plot

S(25-50 keV)  = 3.36e-07
S(50-100 keV) = 7.28e-07
T90 vs. Hardness ratio plot
T90                                   = 46.4959999918938 sec.
Hardness ratio (energy fluence ratio) = 2.16667
Color vs. Color plot
Count Ratio  (25-50 keV) / (15-25 keV) = 1.49702
Count Ratio (50-100 keV) / (15-25 keV) = 2.11474
Mask shadow pattern

IMX = -3.316159402810754E-01, IMY = 7.706268201810363E-01
TIME vs. PHA plot around the trigger time

TIME vs. DetID plot around the trigger time

100 us light curve (15-350 keV)
Spacecraft aspect plot
Bright source in the pre-burst/pre-slew/post-slew images
Pre-burst image of 15-350 keV band
Time interval of the image:
-299.472000 -40.832000

# RAcent  DECcent POSerr Theta    Phi  PeakCts   SNR AngSep     Name
#  [deg]    [deg]    ['] [deg]  [deg]                   [']
186.5875 -62.7605    8.3  51.9 -155.1   0.7371   1.4    2.0	GX 301-2
244.9803 -15.6449    0.2  11.9  -10.7   8.9692  47.9    0.3	Sco X-1
256.0002 -37.8312    0.9  13.2  138.6   2.4235  13.0    1.0	4U 1700-377
256.3818 -36.4593    2.5  12.4  133.2   0.8611   4.6    3.4	GX 349+2
263.0204 -24.8838   11.8  15.3   78.7   0.2029   1.0    8.3	GX 1+4
264.6555 -44.5241    2.7  22.5  138.6   0.9915   4.3    5.8	4U 1735-44
268.3878  -1.5044    1.2  33.6   37.8   3.1693  10.0    3.3	SW J1753.5-0127
270.3415 -25.0364    2.0  21.8   83.7   1.2897   5.7    4.0	GX 5-1
270.2053 -25.7436    3.1  21.5   85.5   0.8173   3.8    5.3	GRS 1758-258
273.8598 -14.0798   18.1  29.1   62.9  -0.1874  -0.6    8.9	GX 17+2
275.7775 -30.5275    0.0  26.0   98.5   0.4367   1.7   12.3	H1820-303
284.9280 -24.9264    4.8  34.7   89.5   1.1010   2.4    5.9	HT1900.1-2455
262.8178 -33.9907    0.0  15.7  113.2  -0.3314  -1.5   12.7	GX 354-0
263.9226 -17.3030    3.4  19.3   56.5   0.7158   3.4 ------	UNKNOWN
251.4538 -45.6188    2.4  18.6  163.1   0.8916   4.8 ------	UNKNOWN
250.8211  29.4530    2.1  57.2   -0.4   6.3394   5.5 ------	UNKNOWN
183.7893 -49.7585    3.2  51.8 -138.5   4.4136   3.7 ------	UNKNOWN
206.1042 -10.3397    3.4  41.4  -78.6   3.3516   3.5 ------	UNKNOWN
194.9355 -33.9073    3.3  44.1 -116.7   3.3035   3.5 ------	UNKNOWN
Pre-slew background subtracted image of 15-350 keV band
Time interval of the image:
-40.832000 15.632000

# RAcent  DECcent POSerr Theta    Phi  PeakCts   SNR AngSep     Name
#  [deg]    [deg]    ['] [deg]  [deg]                   [']
186.7086 -62.7682   69.6  51.9 -155.2   0.0340   0.2    1.4	GX 301-2
244.9363 -15.4857    6.4  12.1  -10.9   0.1317   1.8    9.6	Sco X-1
256.1735 -37.8619    5.6  13.3  138.2   0.1546   2.1    8.9	4U 1700-377
256.6197 -36.4401    6.3  12.6  132.6   0.1283   1.8    9.0	GX 349+2
262.9617 -24.7775    4.1  15.3   78.2  -0.2317  -2.8    3.2	GX 1+4
264.8426 -44.5863   46.6  22.7  138.5  -0.0218  -0.2    9.2	4U 1735-44
268.4753  -1.3194    5.4  33.8   37.8   0.2600   2.1   10.3	SW J1753.5-0127
270.4489 -25.0652    9.9  21.9   83.9  -0.1150  -1.2    9.0	GX 5-1
270.3718 -25.6739   41.0  21.7   85.4  -0.0290  -0.3    5.6	GRS 1758-258
273.8554 -14.0485   60.9  29.1   62.8   0.0231   0.2    8.8	GX 17+2
275.9161 -30.3221   49.4  26.1   98.1  -0.0277  -0.2    2.7	H1820-303
284.9455 -24.8124   64.6  34.8   89.3   0.0329   0.2    8.1	HT1900.1-2455
263.0451 -33.6857    7.5  15.8  111.9  -0.1263  -1.5    9.4	GX 354-0
272.0830  -1.8915    2.1  35.7   43.3   0.7461   5.6 ------	UNKNOWN
240.4815  21.3600    2.2  49.2  -12.2   0.8237   5.1 ------	UNKNOWN
214.0982 -11.4012    2.7  34.1  -73.4   0.5623   4.3 ------	UNKNOWN
200.0247 -32.0650    0.9  40.0 -113.3   2.7384  12.8 ------	UNKNOWN
Post-slew image of 15-350 keV band
Time interval of the image:
108.828590 302.577900

# RAcent  DECcent POSerr Theta    Phi  PeakCts   SNR AngSep     Name
#  [deg]    [deg]    ['] [deg]  [deg]                   [']
135.5400 -40.6114    8.2  51.5 -143.5   0.7900   1.4    3.4	Vela X-1
170.6837 -60.6228    4.2  34.4 -179.4  -0.4362  -2.8   10.8	Cen X-3
186.5152 -62.6427    3.4  31.8  167.2   0.5671   3.4    8.6	GX 301-2
244.9690 -15.6360    1.0  43.8   54.3   6.4509  11.7    0.7	Sco X-1
242.3816 -72.8113    2.0  46.2  139.4   2.9147   5.7 ------	UNKNOWN
235.1686 -12.4912    2.9  37.6   42.2   1.0882   4.0 ------	UNKNOWN
231.8839 -40.6145    2.4  26.8   93.0   0.9799   4.8 ------	UNKNOWN
228.3617   2.0218    2.8  43.4   19.0   1.1096   4.1 ------	UNKNOWN
164.4030 -43.1352    2.7  30.1 -146.4   0.6341   4.3 ------	UNKNOWN
132.5305 -39.8684    3.4  53.9 -143.2   3.1122   3.4 ------	UNKNOWN
Plot creation:
Sun May 31 16:25:07 EDT 2015