Special notes of this burst
Image
Pre-slew 15.0-350.0 keV image (Event data)
#   RAcent    DECcent   POSerr    Theta     Phi              Peak Cts       SNR   Name
  204.1443   -21.9332   0.0120    19.7112  -176.2057         0.4792209     16.088 TRIG_00148522

Foreground time interval of the image:
  0.052   9.973 (delta_t =   9.921 [sec])
Background time interval of the image:
-299.728   0.052 (delta_t = 299.780 [sec])
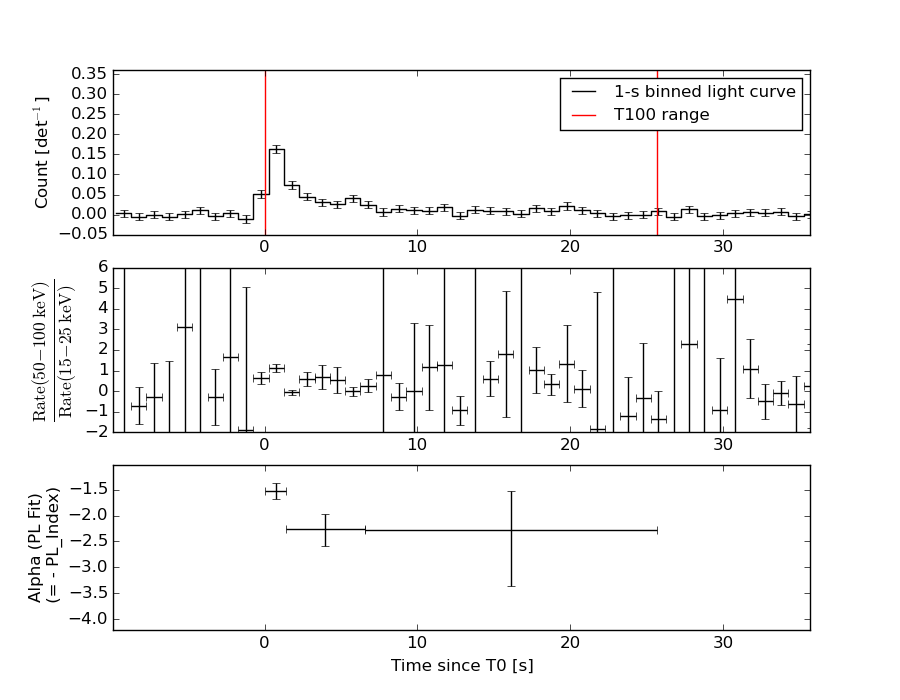
Lightcurves
Notes:
- 1) The mask-weighted light curves are using the flight position.
- 2) Multiple plots of different time binning/intervals are shown to cover all scenarios of short/long GRBs, rate/image triggers, and real/false positives.
- 3) For all the mask-weighted lightcurves, the y-axis units are counts/sec/det where a det is 0.4 x 0.4 = 0.16 sq cm.
- 4) The verticle lines correspond to following: green dotted lines are T50 interval, black dotted lines are T90 interval, blue solid line(s) is a spacecraft slew start time, and orange solid line(s) is a spacecraft slew end time.
- 5) Time of each bin is in the middle of the bin.
1 s binning
From T0-310 s to T0+310 s

From T100_start - 20 s to T100_end + 30 s
Full time interval

64 ms binning
Full time interval
From T100_start to T100_end
From T0-5 sec to T0+5 sec

16 ms binning
From T100_start-5 s to T100_start+5 s

8 ms binning
From T100_start-3 s to T100_start+3 s

2 ms binning
From T100_start-1 s to T100_start+1 s

SN=5 or 10 sec. binning (whichever binning is satisfied first)

SN=5 or 10 sec. binning (T < 200 sec)

Quad-rate summed light curves (from T0-300s to T0+1000s)

Spectral Evolution
Spectra
Notes:
- 1) The fitting includes the systematic errors.
- 2) When the burst includes telescope slew time periods, the fitting uses an average response file made from multiple 5-s response files through out the slew time plus single time preiod for the non-slew times, and weighted by the total counts in the corresponding time period using addrmf. An average response file is needed becuase a spectral fit using the pre-slew DRM will introduce some errors in both a spectral shape and a normalization if the PHA file contains a lot of the slew/post-slew time interval.
- 3) For fits to more complicated models (e.g. a power-law over a cutoff power-law), the BAT team has decided to require a chi-square improvement of more than 6 for each extra dof.
Time averaged spectrum fit using the average DRM
Power-law model

Time interval is from    0.052 sec. to   25.688 sec.

Spectral model in power-law:
------------------------------------------------------------
Parameters  : value       lower 90%   higher 90%
Photon index: 1.99585     ( -0.235874   0.252487 )
Norm@50keV  : 1.30627E-03    ( -0.000215471   0.000208924 )
------------------------------------------------------------
#Fit statistic : Chi-Squared =          56.82 using 59 PHA bins.
# Reduced chi-squared =         0.9968 for     57 degrees of freedom
# Null hypothesis probability =   4.818199e-01

Photon flux (15-150 keV)    in 25.64 sec: 0.195567 ( -0.0233625  0.0233627 ) ph/cm2/s
Energy fluence (15-150 keV)             : 3.088e-07 ( -4.67715e-08  4.83922e-08 ) ergs/cm2
Cutoff power-law model

Time interval is from    0.052 sec. to   25.688 sec.
Spectral model in the cutoff power-law:
------------------------------------------------------------
Parameters  : value       lower 90%   higher 90%
Photon index: 2.03359     ( -1.11184   0.0944296 )
Epeak [keV] : 35.9402      (   )
Norm@50keV  : 1.24072E-03    (     )
------------------------------------------------------------
#Fit statistic : Chi-Squared =          56.81 using 59 PHA bins.
# Reduced chi-squared =          1.015 for     56 degrees of freedom
# Null hypothesis probability =   4.444954e-01

Photon flux (15-150 keV)    in 25.64 sec: 0.195506 ( -0.023366  0.023345 ) ph/cm2/s
Energy fluence (15-150 keV)             : 3.0857e-07 ( -5.47224e-08  4.80365e-08 ) ergs/cm2
Band function

Time interval is from    0.052 sec. to   25.688 sec.

Spectral model in the Band function:
------------------------------------------------------------
Parameters  : value       lower 90%   higher 90%
alpha       : -1.49666   ( 1.48952   1.48952 )
beta        : -2.03587    ( 2.03593   0.272859 )
Epeak [keV] : 27.1399      ( -26.879 -26.879 )
Norm@50keV   : 2.99847E-03    ( -0.00101264   1424.63 )
------------------------------------------------------------
#Fit statistic : Chi-Squared =          56.75 using 59 PHA bins.
# Reduced chi-squared =          1.032 for     55 degrees of freedom
# Null hypothesis probability =   4.095274e-01

Photon flux (15-150 keV)    in 25.64 sec:  (    ) ph/cm2/s
Energy fluence (15-150 keV)             : 0 ( 0  0 ) ergs/cm2
Single BB
Spectral model blackbody:
------------------------------------------------------------
Parameters  : value    Lower 90%  Upper 90%
kT [keV]    : 9.37280  (-1.33151  1.5448)
R^2/D10^2   : 0.113740  (-0.050283   0.0915749)
(R is the radius in km and D10 is the distance to the source in units of 10 kpc)
------------------------------------------------------------
#Fit statistic : Chi-Squared =          72.96 using 59 PHA bins.
# Reduced chi-squared =          1.280 for     57 degrees of freedom
# Null hypothesis probability =   7.558335e-02

Energy  Fluence     90% Error
[keV]   [erg/cm2]   [erg/cm2]
15- 25  5.086e-08   1.083e-08
25- 50  1.151e-07   2.163e-08
50-150  4.963e-08   1.792e-08
15-150  2.156e-07   3.702e-08
Thermal bremsstrahlung (OTTB)

Spectral model: thermal bremsstrahlung
------------------------------------------------------------
Parameters  : value         Lower 90%    Upper 90%
kT [keV]    : 64.5717       (-21.525      41.6953)
Norm        : 0.985511       (-0.186661     0.239167)
------------------------------------------------------------
#Fit statistic : Chi-Squared =          58.08 using 59 PHA bins.
# Reduced chi-squared =          1.019 for     57 degrees of freedom
# Null hypothesis probability =   4.351555e-01

Energy  Fluence     90% Error
[keV]   [erg/cm2]   [erg/cm2]
15- 25  6.420e-08   1.035e-08
25- 50  9.987e-08   1.508e-08
50-150  1.206e-07   4.560e-08
15-150  2.847e-07   5.507e-08
Double BB

Spectral model: bbodyrad<1> + bbodyrad<2>
------------------------------------------------------------
Parameters  : value         Lower 90%    Upper 90%
kT1 [keV]   : 4.57883        (-1.80633      3.77101)
R1^2/D10^2  : 1.23370        (-1.0511      10.801)
kT2 [keV]   : 15.8323        (-4.71618      -15.9358)
R2^2/D10^2  : 1.16148E-02    (-0.011209   0.0351412)
------------------------------------------------------------
#Fit statistic : Chi-Squared =          58.90 using 59 PHA bins.
# Reduced chi-squared =          1.071 for     55 degrees of freedom
# Null hypothesis probability =   3.346609e-01

Energy  Fluence     90% Error
[keV]   [erg/cm2]   [erg/cm2]
15- 25  6.884e-08   3.710e-08
25- 50  9.239e-08   4.932e-08
50-150  1.133e-07   6.670e-08
15-150  2.745e-07   1.435e-07
Peak spectrum fit
Power-law model
Time interval is from    0.052 sec. to    1.052 sec.

Spectral model in power-law:
------------------------------------------------------------
Parameters  : value       lower 90%   higher 90%
Photon index: 1.37957     ( -0.157736   0.158144 )
Norm@50keV  : 1.21129E-02    ( -0.00111622   0.00111276 )
------------------------------------------------------------
#Fit statistic : Chi-Squared =          63.33 using 59 PHA bins.
# Reduced chi-squared =          1.111 for     57 degrees of freedom
# Null hypothesis probability =   2.629614e-01

Photon flux (15-150 keV)    in 1 sec: 1.46843 ( -0.135151  0.135275 ) ph/cm2/s
Energy fluence (15-150 keV)             : 1.17542e-07 ( -1.21062e-08  1.22134e-08 ) ergs/cm2
Cutoff power-law model

Time interval is from    0.052 sec. to    1.052 sec.
Spectral model in the cutoff power-law:
------------------------------------------------------------
Parameters  : value       lower 90%   higher 90%
Photon index: 1.10628     ( -0.668448   0.355672 )
Epeak [keV] : 167.064      ( -167.063 -167.063 )
Norm@50keV  : 1.65875E-02    ( -0.00541676   0.0182193 )
------------------------------------------------------------
#Fit statistic : Chi-Squared =          62.72 using 59 PHA bins.
# Reduced chi-squared =          1.120 for     56 degrees of freedom
# Null hypothesis probability =   2.501947e-01

Photon flux (15-150 keV)    in 1 sec: 1.45187 ( -0.14036  0.1378 ) ph/cm2/s
Energy fluence (15-150 keV)             : 1.15284e-07 ( -1.3228e-08  1.3187e-08 ) ergs/cm2
Band function

Time interval is from    0.052 sec. to    1.052 sec.

Spectral model in the Band function:
------------------------------------------------------------
Parameters  : value       lower 90%   higher 90%
alpha       : -1.07496   ( 1.07486   1.17962 )
beta        : -1.63850    ( 1.64546   0.403672 )
Epeak [keV] : 150.496      ( -150.556 -150.556 )
Norm@50keV   : 1.73020E-02    ( -0.00708293   1.06927e+06 )
------------------------------------------------------------
#Fit statistic : Chi-Squared =          62.70 using 59 PHA bins.
# Reduced chi-squared =          1.140 for     55 degrees of freedom
# Null hypothesis probability =   2.221090e-01

Photon flux (15-150 keV)    in 1 sec:  (    ) ph/cm2/s
Energy fluence (15-150 keV)             : 0 ( 0  0 ) ergs/cm2
Single BB
Spectral model blackbody:
------------------------------------------------------------
Parameters  : value    Lower 90%  Upper 90%
kT [keV]    : 16.5540  (-1.86877  2.14918)
R^2/D10^2   : 0.121585  (-0.0413833   0.0615568)
(R is the radius in km and D10 is the distance to the source in units of 10 kpc)
------------------------------------------------------------
#Fit statistic : Chi-Squared =          88.07 using 59 PHA bins.
# Reduced chi-squared =          1.545 for     57 degrees of freedom
# Null hypothesis probability =   5.166898e-03

Energy  Fluence     90% Error
[keV]   [erg/cm2]   [erg/cm2]
15- 25  6.833e-09   1.265e-09
25- 50  2.959e-08   3.870e-09
50-150  5.738e-08   1.047e-08
15-150  9.381e-08   1.140e-08
Thermal bremsstrahlung (OTTB)
Spectral model: thermal bremsstrahlung
------------------------------------------------------------
Parameters  : value         Lower 90%    Upper 90%
kT [keV]    : 200.000       (      )
Norm        : 6.04819       (-0.54917     0.54915)
------------------------------------------------------------
#Fit statistic : Chi-Squared =          66.01 using 59 PHA bins.
# Reduced chi-squared =          1.158 for     57 degrees of freedom
# Null hypothesis probability =   1.934893e-01

Energy  Fluence     90% Error
[keV]   [erg/cm2]   [erg/cm2]
15- 25  1.506e-08   4.013e-09
25- 50  2.897e-08   7.630e-09
50-150  6.354e-08   3.284e-08
15-150  1.076e-07   3.520e-08
Double BB

Spectral model: bbodyrad<1> + bbodyrad<2>
------------------------------------------------------------
Parameters  : value         Lower 90%    Upper 90%
kT1 [keV]   : 5.62326        (-1.53379      2.23442)
R1^2/D10^2  : 2.79851        (-1.92124      7.23793)
kT2 [keV]   : 23.4016        (-4.08611      7.34206)
R2^2/D10^2  : 3.23622E-02    (-0.0200747   0.0320626)
------------------------------------------------------------
#Fit statistic : Chi-Squared =          62.09 using 59 PHA bins.
# Reduced chi-squared =          1.129 for     55 degrees of freedom
# Null hypothesis probability =   2.382405e-01

Energy  Fluence     90% Error
[keV]   [erg/cm2]   [erg/cm2]
15- 25  1.383e-08   6.450e-09
25- 50  2.663e-08   8.225e-09
50-150  7.195e-08   2.922e-08
15-150  1.124e-07   3.514e-08
Pre-slew spectrum (Pre-slew PHA with pre-slew DRM)
Power-law model

Spectral model in power-law:
------------------------------------------------------------
Parameters  : value       lower 90%   higher 90%
Photon index: 1.96622     ( -0.18878   0.198795 )
Norm@50keV  : 2.71295E-03    ( -0.000350008   0.000341911 )
------------------------------------------------------------
#Fit statistic : Chi-Squared =          71.43 using 59 PHA bins.
# Reduced chi-squared =          1.253 for     57 degrees of freedom
# Null hypothesis probability =   9.454550e-02

Photon flux (15-150 keV)    in 9.921 sec: 0.400749 ( -0.0395085  0.0395137 ) ph/cm2/s
Energy fluence (15-150 keV)             : 2.47829e-07 ( -3.00705e-08  3.08222e-08 ) ergs/cm2
Cutoff power-law model
Spectral model in the cutoff power-law:
------------------------------------------------------------
Parameters  : value       lower 90%   higher 90%
Photon index: 1.50042     ( -0.958729   0.661155 )
Epeak [keV] : 44.4170      ( -42.2658 -44.4171 )
Norm@50keV  : 5.04863E-03    ( -0.00302322   0.013175 )
------------------------------------------------------------
#Fit statistic : Chi-Squared =          70.43 using 59 PHA bins.
# Reduced chi-squared =          1.258 for     56 degrees of freedom
# Null hypothesis probability =   9.284359e-02

Photon flux (15-150 keV)    in 9.921 sec: 0.392447 ( -0.040221  0.041781 ) ph/cm2/s
Energy fluence (15-150 keV)             : 2.34826e-07 ( -3.54646e-08  3.73407e-08 ) ergs/cm2
Band function
Spectral model in the Band function:
------------------------------------------------------------
Parameters  : value       lower 90%   higher 90%
alpha       : -1.53392   ( 1.57623   1.57623 )
beta        : -2.32258    ( 2.29805   0.480054 )
Epeak [keV] : 43.5622      ( -44.1788 -44.1788 )
Norm@50keV   : 4.86340E-03    ( -0.00237865   0 )
------------------------------------------------------------
#Fit statistic : Chi-Squared =          70.33 using 59 PHA bins.
# Reduced chi-squared =          1.279 for     55 degrees of freedom
# Null hypothesis probability =   7.981014e-02

Photon flux (15-150 keV)    in 9.921 sec:  (    ) ph/cm2/s
Energy fluence (15-150 keV)             : 2.35564e-07 ( 0  0 ) ergs/cm2
S(25-50 keV) vs. S(50-100 keV) plot
S(25-50 keV)  = 9.28e-08
S(50-100 keV) = 9.31e-08
T90 vs. Hardness ratio plot
T90                                   = 19.5680000185966 sec.
Hardness ratio (energy fluence ratio) = 1.00323
Color vs. Color plot

Count Ratio  (25-50 keV) / (15-25 keV) = 1.0534
Count Ratio (50-100 keV) / (15-25 keV) = 0.462722
Mask shadow pattern

IMX = -3.574877451686499E-01, IMY = 2.370835440290589E-02
TIME vs. PHA plot around the trigger time

TIME vs. DetID plot around the trigger time

100 us light curve (15-350 keV)
Spacecraft aspect plot

Bright source in the pre-burst/pre-slew/post-slew images
Pre-burst image of 15-350 keV band
Time interval of the image:
-299.728000 0.052000

# RAcent  DECcent POSerr Theta    Phi  PeakCts   SNR AngSep     Name
#  [deg]    [deg]    ['] [deg]  [deg]                   [']
244.9891 -15.6409    0.7  34.5   93.9  10.1188  17.4    0.6	Sco X-1
216.1827  17.4993    3.0  21.7   -7.8   0.9031   3.9 ------	UNKNOWN
198.1943  -4.7323    3.2  13.9 -112.9   0.8049   3.6 ------	UNKNOWN
206.4026  49.4060    3.6  53.4  -23.0   2.2253   3.2 ------	UNKNOWN
197.1370  46.4157    3.1  51.9  -31.5   3.0248   3.7 ------	UNKNOWN
181.2822  22.2274    4.5  39.8  -66.2   1.9274   2.6 ------	UNKNOWN
164.9354 -18.4378    3.3  48.3 -129.9   3.8492   3.5 ------	UNKNOWN
Pre-slew background subtracted image of 15-350 keV band
Time interval of the image:
0.052000 9.972600

# RAcent  DECcent POSerr Theta    Phi  PeakCts   SNR AngSep     Name
#  [deg]    [deg]    ['] [deg]  [deg]                   [']
244.8953 -15.7497    5.4  34.4   94.2   0.1473   2.2    8.2	Sco X-1
241.6667 -12.2938    2.3  30.5   89.5   0.2593   5.0 ------	UNKNOWN
204.1435 -21.9334    0.7  19.7 -176.2   0.4813  16.2 ------	UNKNOWN
163.7302 -25.6161    2.8  51.2 -138.7   0.5664   4.1 ------	UNKNOWN
Post-slew image of 15-350 keV band
Time interval of the image:
50.172600 302.352800

# RAcent  DECcent POSerr Theta    Phi  PeakCts   SNR AngSep     Name
#  [deg]    [deg]    ['] [deg]  [deg]                   [']
170.2177 -60.6191    3.4  45.3  179.2   1.1225   3.4    2.9	Cen X-3
186.5832 -62.6354    3.8  42.4  168.4   0.9532   3.0    8.3	GX 301-2
244.9886 -15.6652    0.8  39.1   64.6   8.7116  14.4    1.6	Sco X-1
150.9748 -26.4346    3.1  48.4 -129.9   2.9577   3.8 ------	UNKNOWN
Plot creation:
Sun May 31 16:11:36 EDT 2015