Click here for the BAT GCN circular template
Image
Pre-slew 15.0-350.0 keV image (Event data)

#   RAcent    DECcent   POSerr    Theta     Phi              Peak Cts       SNR   Name
  350.6460     5.7877   0.0085    34.6571    39.5558         1.6594723     22.602 TRIG_00148833

Foreground time interval of the image:
 59.584  81.501 (delta_t =  21.917 [sec])
Background time interval of the image:
-299.000  59.584 (delta_t = 358.584 [sec])
Lightcurves
Notes:
- 1) The mask-weighted light curves are using the flight position.
- 2) Multiple plots of different time binning/intervals are shown to cover all scenarios of short/long GRBs, rate/image triggers, and real/false positives.
- 3) For all the mask-weighted lightcurves, the y-axis units are counts/sec/det where a det is 0.4 x 0.4 = 0.16 sq cm.
- 4) The verticle lines correspond to following: green dotted lines are T50 interval, black dotted lines are T90 interval, blue solid line(s) is a spacecraft slew start time, and orange solid line(s) is a spacecraft slew end time.
- 5) Time of each bin is in the middle of the bin.
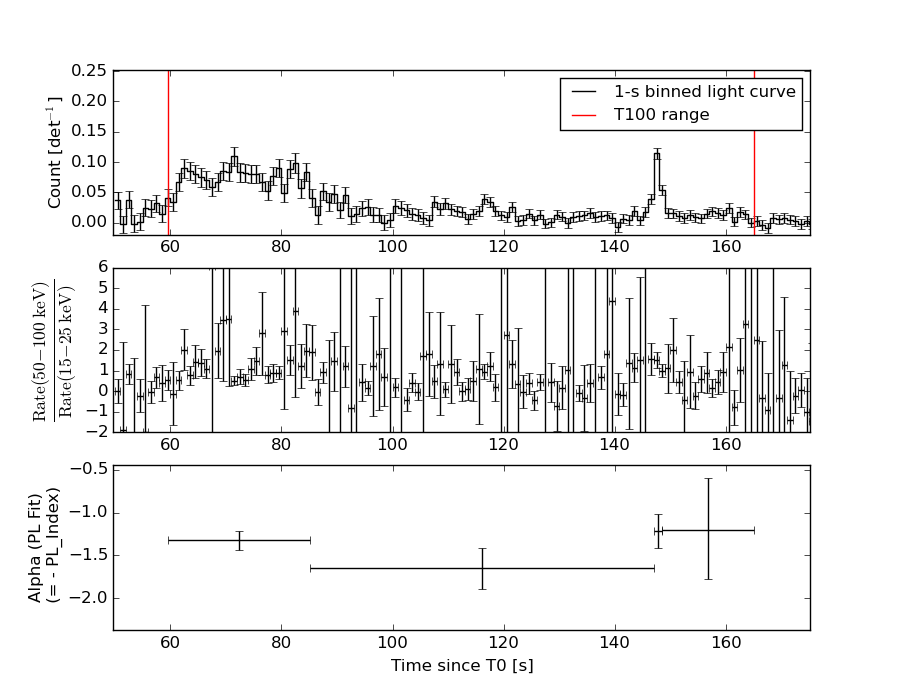
1 s binning
From T0-310 s to T0+310 s
From T100_start - 20 s to T100_end + 30 s

Full time interval

64 ms binning
Full time interval

From T100_start to T100_end

From T0-5 sec to T0+5 sec
16 ms binning
From T100_start-5 s to T100_start+5 s

Blue+Cyan dotted lines: Time interval of the scaled map
From 0.000000 to 72.000000
8 ms binning
From T100_start-3 s to T100_start+3 s

Blue+Cyan dotted lines: Time interval of the scaled map
From 0.000000 to 72.000000
2 ms binning
From T100_start-1 s to T100_start+1 s
Blue+Cyan dotted lines: Time interval of the scaled map
From 0.000000 to 72.000000
SN=5 or 10 sec. binning (whichever binning is satisfied first)

SN=5 or 10 sec. binning (T < 200 sec)
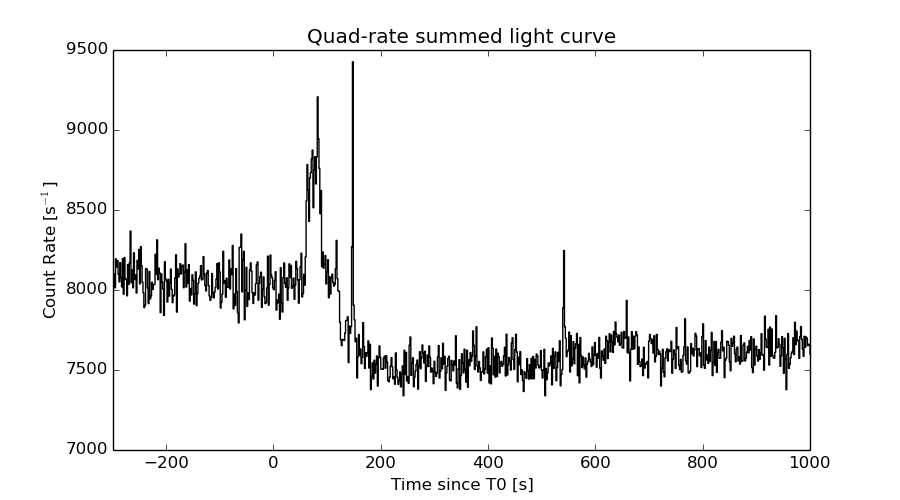
Quad-rate summed light curves (from T0-300s to T0+1000s)
Spectral Evolution
Spectra
Notes:
- 1) The fitting includes the systematic errors.
- 2) When the burst includes telescope slew time periods, the fitting uses an average response file made from multiple 5-s response files through out the slew time plus single time preiod for the non-slew times, and weighted by the total counts in the corresponding time period using addrmf. An average response file is needed becuase a spectral fit using the pre-slew DRM will introduce some errors in both a spectral shape and a normalization if the PHA file contains a lot of the slew/post-slew time interval.
- 3) For fits to more complicated models (e.g. a power-law over a cutoff power-law), the BAT team has decided to require a chi-square improvement of more than 6 for each extra dof.
Time averaged spectrum fit using the average DRM
Power-law model

Time interval is from   59.584 sec. to  165.124 sec.

Spectral model in power-law:
------------------------------------------------------------
Parameters  : value       lower 90%   higher 90%
Photon index: 1.39244     ( -0.10632   0.106045 )
Norm@50keV  : 2.11957E-03    ( -0.000121878   0.00012183 )
------------------------------------------------------------
#Fit statistic : Chi-Squared =          49.58 using 59 PHA bins.
# Reduced chi-squared =         0.8699 for     57 degrees of freedom
# Null hypothesis probability =   7.466557e-01

Photon flux (15-150 keV)    in 105.5 sec: 0.257684 ( -0.0156683  0.0157249 ) ph/cm2/s
Energy fluence (15-150 keV)             : 2.16408e-06 ( -1.35504e-07  1.36245e-07 ) ergs/cm2
Cutoff power-law model
Time interval is from   59.584 sec. to  165.124 sec.
Spectral model in the cutoff power-law:
------------------------------------------------------------
Parameters  : value       lower 90%   higher 90%
Photon index: 1.38911     ( -0.358903   0.141575 )
Epeak [keV] : 9999.20      (   )
Norm@50keV  : 2.12730E-03    ( -0.000122238   0.00106612 )
------------------------------------------------------------
#Fit statistic : Chi-Squared =          49.59 using 59 PHA bins.
# Reduced chi-squared =         0.8855 for     56 degrees of freedom
# Null hypothesis probability =   7.147080e-01

Photon flux (15-150 keV)    in 105.5 sec: 0.257627 ( -0.015411  0.015546 ) ph/cm2/s
Energy fluence (15-150 keV)             : 2.16412e-06 ( -1.41824e-07  1.35093e-07 ) ergs/cm2
Band function
Time interval is from   59.584 sec. to  165.124 sec.

Spectral model in the Band function:
------------------------------------------------------------
Parameters  : value       lower 90%   higher 90%
alpha       : -1.12657   ( 1.12656   1.12656 )
beta        : -1.39242    ( -0.106258   0.106342 )
Epeak [keV] : 34.9571      ( -34.9597 -34.9597 )
Norm@50keV   : 4.17219E-03    ( -0.00173627   511.663 )
------------------------------------------------------------
#Fit statistic : Chi-Squared =          49.58 using 59 PHA bins.
# Reduced chi-squared =         0.9015 for     55 degrees of freedom
# Null hypothesis probability =   6.809022e-01

Photon flux (15-150 keV)    in 105.5 sec:  (    ) ph/cm2/s
Energy fluence (15-150 keV)             : 0 ( 0  0 ) ergs/cm2
Single BB

Spectral model blackbody:
------------------------------------------------------------
Parameters  : value    Lower 90%  Upper 90%
kT [keV]    : 17.7508  (  )
R^2/D10^2   : 1.63406E-02  (   )
(R is the radius in km and D10 is the distance to the source in units of 10 kpc)
------------------------------------------------------------
#Fit statistic : Chi-Squared =         123.91 using 59 PHA bins.
# Reduced chi-squared =         2.1739 for     57 degrees of freedom
# Null hypothesis probability =   7.282594e-07

Energy  Fluence     90% Error
[keV]   [erg/cm2]   [erg/cm2]
15- 25  1.092e-07   1.280e-08
25- 50  4.999e-07   4.399e-08
50-150  1.139e-06   1.111e-07
15-150  1.748e-06   1.329e-07
Thermal bremsstrahlung (OTTB)
Spectral model: thermal bremsstrahlung
------------------------------------------------------------
Parameters  : value         Lower 90%    Upper 90%
kT [keV]    : 200.000       (      )
Norm        : 1.06973       (-0.0617661     0.0617569)
------------------------------------------------------------
#Fit statistic : Chi-Squared =          59.22 using 59 PHA bins.
# Reduced chi-squared =          1.039 for     57 degrees of freedom
# Null hypothesis probability =   3.945626e-01

Energy  Fluence     90% Error
[keV]   [erg/cm2]   [erg/cm2]
15- 25  2.811e-07   1.915e-08
25- 50  5.407e-07   4.315e-08
50-150  1.186e-06   2.034e-07
15-150  2.008e-06   2.653e-07
Double BB
Spectral model: bbodyrad<1> + bbodyrad<2>
------------------------------------------------------------
Parameters  : value         Lower 90%    Upper 90%
kT1 [keV]   : 5.64703        (-1.34033      1.84204)
R1^2/D10^2  : 0.533006        (-0.337028      1.1202)
kT2 [keV]   : 25.5298        (-3.54709      5.91645)
R2^2/D10^2  : 4.20323E-03    (-0.00215512   0.00292116)
------------------------------------------------------------
#Fit statistic : Chi-Squared =          53.54 using 59 PHA bins.
# Reduced chi-squared =         0.9735 for     55 degrees of freedom
# Null hypothesis probability =   5.304847e-01

Energy  Fluence     90% Error
[keV]   [erg/cm2]   [erg/cm2]
15- 25  2.669e-07   8.841e-08
25- 50  4.739e-07   8.356e-08
50-150  1.385e-06   2.274e-07
15-150  2.126e-06   2.801e-07
Peak spectrum fit
Power-law model

Time interval is from  147.108 sec. to  148.108 sec.

Spectral model in power-law:
------------------------------------------------------------
Parameters  : value       lower 90%   higher 90%
Photon index: 1.23417     ( -0.211519   0.208983 )
Norm@50keV  : 8.11185E-03    ( -0.000947142   0.000945399 )
------------------------------------------------------------
#Fit statistic : Chi-Squared =          46.18 using 59 PHA bins.
# Reduced chi-squared =         0.8102 for     57 degrees of freedom
# Null hypothesis probability =   8.466251e-01

Photon flux (15-150 keV)    in 1 sec: 0.956997 ( -0.112379  0.112512 ) ph/cm2/s
Energy fluence (15-150 keV)             : 8.15264e-08 ( -1.09392e-08  1.10615e-08 ) ergs/cm2
Cutoff power-law model

Time interval is from  147.108 sec. to  148.108 sec.
Spectral model in the cutoff power-law:
------------------------------------------------------------
Parameters  : value       lower 90%   higher 90%
Photon index: 2.40047     ( -0.299427   0.202002 )
Epeak [keV] : 132.114      ( -9999.36 -9999.36 )
Norm@50keV  : 1.68063E-03    (     )
------------------------------------------------------------
#Fit statistic : Chi-Squared =          45.88 using 59 PHA bins.
# Reduced chi-squared =         0.8193 for     56 degrees of freedom
# Null hypothesis probability =   8.306485e-01

Photon flux (15-150 keV)    in 1 sec: 0.958048 ( -0.113184  0.111422 ) ph/cm2/s
Energy fluence (15-150 keV)             : 8.15961e-08 ( -1.09992e-08  1.06798e-08 ) ergs/cm2
Band function

Time interval is from  147.108 sec. to  148.108 sec.

Spectral model in the Band function:
------------------------------------------------------------
Parameters  : value       lower 90%   higher 90%
alpha       : 4.73891   ( -4.73891   -4.73891 )
beta        : -1.28925    ( -0.240925   0.231238 )
Epeak [keV] : 23.8889      ( -23.8889 7.71786 )
Norm@50keV   : 572.117    ( -66.2332   2.62108e+06 )
------------------------------------------------------------
#Fit statistic : Chi-Squared =          45.74 using 59 PHA bins.
# Reduced chi-squared =         0.8317 for     55 degrees of freedom
# Null hypothesis probability =   8.087344e-01

Photon flux (15-150 keV)    in 1 sec:  (    ) ph/cm2/s
Energy fluence (15-150 keV)             : 0 ( 0  0 ) ergs/cm2
Single BB
Spectral model blackbody:
------------------------------------------------------------
Parameters  : value    Lower 90%  Upper 90%
kT [keV]    : 16.9594  (-3.20522  4.35048)
R^2/D10^2   : 7.20375E-02  (-0.0372683   0.0726331)
(R is the radius in km and D10 is the distance to the source in units of 10 kpc)
------------------------------------------------------------
#Fit statistic : Chi-Squared =          75.01 using 59 PHA bins.
# Reduced chi-squared =          1.316 for     57 degrees of freedom
# Null hypothesis probability =   5.509435e-02

Energy  Fluence     90% Error
[keV]   [erg/cm2]   [erg/cm2]
15- 25  4.223e-09   1.063e-09
25- 50  1.865e-08   3.475e-09
50-150  3.826e-08   9.130e-09
15-150  6.113e-08   1.080e-08
Thermal bremsstrahlung (OTTB)

Spectral model: thermal bremsstrahlung
------------------------------------------------------------
Parameters  : value         Lower 90%    Upper 90%
kT [keV]    : 200.000       (      )
Norm        : 3.89612       (-0.459969     0.459959)
------------------------------------------------------------
#Fit statistic : Chi-Squared =          53.43 using 59 PHA bins.
# Reduced chi-squared =         0.9374 for     57 degrees of freedom
# Null hypothesis probability =   6.096230e-01

Energy  Fluence     90% Error
[keV]   [erg/cm2]   [erg/cm2]
15- 25  9.700e-09   5.440e-09
25- 50  1.866e-08   1.024e-08
50-150  4.092e-08   2.265e-08
15-150  6.929e-08   3.777e-08
Double BB

Spectral model: bbodyrad<1> + bbodyrad<2>
------------------------------------------------------------
Parameters  : value         Lower 90%    Upper 90%
kT1 [keV]   : 8.33709        (-1.92777      2.35576)
R1^2/D10^2  : 0.595567        (-0.330673      0.836633)
kT2 [keV]   : 56.6554        (-24.2738      -56.6555)
R2^2/D10^2  : 1.71339E-03    (-0.00146577   0.00471043)
------------------------------------------------------------
#Fit statistic : Chi-Squared =          42.25 using 59 PHA bins.
# Reduced chi-squared =         0.7681 for     55 degrees of freedom
# Null hypothesis probability =   8.962094e-01

Energy  Fluence     90% Error
[keV]   [erg/cm2]   [erg/cm2]
15- 25  8.249e-09   3.307e-09
25- 50  1.851e-08   6.593e-09
50-150  5.963e-08   3.199e-08
15-150  8.639e-08   3.942e-08
Pre-slew spectrum (Pre-slew PHA with pre-slew DRM)
Power-law model

Spectral model in power-law:
------------------------------------------------------------
Parameters  : value       lower 90%   higher 90%
Photon index: 1.36905     ( -0.121054   0.120292 )
Norm@50keV  : 5.26702E-03    ( -0.00036455   0.000364484 )
------------------------------------------------------------
#Fit statistic : Chi-Squared =          81.32 using 59 PHA bins.
# Reduced chi-squared =          1.427 for     57 degrees of freedom
# Null hypothesis probability =   1.890536e-02

Photon flux (15-150 keV)    in 21.92 sec: 0.637063 ( -0.0464034  0.0465209 ) ph/cm2/s
Energy fluence (15-150 keV)             : 1.12287e-06 ( -8.38806e-08  8.42129e-08 ) ergs/cm2
Cutoff power-law model
Spectral model in the cutoff power-law:
------------------------------------------------------------
Parameters  : value       lower 90%   higher 90%
Photon index: 0.946520     ( -0.571858   0.467547 )
Epeak [keV] : 132.331      ( -48.0469 -132.342 )
Norm@50keV  : 8.40067E-03    ( -0.00329328   0.00710352 )
------------------------------------------------------------
#Fit statistic : Chi-Squared =          79.29 using 59 PHA bins.
# Reduced chi-squared =          1.416 for     56 degrees of freedom
# Null hypothesis probability =   2.198231e-02

Photon flux (15-150 keV)    in 21.92 sec: 0.624400 ( -0.04904  0.048856 ) ph/cm2/s
Energy fluence (15-150 keV)             : 1.09423e-06 ( -9.25177e-08  9.16103e-08 ) ergs/cm2
Band function

Spectral model in the Band function:
------------------------------------------------------------
Parameters  : value       lower 90%   higher 90%
alpha       : -0.716480   ( -0.596887   1.34459 )
beta        : -1.65802    ( 1.64906   0.308224 )
Epeak [keV] : 95.1060      ( -39.4707 329.53 )
Norm@50keV   : 1.12822E-02    ( -0.00647574   131.596 )
------------------------------------------------------------
#Fit statistic : Chi-Squared =          78.50 using 59 PHA bins.
# Reduced chi-squared =          1.427 for     55 degrees of freedom
# Null hypothesis probability =   2.043063e-02

Photon flux (15-150 keV)    in 21.92 sec:  (    ) ph/cm2/s
Energy fluence (15-150 keV)             : 0 ( 0  0 ) ergs/cm2
S(25-50 keV) vs. S(50-100 keV) plot

S(25-50 keV)  = 5.07e-07
S(50-100 keV) = 7.72e-07
T90 vs. Hardness ratio plot

T90                                   = 88.1240000128746 sec.
Hardness ratio (energy fluence ratio) = 1.52268
Color vs. Color plot

Count Ratio  (25-50 keV) / (15-25 keV) = 1.26087
Count Ratio (50-100 keV) / (15-25 keV) = 1.10484
Mask shadow pattern

IMX = 5.330146659035959E-01, IMY = -4.402563902034786E-01
TIME vs. PHA plot around the trigger time
Blue+Cyan dotted lines: Time interval of the scaled map
From 0.000000 to 72.000000
TIME vs. DetID plot around the trigger time
Blue+Cyan dotted lines: Time interval of the scaled map
From 0.000000 to 72.000000
100 us light curve (15-350 keV)

Blue+Cyan dotted lines: Time interval of the scaled map
From 0.000000 to 72.000000
Spacecraft aspect plot

Bright source in the pre-burst/pre-slew/post-slew images
Pre-burst image of 15-350 keV band
Time interval of the image:
-299.000000 59.584000

# RAcent  DECcent POSerr Theta    Phi  PeakCts   SNR AngSep     Name
#  [deg]    [deg]    ['] [deg]  [deg]                   [']
299.5925  35.2004    0.3  31.1  156.9  12.8958  40.5    0.1	Cyg X-1
308.0973  40.9182    1.0  23.4  166.2   2.4185  11.6    2.1	Cyg X-3
325.9843  38.3560    4.9   9.9  153.0   0.5280   2.4    9.1	Cyg X-2
273.4155  28.5039    2.2  54.1  161.1   5.8975   5.2 ------	UNKNOWN
308.0689  37.6590    1.4  23.9  158.2   1.8756   8.1 ------	UNKNOWN
 34.7657  62.6406    3.0  41.0  -83.4   4.4559   3.8 ------	UNKNOWN
Pre-slew background subtracted image of 15-350 keV band
Time interval of the image:
59.584000 81.500600

# RAcent  DECcent POSerr Theta    Phi  PeakCts   SNR AngSep     Name
#  [deg]    [deg]    ['] [deg]  [deg]                   [']
299.4096  35.0919  175.8  31.3  156.8  -0.0036  -0.1   11.0	Cyg X-1
308.0245  41.1050   18.0  23.5  166.7  -0.0292  -0.6    9.9	Cyg X-3
326.2868  38.1431 1059.1   9.7  151.6  -0.0004  -0.0   12.0	Cyg X-2
350.6461   5.7877    0.5  34.7   39.6   1.6596  22.6 ------	UNKNOWN
297.1953  37.6910    2.7  32.3  162.5   0.2190   4.3 ------	UNKNOWN
291.0749  46.7117    2.8  35.3  179.8   0.2306   4.1 ------	UNKNOWN
Post-slew image of 15-350 keV band
Time interval of the image:
140.100590 303.111900

# RAcent  DECcent POSerr Theta    Phi  PeakCts   SNR AngSep     Name
#  [deg]    [deg]    ['] [deg]  [deg]                   [']
308.0062  40.8971    5.7  51.8  172.6   0.7448   2.0    5.8	Cyg X-3
326.1943  38.1347    0.0  39.2 -177.7  -0.3381  -2.0   11.3	Cyg X-2
356.5260 -38.3625    2.2  44.5   26.7   1.3801   5.2 ------	UNKNOWN
329.3347  12.7007    2.9  22.1  143.0   0.5110   4.0 ------	UNKNOWN
310.4249  47.5852    2.7  54.1 -179.3   1.6677   4.3 ------	UNKNOWN
Plot creation:
Sun May 31 16:07:51 EDT 2015