Special notes of this burst
Image
Pre-slew 15.0-350.0 keV image (Event data)
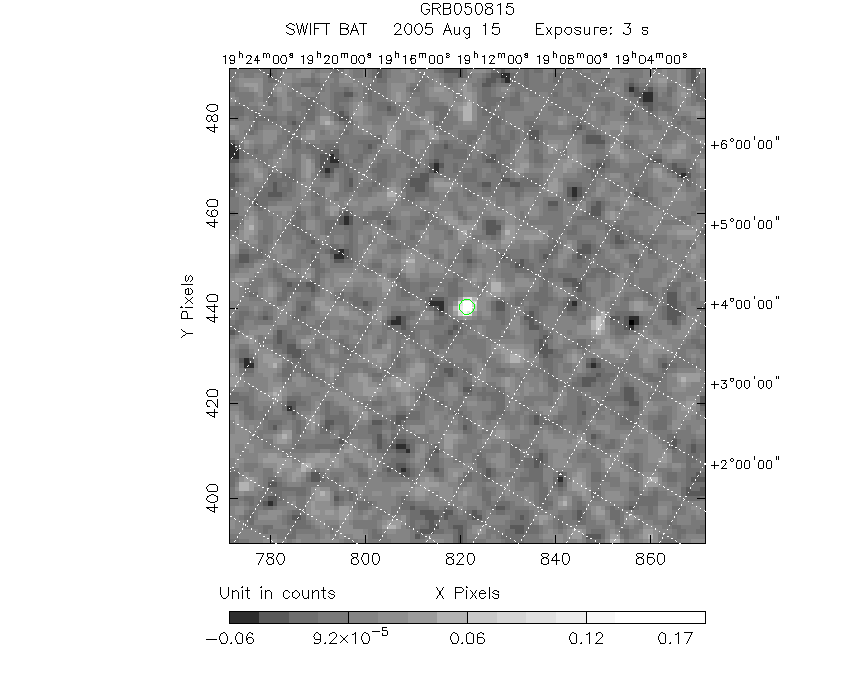
#   RAcent    DECcent   POSerr    Theta     Phi              Peak Cts       SNR   Name
  293.5860     9.1392   0.0173     8.2108    31.9231         0.1986825     11.113 TRIG_00150532

Foreground time interval of the image:
 -0.728   2.724 (delta_t =   3.452 [sec])
Background time interval of the image:
-299.400  -0.728 (delta_t = 298.672 [sec])
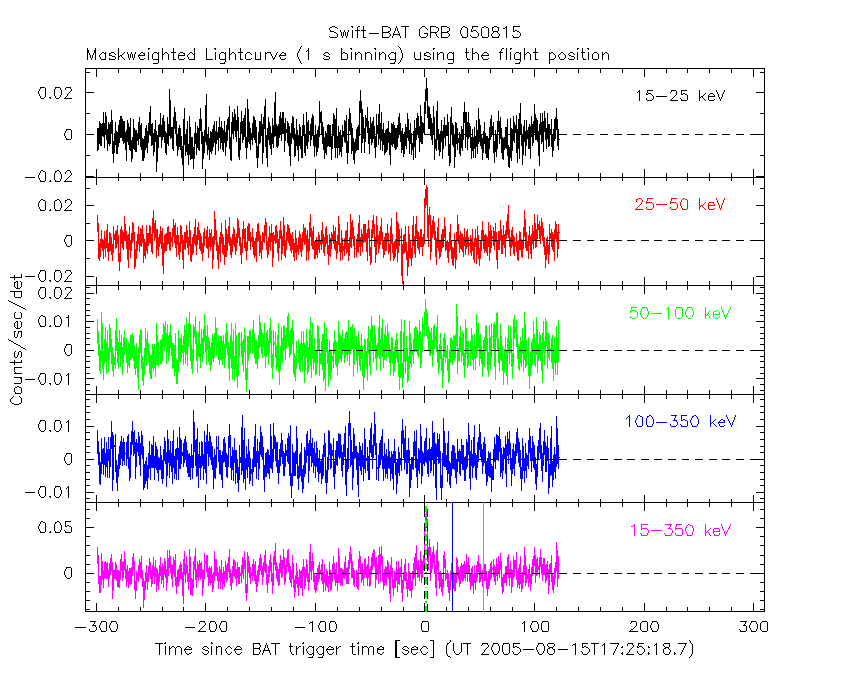
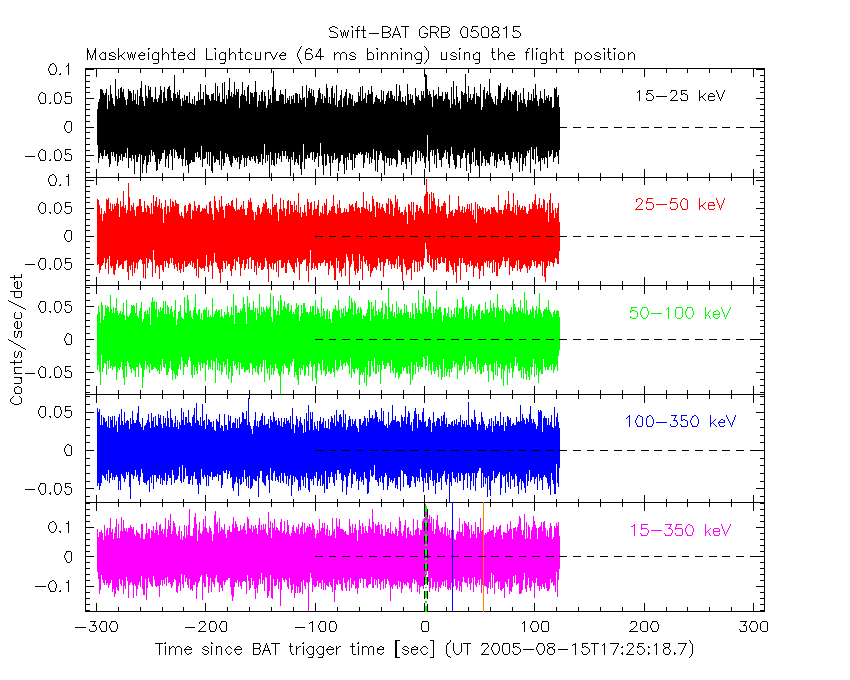
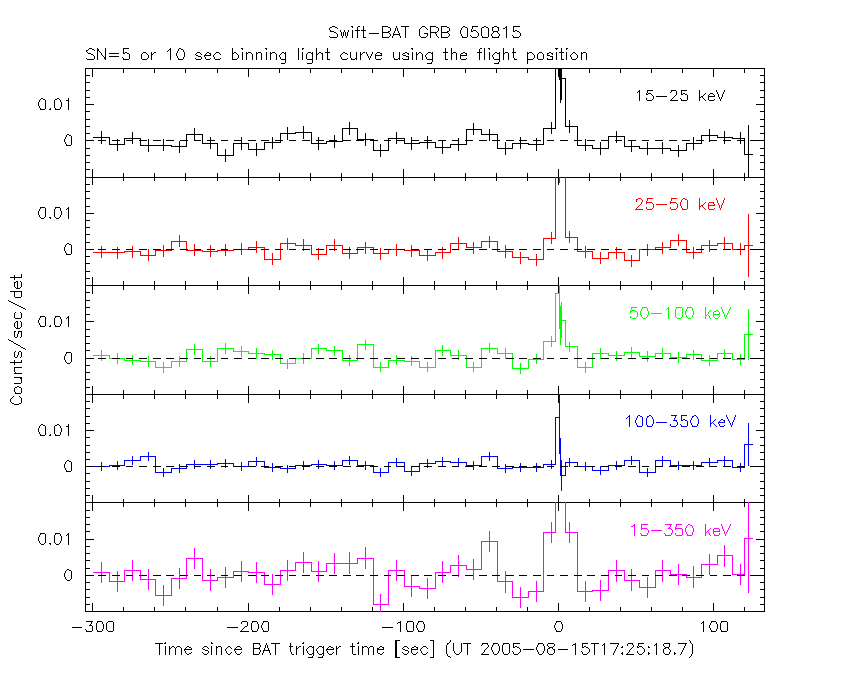
Lightcurves
Notes:
- 1) The mask-weighted light curves are using the flight position.
- 2) Multiple plots of different time binning/intervals are shown to cover all scenarios of short/long GRBs, rate/image triggers, and real/false positives.
- 3) For all the mask-weighted lightcurves, the y-axis units are counts/sec/det where a det is 0.4 x 0.4 = 0.16 sq cm.
- 4) The verticle lines correspond to following: green dotted lines are T50 interval, black dotted lines are T90 interval, blue solid line(s) is a spacecraft slew start time, and orange solid line(s) is a spacecraft slew end time.
- 5) Time of each bin is in the middle of the bin.
1 s binning
From T0-310 s to T0+310 s
From T100_start - 20 s to T100_end + 30 s
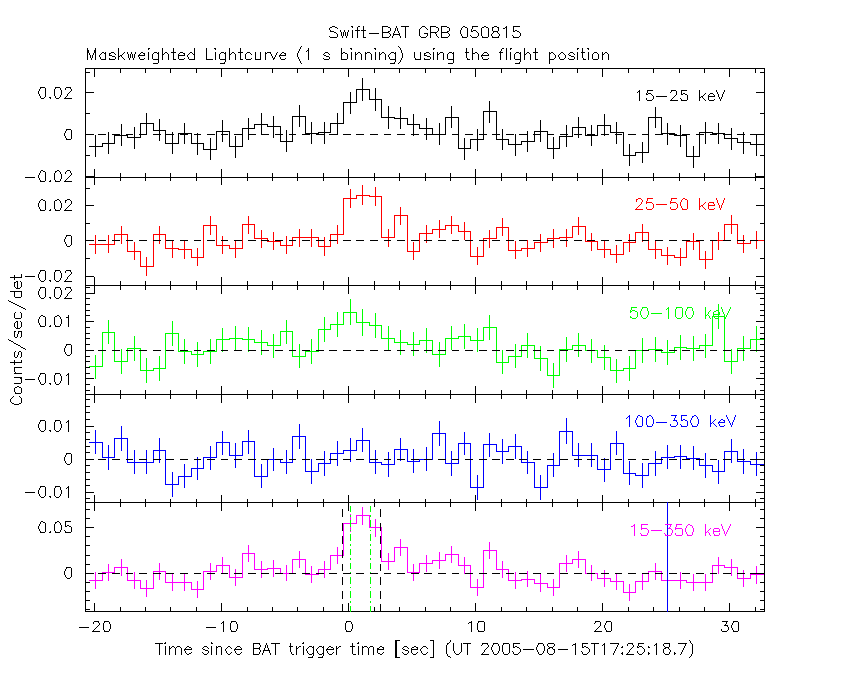
Full time interval

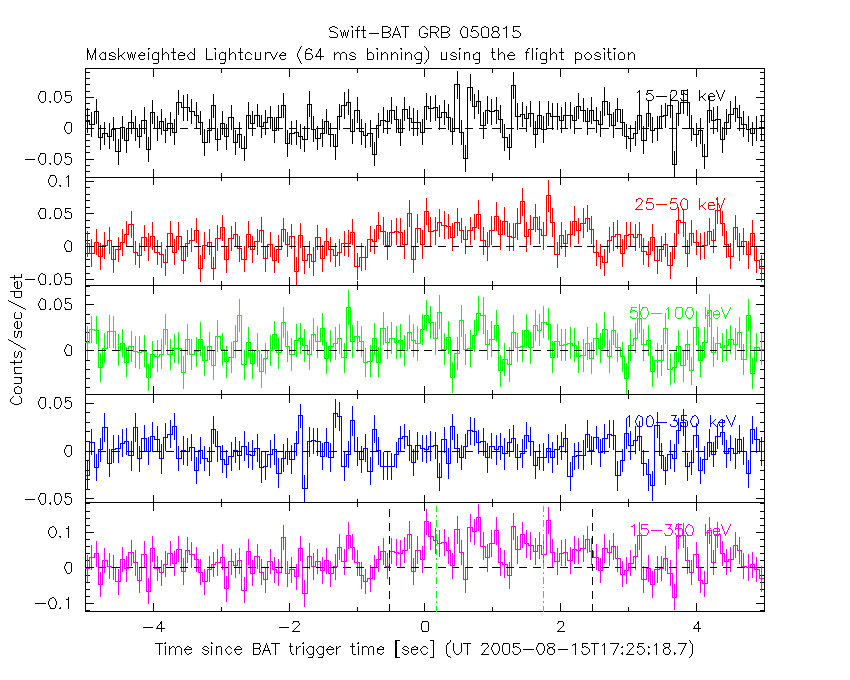
64 ms binning
Full time interval
From T100_start to T100_end
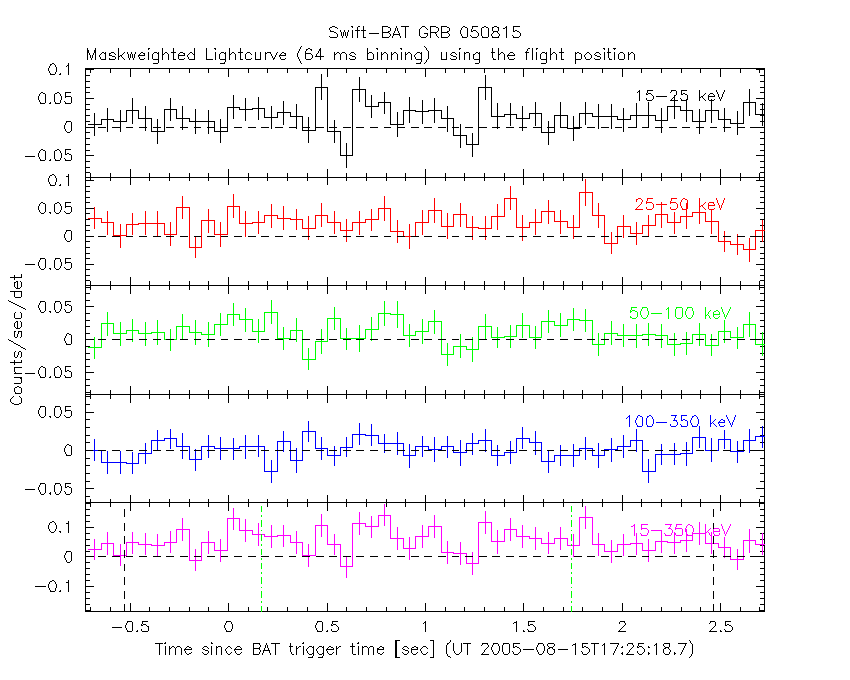
From T0-5 sec to T0+5 sec
16 ms binning
From T100_start-5 s to T100_start+5 s
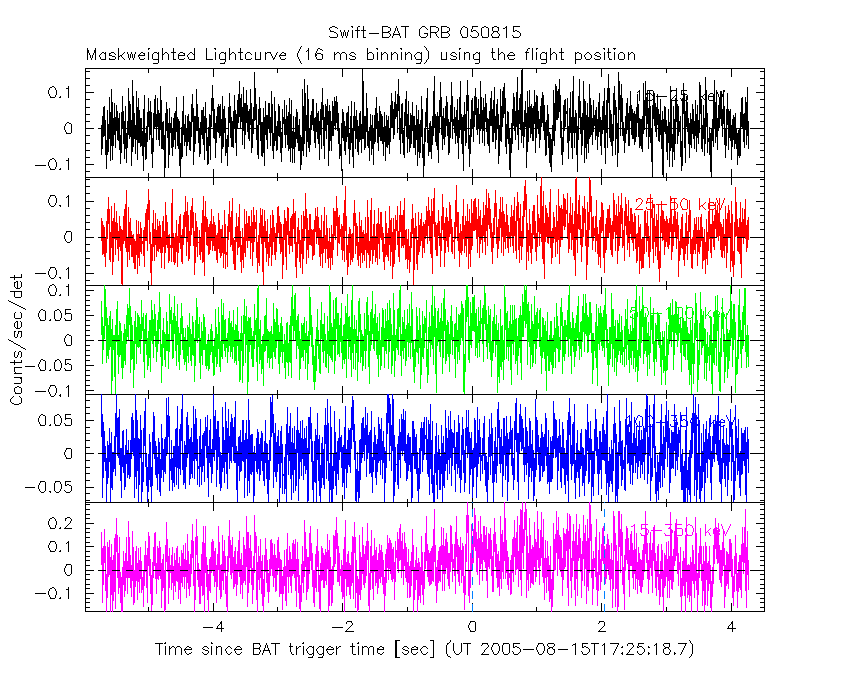
Blue+Cyan dotted lines: Time interval of the scaled map
From 0.000000 to 2.048000
8 ms binning
From T100_start-3 s to T100_start+3 s
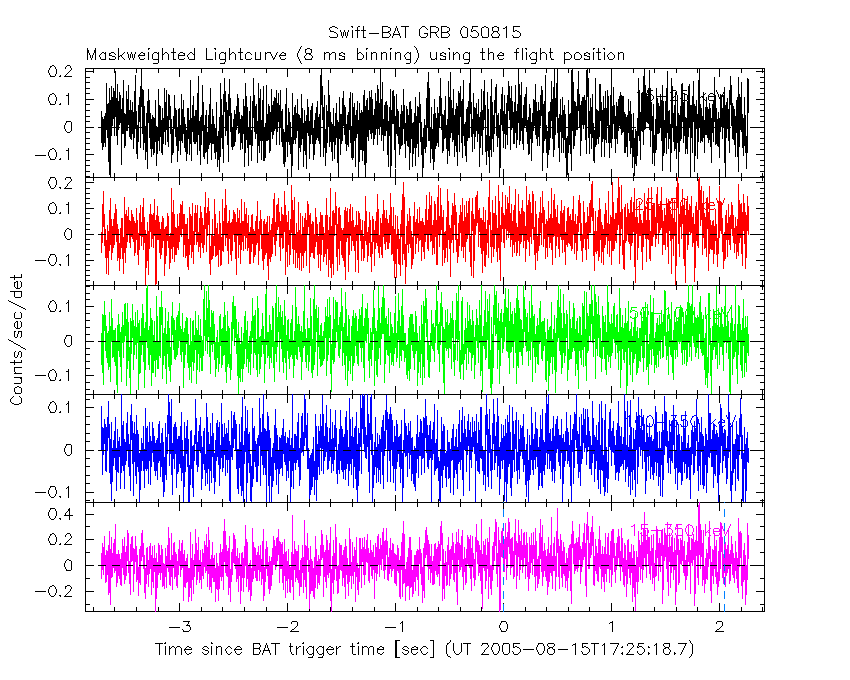
Blue+Cyan dotted lines: Time interval of the scaled map
From 0.000000 to 2.048000
2 ms binning
From T100_start-1 s to T100_start+1 s
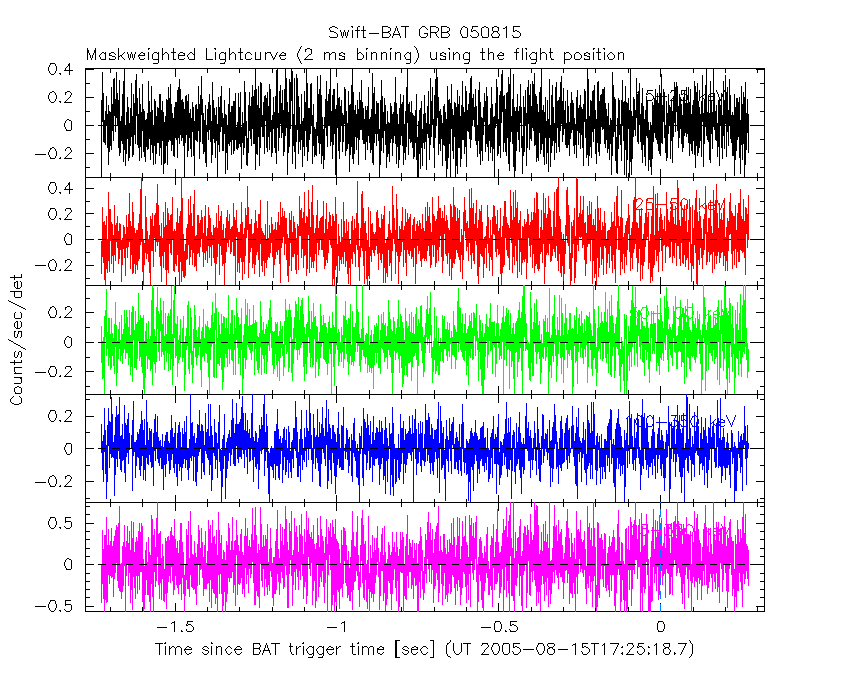
Blue+Cyan dotted lines: Time interval of the scaled map
From 0.000000 to 2.048000
SN=5 or 10 sec. binning (whichever binning is satisfied first)

SN=5 or 10 sec. binning (T < 200 sec)
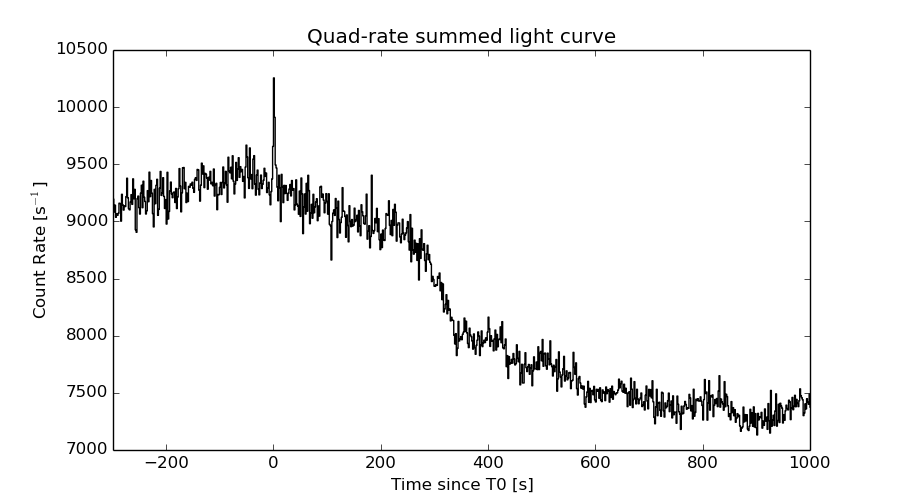
Quad-rate summed light curves (from T0-300s to T0+1000s)
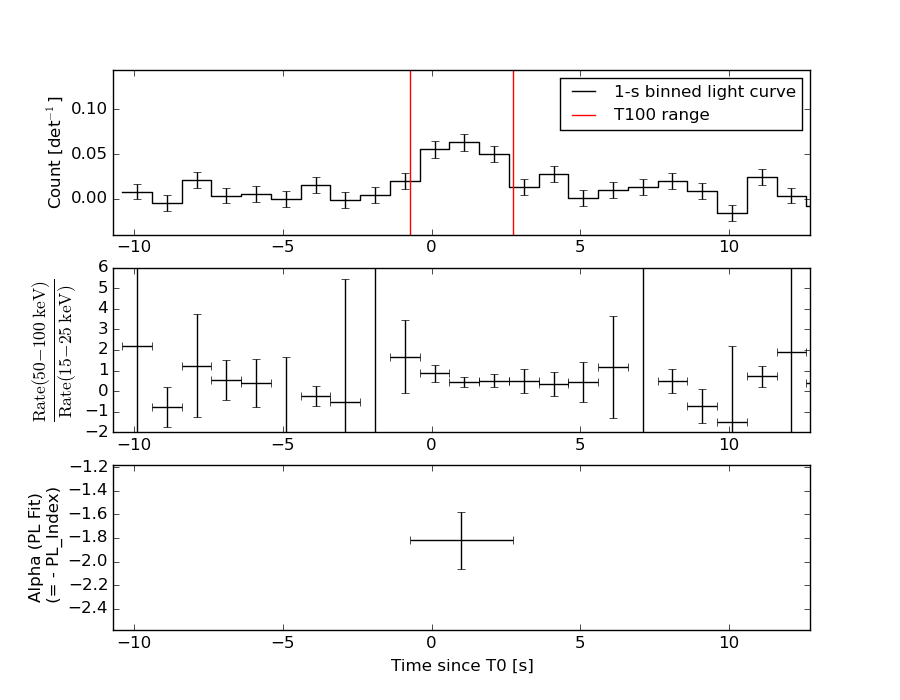
Spectral Evolution
Spectra
Notes:
- 1) The fitting includes the systematic errors.
- 2) When the burst includes telescope slew time periods, the fitting uses an average response file made from multiple 5-s response files through out the slew time plus single time preiod for the non-slew times, and weighted by the total counts in the corresponding time period using addrmf. An average response file is needed becuase a spectral fit using the pre-slew DRM will introduce some errors in both a spectral shape and a normalization if the PHA file contains a lot of the slew/post-slew time interval.
- 3) For fits to more complicated models (e.g. a power-law over a cutoff power-law), the BAT team has decided to require a chi-square improvement of more than 6 for each extra dof.
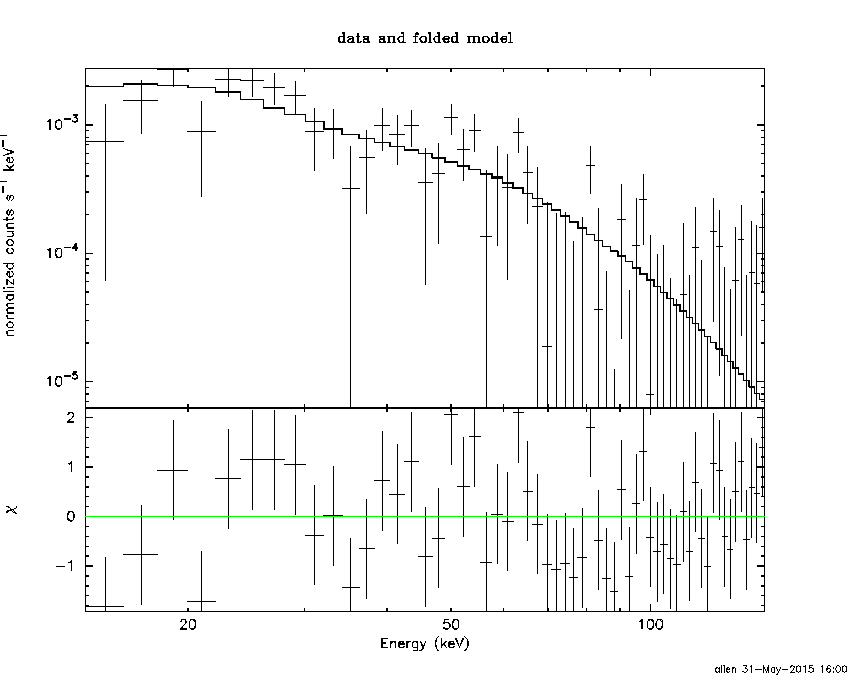
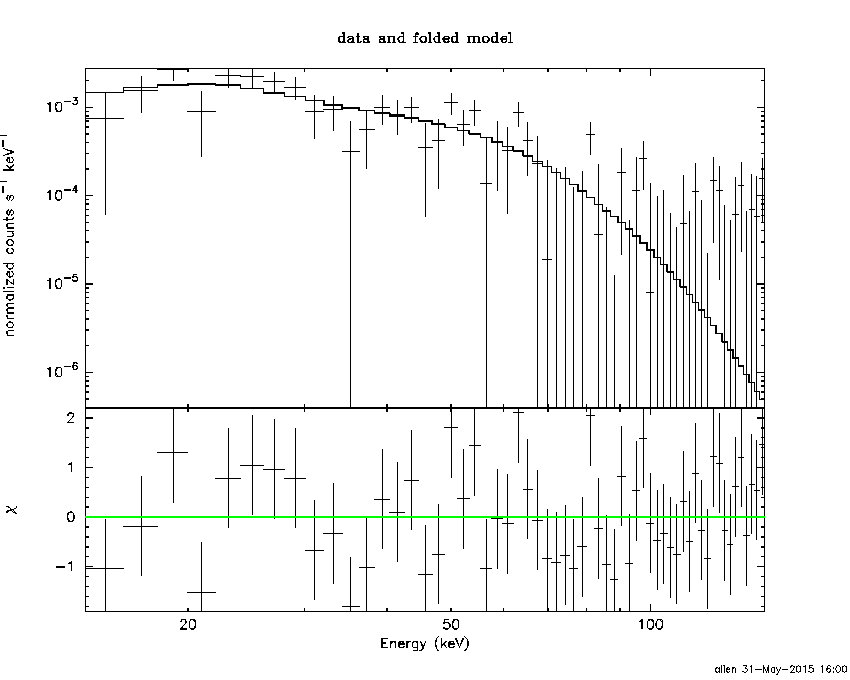
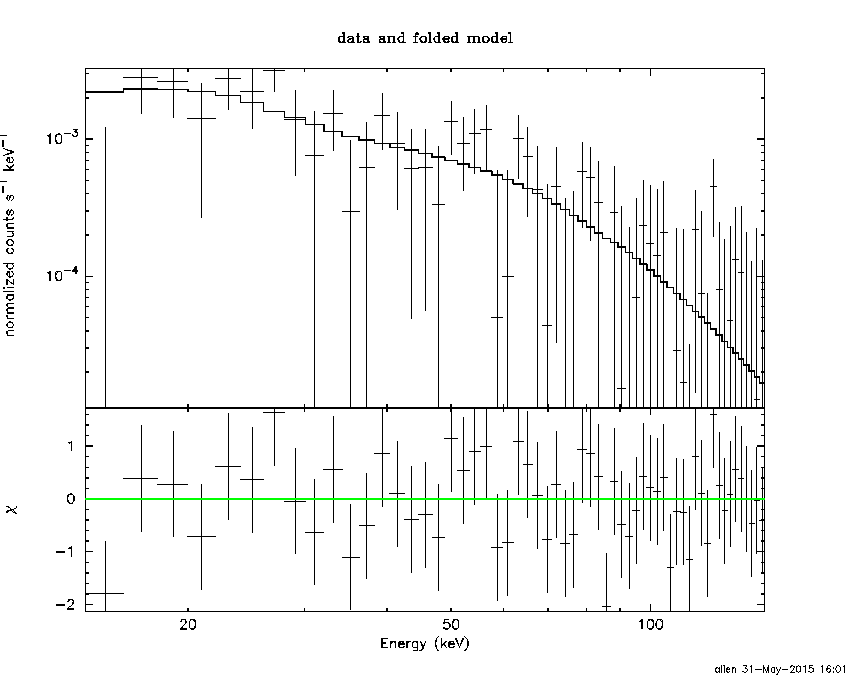
Time averaged spectrum fit using the average DRM
Power-law model
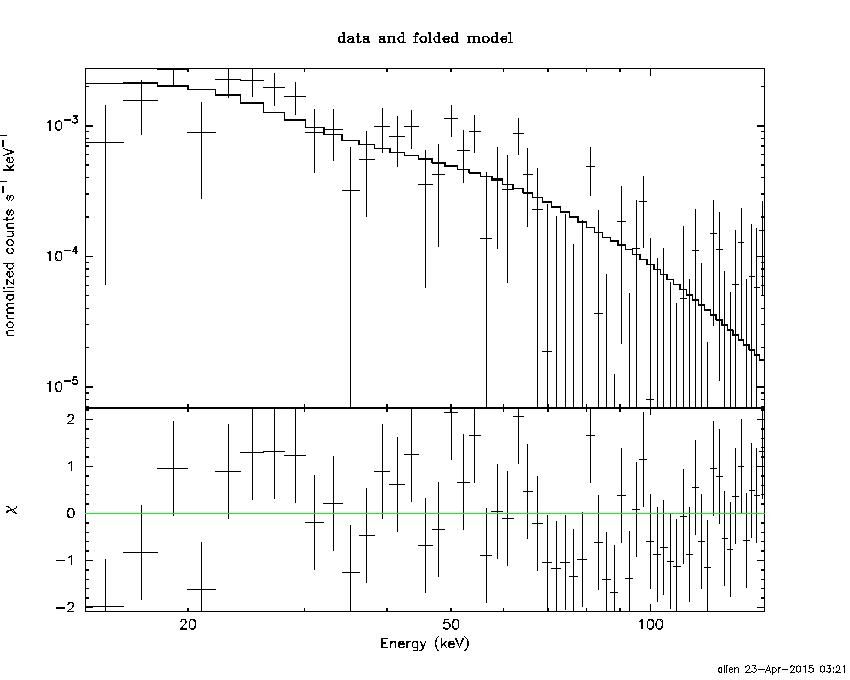
Time interval is from   -0.728 sec. to    2.724 sec.

Spectral model in power-law:
------------------------------------------------------------
Parameters  : value       lower 90%   higher 90%
Photon index: 1.81522     ( -0.236289   0.248688 )
Norm@50keV  : 3.09043E-03    ( -0.000533724   0.00052449 )
------------------------------------------------------------
#Fit statistic : Chi-Squared =          62.54 using 59 PHA bins.
# Reduced chi-squared =          1.097 for     57 degrees of freedom
# Null hypothesis probability =   2.861251e-01

Photon flux (15-150 keV)    in 3.452 sec: 0.428394 ( -0.0622871  0.0622912 ) ph/cm2/s
Energy fluence (15-150 keV)             : 9.81587e-08 ( -1.68821e-08  1.73889e-08 ) ergs/cm2
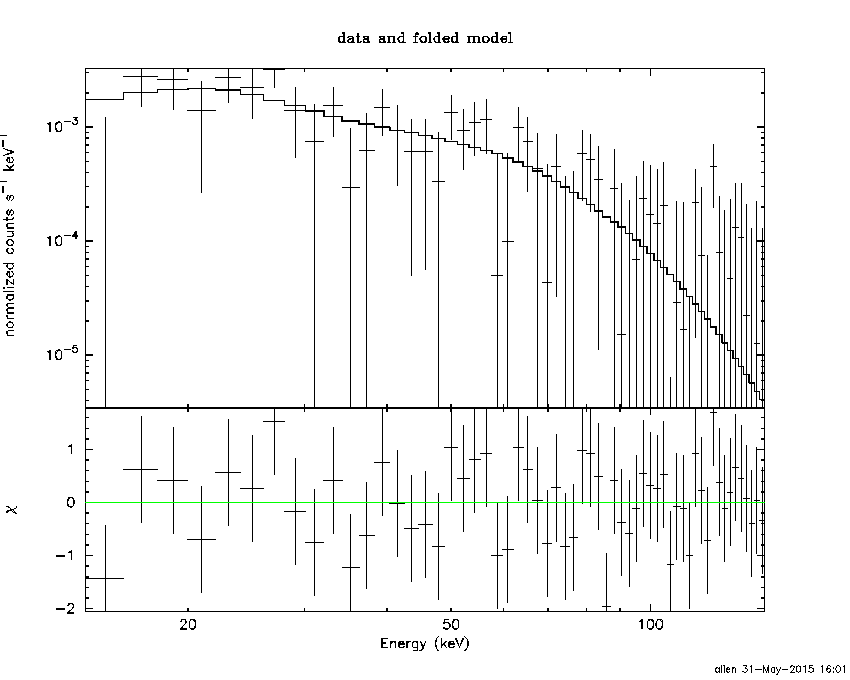
Cutoff power-law model
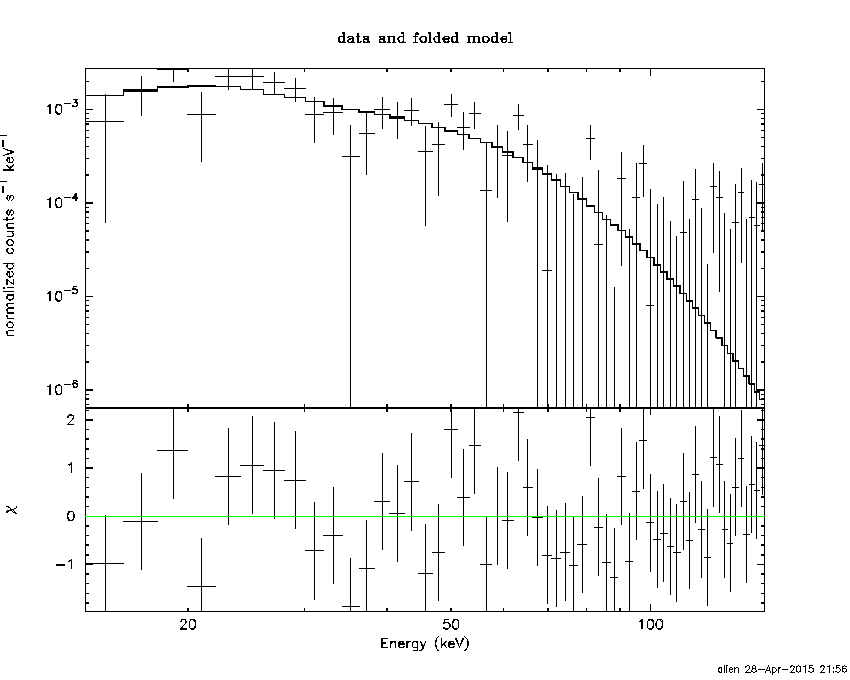
Time interval is from   -0.728 sec. to    2.724 sec.
Spectral model in the cutoff power-law:
------------------------------------------------------------
Parameters  : value       lower 90%   higher 90%
Photon index: -0.404751     ( -1.71604   1.33673 )
Epeak [keV] : 43.6273      ( -6.98248 11.6466 )
Norm@50keV  : 6.21138E-02    ( -0.0625673   0.573702 )
------------------------------------------------------------
#Fit statistic : Chi-Squared =          53.33 using 59 PHA bins.
# Reduced chi-squared =         0.9523 for     56 degrees of freedom
# Null hypothesis probability =   5.765858e-01

Photon flux (15-150 keV)    in 3.452 sec: 0.405033 ( -0.031398  0.062378 ) ph/cm2/s
Energy fluence (15-150 keV)             : 8.1858e-08 ( -1.47777e-08  1.71996e-08 ) ergs/cm2
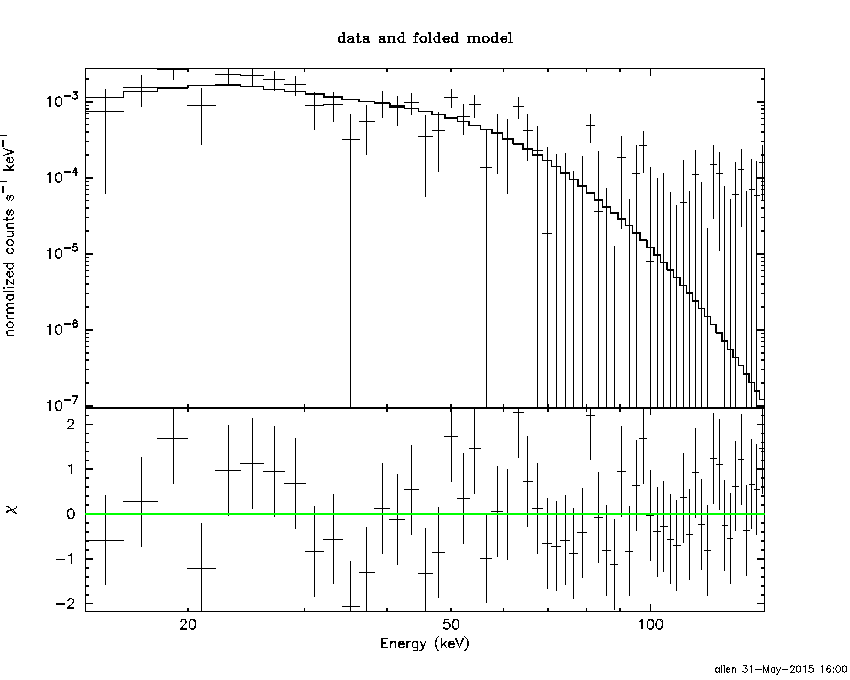
Band function

Time interval is from   -0.728 sec. to    2.724 sec.

Spectral model in the Band function:
------------------------------------------------------------
Parameters  : value       lower 90%   higher 90%
alpha       : 0.220379   ( -1.16149   -0.259243 )
beta        : -4.03606    ( 4.07677   12.2764 )
Epeak [keV] : 44.1761      ( -15.7166 9.62245 )
Norm@50keV   : 4.82285E-02    ( -0.0234942   64.5648 )
------------------------------------------------------------
#Fit statistic : Chi-Squared =          53.32 using 59 PHA bins.
# Reduced chi-squared =         0.9694 for     55 degrees of freedom
# Null hypothesis probability =   5.391949e-01

Photon flux (15-150 keV)    in 3.452 sec:  (    ) ph/cm2/s
Energy fluence (15-150 keV)             : 0 ( 0  0 ) ergs/cm2
Single BB
Spectral model blackbody:
------------------------------------------------------------
Parameters  : value    Lower 90%  Upper 90%
kT [keV]    : 10.8651  (-1.4738  1.70217)
R^2/D10^2   : 0.159776  (-0.0676557   0.115591)
(R is the radius in km and D10 is the distance to the source in units of 10 kpc)
------------------------------------------------------------
#Fit statistic : Chi-Squared =          54.69 using 59 PHA bins.
# Reduced chi-squared =         0.9595 for     57 degrees of freedom
# Null hypothesis probability =   5.622582e-01

Energy  Fluence     90% Error
[keV]   [erg/cm2]   [erg/cm2]
15- 25  1.357e-08   3.191e-09
25- 50  3.776e-08   7.334e-09
50-150  2.494e-08   8.616e-09
15-150  7.627e-08   1.571e-08
Thermal bremsstrahlung (OTTB)
Spectral model: thermal bremsstrahlung
------------------------------------------------------------
Parameters  : value         Lower 90%    Upper 90%
kT [keV]    : 80.2527       (-28.3578      60.8952)
Norm        : 2.05308       (-0.386949     0.484723)
------------------------------------------------------------
#Fit statistic : Chi-Squared =          58.01 using 59 PHA bins.
# Reduced chi-squared =          1.018 for     57 degrees of freedom
# Null hypothesis probability =   4.377288e-01

Energy  Fluence     90% Error
[keV]   [erg/cm2]   [erg/cm2]
15- 25  1.839e-08   3.466e-09
25- 50  3.030e-08   5.768e-09
50-150  4.287e-08   2.523e-08
15-150  9.156e-08   2.762e-08
Double BB
Spectral model: bbodyrad<1> + bbodyrad<2>
------------------------------------------------------------
Parameters  : value         Lower 90%    Upper 90%
kT1 [keV]   : 5.62964        (-5.62502      -5.62502)
R1^2/D10^2  : 0.595505        (-0.596367      -0.596367)
kT2 [keV]   : 13.0534        (-13.0399      -13.0399)
R2^2/D10^2  : 6.52820E-02    (-0.0656343   0.154348)
------------------------------------------------------------
#Fit statistic : Chi-Squared =          52.92 using 59 PHA bins.
# Reduced chi-squared =         0.9622 for     55 degrees of freedom
# Null hypothesis probability =   5.545092e-01

Energy  Fluence     90% Error
[keV]   [erg/cm2]   [erg/cm2]
15- 25  1.600e-08   8.428e-09
25- 50  3.497e-08   1.849e-08
50-150  3.090e-08   1.862e-08
15-150  8.186e-08   4.249e-08
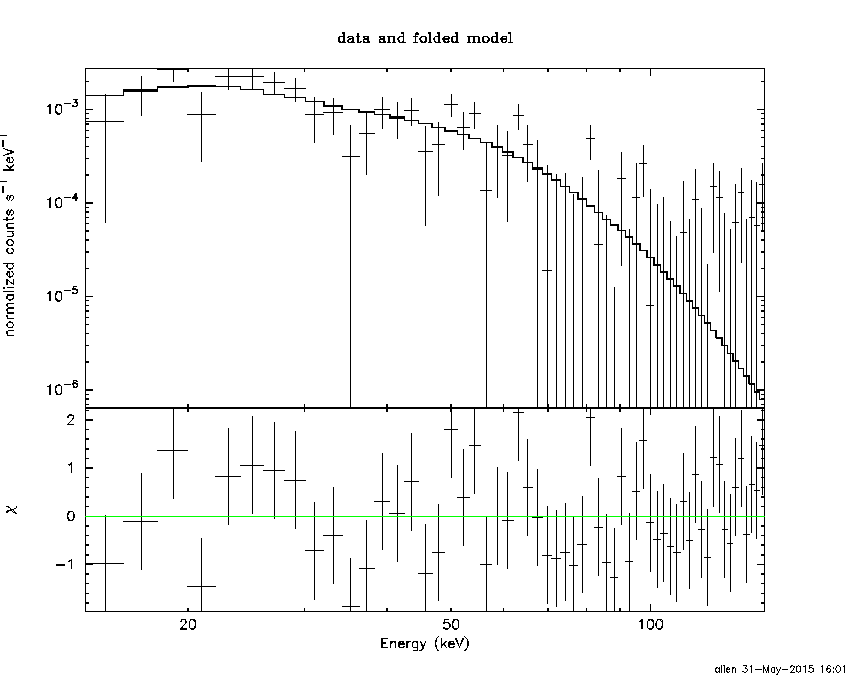
Peak spectrum fit
Power-law model
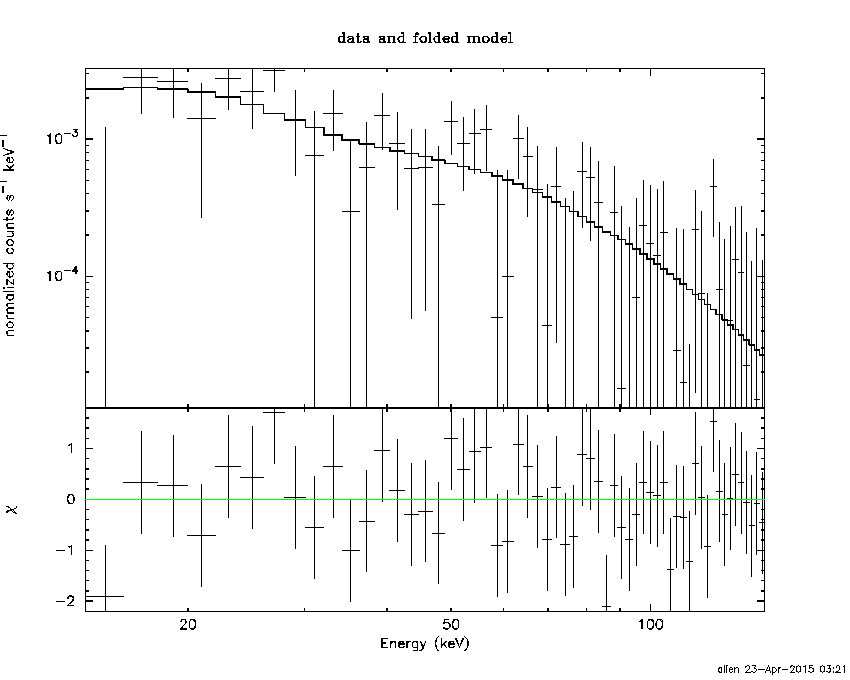
Time interval is from   -0.100 sec. to    0.900 sec.

Spectral model in power-law:
------------------------------------------------------------
Parameters  : value       lower 90%   higher 90%
Photon index: 1.63671     ( -0.343479   0.36093 )
Norm@50keV  : 4.15299E-03    ( -0.00097286   0.000951044 )
------------------------------------------------------------
#Fit statistic : Chi-Squared =          35.74 using 59 PHA bins.
# Reduced chi-squared =         0.6270 for     57 degrees of freedom
# Null hypothesis probability =   9.877017e-01

Photon flux (15-150 keV)    in 1 sec: 0.539925 ( -0.113811  0.113863 ) ph/cm2/s
Energy fluence (15-150 keV)             : 3.86783e-08 ( -9.42104e-09  9.74974e-09 ) ergs/cm2
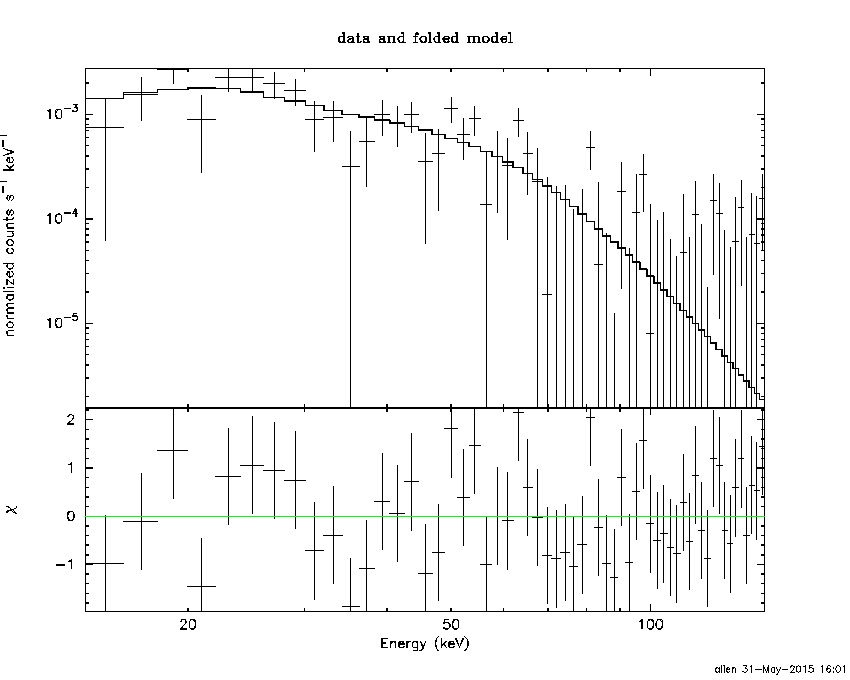
Cutoff power-law model
Time interval is from   -0.100 sec. to    0.900 sec.
Spectral model in the cutoff power-law:
------------------------------------------------------------
Parameters  : value       lower 90%   higher 90%
Photon index: 0.317945     ( -2.21169   1.36572 )
Epeak [keV] : 55.6924      ( -12.6005 -55.6923 )
Norm@50keV  : 2.27505E-02    ( -0.0227506   0.38406 )
------------------------------------------------------------
#Fit statistic : Chi-Squared =          33.59 using 59 PHA bins.
# Reduced chi-squared =         0.5998 for     56 degrees of freedom
# Null hypothesis probability =   9.923956e-01

Photon flux (15-150 keV)    in 1 sec: 0.518289 ( -0.115457  0.116325 ) ph/cm2/s
Energy fluence (15-150 keV)             : 3.42633e-08 ( -9.5197e-09  1.08888e-08 ) ergs/cm2
Band function

Time interval is from   -0.100 sec. to    0.900 sec.

Spectral model in the Band function:
------------------------------------------------------------
Parameters  : value       lower 90%   higher 90%
alpha       : -0.333178   ( -7.19573   1.48482 )
beta        : -10.00000    ( 10   20 )
Epeak [keV] : 55.8221      ( -16.7596 330.09 )
Norm@50keV   : 2.23237E-02    ( -0.0046128   0.383953 )
------------------------------------------------------------
#Fit statistic : Chi-Squared =          33.59 using 59 PHA bins.
# Reduced chi-squared =         0.6107 for     55 degrees of freedom
# Null hypothesis probability =   9.899368e-01

Photon flux (15-150 keV)    in 1 sec:  (    ) ph/cm2/s
Energy fluence (15-150 keV)             : 3.4653e-08 ( 0  0 ) ergs/cm2
Single BB
Spectral model blackbody:
------------------------------------------------------------
Parameters  : value    Lower 90%  Upper 90%
kT [keV]    : 12.3221  (-2.67421  3.44369)
R^2/D10^2   : 0.125891  (-0.0745983   0.178502)
(R is the radius in km and D10 is the distance to the source in units of 10 kpc)
------------------------------------------------------------
#Fit statistic : Chi-Squared =          35.67 using 59 PHA bins.
# Reduced chi-squared =         0.6257 for     57 degrees of freedom
# Null hypothesis probability =   9.879993e-01

Energy  Fluence     90% Error
[keV]   [erg/cm2]   [erg/cm2]
15- 25  4.050e-09   1.631e-09
25- 50  1.314e-08   5.969e-09
50-150  1.221e-08   5.969e-09
15-150  2.940e-08   9.690e-09
Thermal bremsstrahlung (OTTB)
Spectral model: thermal bremsstrahlung
------------------------------------------------------------
Parameters  : value         Lower 90%    Upper 90%
kT [keV]    : 135.556       (-73.0574      -132.892)
Norm        : 2.27221       (-0.517046     0.73104)
------------------------------------------------------------
#Fit statistic : Chi-Squared =          34.57 using 59 PHA bins.
# Reduced chi-squared =         0.6065 for     57 degrees of freedom
# Null hypothesis probability =   9.917989e-01

Energy  Fluence     90% Error
[keV]   [erg/cm2]   [erg/cm2]
15- 25  5.880e-09   3.283e-09
25- 50  1.073e-08   6.085e-09
50-150  2.028e-08   1.294e-08
15-150  3.690e-08   2.257e-08
Double BB
Spectral model: bbodyrad<1> + bbodyrad<2>
------------------------------------------------------------
Parameters  : value         Lower 90%    Upper 90%
kT1 [keV]   : 6.36450        (-6.34255      -6.34255)
R1^2/D10^2  : 0.680143        (-0.683873      -0.683873)
kT2 [keV]   : 17.8113        (-17.7903      -17.7903)
R2^2/D10^2  : 2.47028E-02    (-0.0248291   0.136706)
------------------------------------------------------------
#Fit statistic : Chi-Squared =          33.18 using 59 PHA bins.
# Reduced chi-squared =         0.6032 for     55 degrees of freedom
# Null hypothesis probability =   9.913192e-01

Energy  Fluence     90% Error
[keV]   [erg/cm2]   [erg/cm2]
15- 25  5.540e-09   3.495e-09
25- 50  1.171e-08   5.930e-09
50-150  1.711e-08   1.035e-08
15-150  3.435e-08   1.782e-08
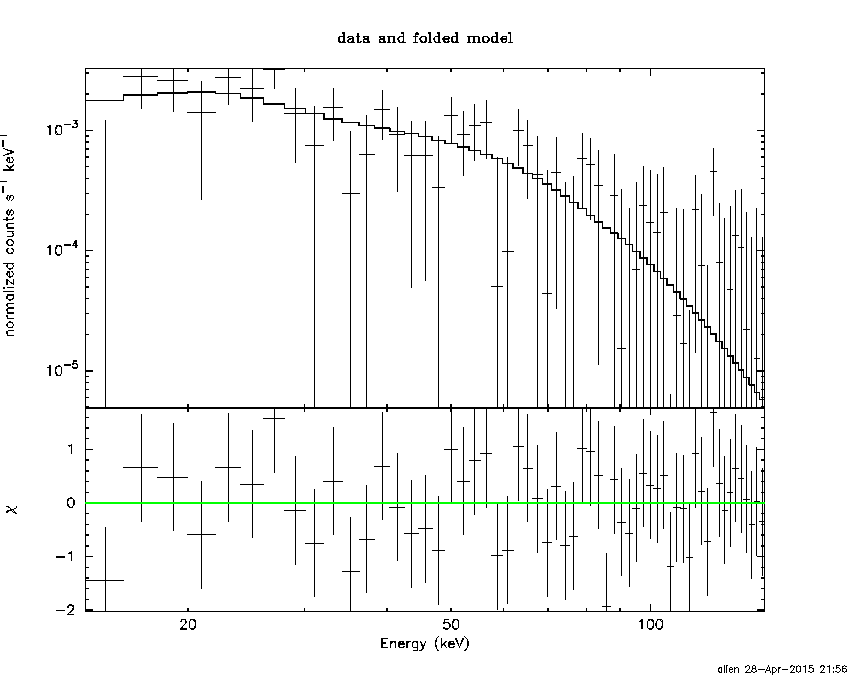
Pre-slew spectrum (Pre-slew PHA with pre-slew DRM)
Power-law model

Spectral model in power-law:
------------------------------------------------------------
Parameters  : value       lower 90%   higher 90%
Photon index: 1.81522     ( -0.236289   0.248688 )
Norm@50keV  : 3.09043E-03    ( -0.000533724   0.00052449 )
------------------------------------------------------------
#Fit statistic : Chi-Squared =          62.54 using 59 PHA bins.
# Reduced chi-squared =          1.097 for     57 degrees of freedom
# Null hypothesis probability =   2.861251e-01

Photon flux (15-150 keV)    in 3.452 sec: 0.428394 ( -0.0622871  0.0622912 ) ph/cm2/s
Energy fluence (15-150 keV)             : 9.81587e-08 ( -1.68821e-08  1.73889e-08 ) ergs/cm2
Cutoff power-law model
Spectral model in the cutoff power-law:
------------------------------------------------------------
Parameters  : value       lower 90%   higher 90%
Photon index: -0.404751     ( -1.71604   1.33673 )
Epeak [keV] : 43.6273      ( -6.98248 11.6466 )
Norm@50keV  : 6.21138E-02    ( -0.0625673   0.573702 )
------------------------------------------------------------
#Fit statistic : Chi-Squared =          53.33 using 59 PHA bins.
# Reduced chi-squared =         0.9523 for     56 degrees of freedom
# Null hypothesis probability =   5.765858e-01

Photon flux (15-150 keV)    in 3.452 sec: 0.405033 ( -0.031398  0.062378 ) ph/cm2/s
Energy fluence (15-150 keV)             : 8.1858e-08 ( -1.47777e-08  1.71996e-08 ) ergs/cm2
Band function
Spectral model in the Band function:
------------------------------------------------------------
Parameters  : value       lower 90%   higher 90%
alpha       : 0.220379   ( -1.16149   -0.259243 )
beta        : -4.03606    ( 4.07677   12.2764 )
Epeak [keV] : 44.1761      ( -15.7166 9.62245 )
Norm@50keV   : 4.82285E-02    ( -0.0234942   64.5648 )
------------------------------------------------------------
#Fit statistic : Chi-Squared =          53.32 using 59 PHA bins.
# Reduced chi-squared =         0.9694 for     55 degrees of freedom
# Null hypothesis probability =   5.391949e-01

Photon flux (15-150 keV)    in 3.452 sec:  (    ) ph/cm2/s
Energy fluence (15-150 keV)             : 0 ( 0  0 ) ergs/cm2
S(25-50 keV) vs. S(50-100 keV) plot
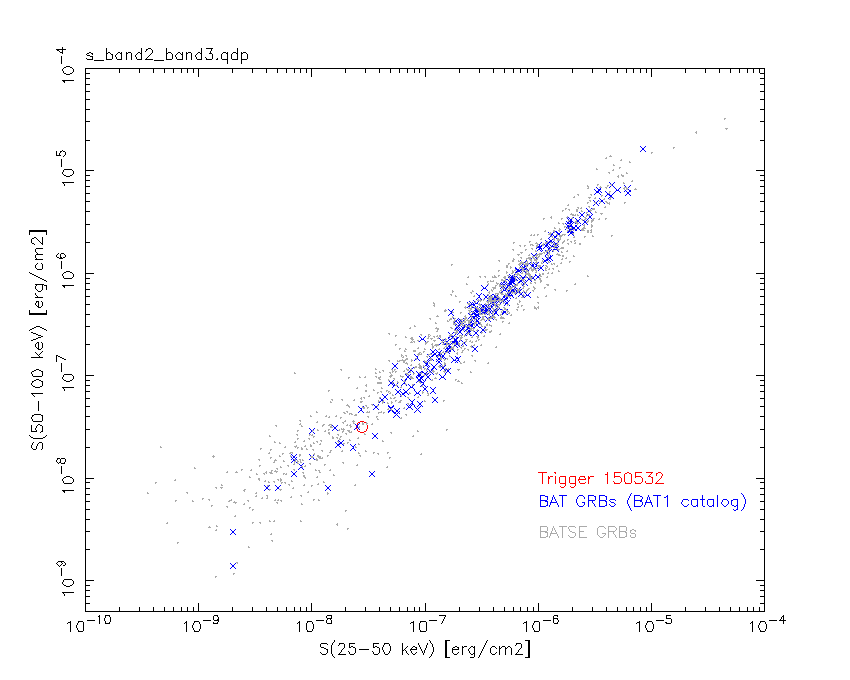
S(25-50 keV)  = 2.78e-08
S(50-100 keV) = 3.16e-08
T90 vs. Hardness ratio plot
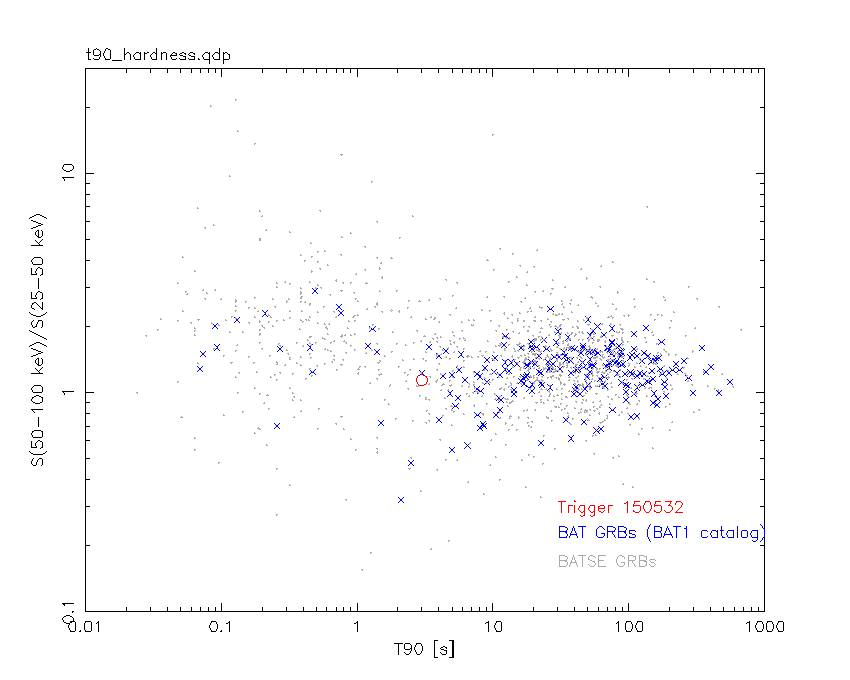
T90                                   = 2.99200001358986 sec.
Hardness ratio (energy fluence ratio) = 1.13669
Color vs. Color plot
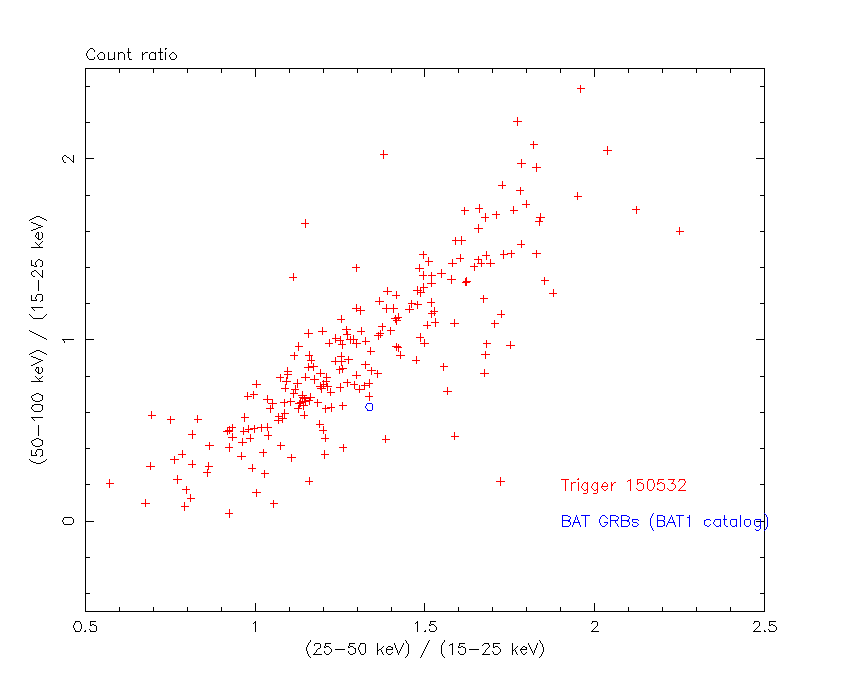
Count Ratio  (25-50 keV) / (15-25 keV) = 1.3357
Count Ratio (50-100 keV) / (15-25 keV) = 0.630496
Mask shadow pattern
IMX = 1.224717432326633E-01, IMY = -7.630036168813809E-02
TIME vs. PHA plot around the trigger time
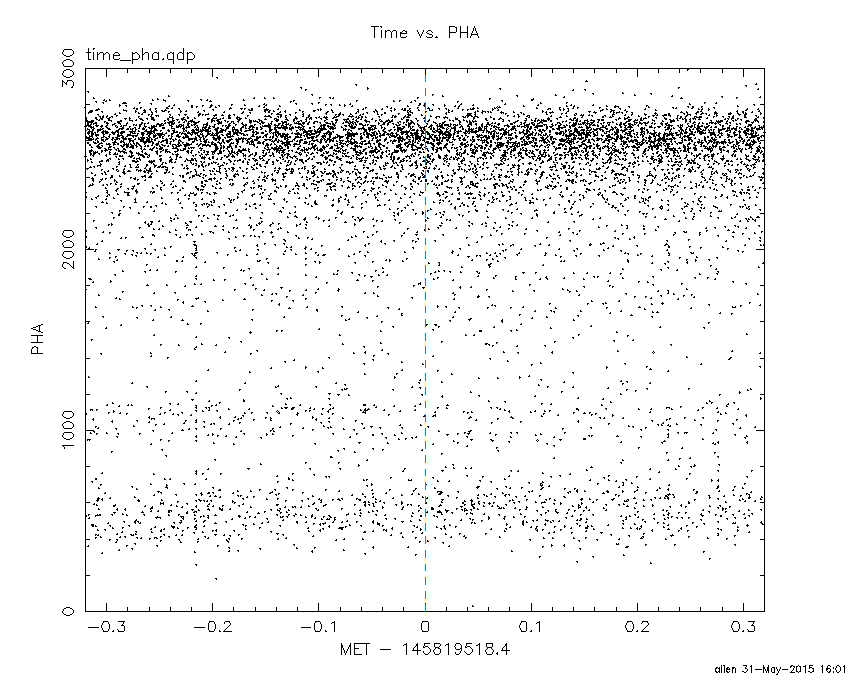
Blue+Cyan dotted lines: Time interval of the scaled map
From 0.000000 to 2.048000
TIME vs. DetID plot around the trigger time
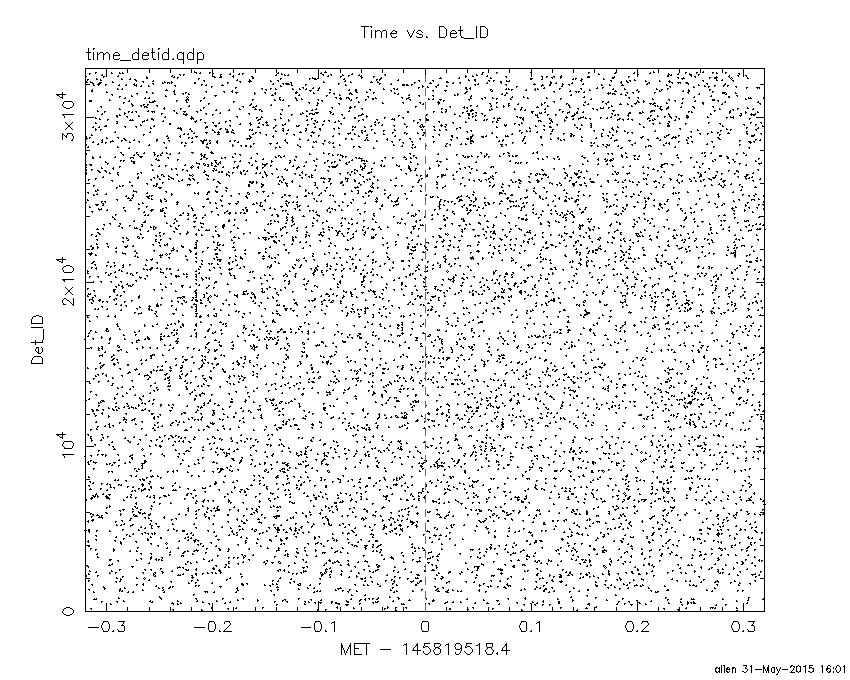
Blue+Cyan dotted lines: Time interval of the scaled map
From 0.000000 to 2.048000
100 us light curve (15-350 keV)
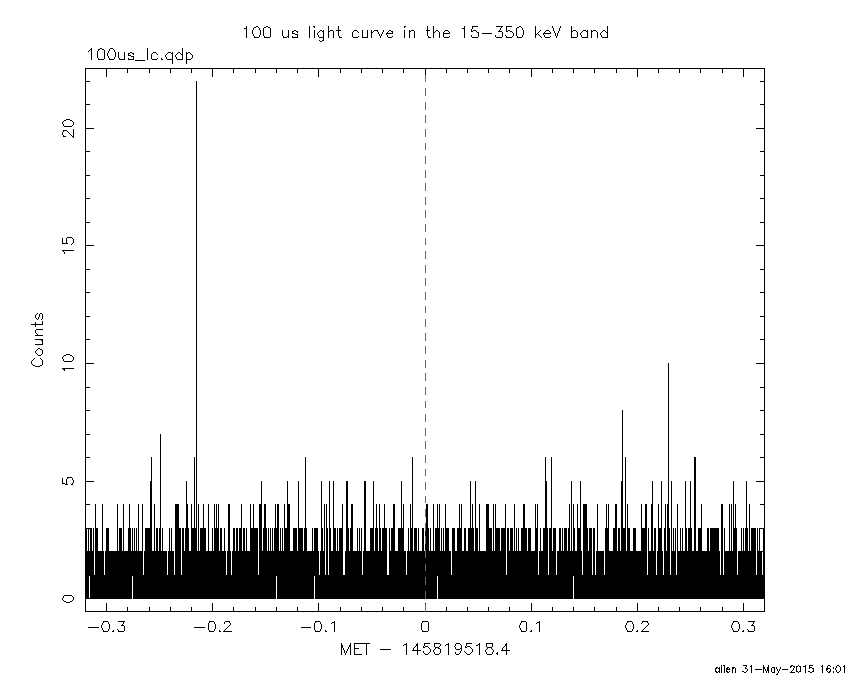
Blue+Cyan dotted lines: Time interval of the scaled map
From 0.000000 to 2.048000
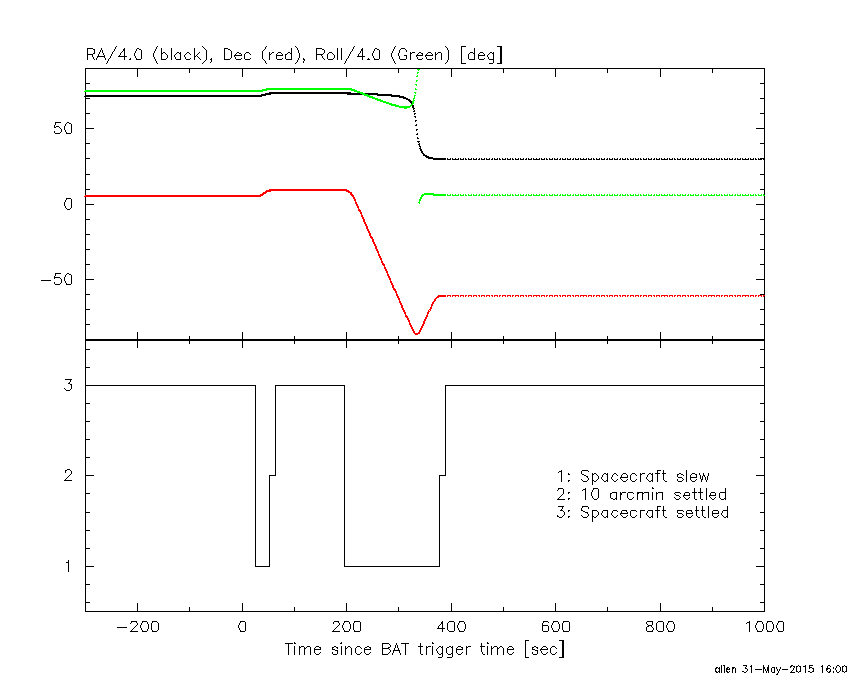
Spacecraft aspect plot
Bright source in the pre-burst/pre-slew/post-slew images
Pre-burst image of 15-350 keV band
Time interval of the image:
-299.400000 -0.728000

# RAcent  DECcent POSerr Theta    Phi  PeakCts   SNR AngSep     Name
#  [deg]    [deg]    ['] [deg]  [deg]                   [']
244.9848 -15.6504    0.7  45.9 -147.3   7.8651  15.5    0.7	Sco X-1
254.3973  35.4716    9.8  42.1  -69.4   1.2367   1.2    8.3	Her X-1
256.0847 -37.8969    8.6  51.5 -179.0   0.8404   1.3    5.6	4U 1700-377
256.4302 -36.5018    4.7  50.2 -178.1  -1.3542  -2.5    4.7	GX 349+2
263.1073 -24.8279    6.2  37.6 -173.6   0.4860   1.9    7.3	GX 1+4
264.8693 -44.4896    5.8  53.3  169.5   1.8014   2.0    5.9	4U 1735-44
268.3649  -1.4411    1.2  19.1 -139.5   2.1479   9.5    0.7	SW J1753.5-0127
270.1869 -24.9866    5.1  34.1  177.2   0.6322   2.3    7.7	GX 5-1
270.2614 -25.7250    2.9  34.7  176.5   1.1047   4.0    2.5	GRS 1758-258
274.0070 -14.0910    3.6  22.9 -177.4   0.6868   3.2    3.3	GX 17+2
276.0080 -30.3730    3.6  37.0  165.4   1.0896   3.2    4.3	H1820-303
285.0741 -24.9923    8.4  30.3  152.7   0.4237   1.4    4.8	HT1900.1-2455
288.9193  10.8529    7.3   6.2   -4.7  -0.3119  -1.6    9.0	GRS 1915+105
299.5904  35.2059    0.3  32.4   -8.9   9.6589  37.3    0.3	Cyg X-1
308.1116  40.9741    2.4  40.7   -4.0   1.5935   4.7    1.3	Cyg X-3
326.2560  38.2428    5.8  49.0   12.5   1.1819   2.0    6.2	Cyg X-2
262.9033 -33.8001    4.8  44.9  178.4   0.9770   2.4    4.8	GX 354-0
323.8145  33.7631    3.2  45.0   16.3   1.5899   3.6 ------	UNKNOWN
319.9487  48.0504    3.2  51.5   -1.2   1.8610   3.5 ------	UNKNOWN
243.8081 -31.2348    2.7  54.5 -164.3   2.9460   4.3 ------	UNKNOWN
240.3290 -35.0256    2.7  59.1 -166.1   6.4652   4.2 ------	UNKNOWN
	UNKNOWN
Pre-slew background subtracted image of 15-350 keV band
Time interval of the image:
-0.728000 2.724000

# RAcent  DECcent POSerr Theta    Phi  PeakCts   SNR AngSep     Name
#  [deg]    [deg]    ['] [deg]  [deg]                   [']
245.0227 -15.4917    6.8  45.8 -147.1  -0.0684  -1.7    9.3	Sco X-1
254.2228  35.2624    0.0  42.1  -69.7   0.0944   1.3   12.5	Her X-1
255.9931 -37.7242   10.1  51.4 -178.8   0.0544   1.1    7.2	4U 1700-377
256.3949 -36.4605    4.2  50.2 -178.0   0.1080   2.7    3.0	GX 349+2
263.0295 -24.9409  300.4  37.7 -173.6  -0.0009  -0.0   11.8	GX 1+4
264.8471 -44.4870    7.4  53.3  169.5   0.1170   1.6    5.0	4U 1735-44
268.3703  -1.6157    4.2  19.2 -140.0   0.0488   2.7    9.8	SW J1753.5-0127
270.1094 -25.0949    7.7  34.2  177.2   0.0343   1.5    9.5	GX 5-1
270.2110 -25.6435    4.5  34.6  176.6  -0.0595  -2.6    7.8	GRS 1758-258
273.8775 -13.9754    4.8  22.8 -177.0   0.0436   2.4    8.3	GX 17+2
276.1194 -30.3411    6.2  36.9  165.2  -0.0486  -1.9   10.2	H1820-303
284.8138 -24.9834    0.0  30.3  153.2  -0.0208  -0.9   12.7	HT1900.1-2455
288.8541  10.7414    0.0   6.0   -4.8   0.0045   0.3   12.7	GRS 1915+105
299.5386  35.1871    3.2  32.3   -9.0  -0.0732  -3.6    2.7	Cyg X-1
307.8809  40.9228    3.5  40.6   -4.2   0.0869   3.3   10.5	Cyg X-3
326.3452  38.3279   21.7  49.1   12.4  -0.0254  -0.5    8.2	Cyg X-2
262.9227 -33.9353    7.6  45.0  178.3  -0.0520  -1.5    6.9	GX 354-0
304.6244 -30.7136    2.4  40.0  125.7   0.2674   4.8 ------	UNKNOWN
293.5861   9.1391    1.0   8.2   31.9   0.1988  11.1 ------	UNKNOWN
286.7115   2.2640    2.3   3.0  142.5   0.0858   5.0 ------	UNKNOWN
Post-slew image of 15-350 keV band
Time interval of the image:
53.300600 122.651300

# RAcent  DECcent POSerr Theta    Phi  PeakCts   SNR AngSep     Name
#  [deg]    [deg]    ['] [deg]  [deg]                   [']
245.0900 -15.6582   23.2  54.1 -152.8   0.1583   0.5    6.5	Sco X-1
256.4255 -36.5424    4.2  57.5  179.4  -1.4773  -2.7    7.2	GX 349+2
262.9210 -24.8486    5.5  45.3 -175.1   0.3060   2.1    7.8	GX 1+4
268.3671  -1.4458    1.7  27.3 -147.4   0.5911   6.6    0.4	SW J1753.5-0127
270.2539 -25.2490   25.4  41.2  177.2   0.0605   0.5   10.3	GX 5-1
270.5014 -25.7061    5.1  41.5  176.5  -0.3073  -2.3   11.0	GRS 1758-258
273.9532 -13.9902    3.5  30.3 -175.4   0.2917   3.3    4.1	GX 17+2
275.9364 -30.3682    9.0  43.0  166.8   0.1961   1.3    0.6	H1820-303
285.1776 -24.9668    6.5  35.1  157.6   0.2316   1.8    8.2	HT1900.1-2455
288.5990  10.9001    7.7   5.2 -106.0   0.1232   1.5   12.1	GRS 1915+105
299.6048  35.2060    0.5  26.6  -24.7   2.1622  25.3    0.8	Cyg X-1
308.1046  40.9424    2.0  34.3  -16.1   0.5788   5.8    0.7	Cyg X-3
326.1611  38.3299   50.5  41.3    4.0  -0.0307  -0.2    0.7	Cyg X-2
263.0932 -33.8145    4.6  51.8  176.7   0.6070   2.5    5.3	GX 354-0
314.4193 -19.7835    2.0  35.5  109.0   1.0878   5.6 ------	UNKNOWN
284.3060  20.6202    2.4  14.5  -72.7   0.3769   4.8 ------	UNKNOWN
274.4097  55.0103    2.5  48.3  -50.4   1.9373   4.6 ------	UNKNOWN
Plot creation:
Sun May 31 16:02:04 EDT 2015