Click here for the BAT GCN circular template
Image
Pre-slew 15.0-350.0 keV image (Event data)
#   RAcent    DECcent   POSerr    Theta     Phi              Peak Cts       SNR   Name
   51.1031   -46.0289   0.0130    41.9422   165.5905         1.8206522     14.865 TRIG_00151486

Foreground time interval of the image:
 -1.556  23.869 (delta_t =  25.425 [sec])
Background time interval of the image:
-119.832  -1.556 (delta_t = 118.276 [sec])
Lightcurves
Notes:
- 1) The mask-weighted light curves are using the flight position.
- 2) Multiple plots of different time binning/intervals are shown to cover all scenarios of short/long GRBs, rate/image triggers, and real/false positives.
- 3) For all the mask-weighted lightcurves, the y-axis units are counts/sec/det where a det is 0.4 x 0.4 = 0.16 sq cm.
- 4) The verticle lines correspond to following: green dotted lines are T50 interval, black dotted lines are T90 interval, blue solid line(s) is a spacecraft slew start time, and orange solid line(s) is a spacecraft slew end time.
- 5) Time of each bin is in the middle of the bin.
1 s binning
From T0-310 s to T0+310 s

From T100_start - 20 s to T100_end + 30 s
Full time interval

64 ms binning
Full time interval

From T100_start to T100_end
From T0-5 sec to T0+5 sec
16 ms binning
From T100_start-5 s to T100_start+5 s

Blue+Cyan dotted lines: Time interval of the scaled map
From 0.000000 to 2.048000
8 ms binning
From T100_start-3 s to T100_start+3 s

Blue+Cyan dotted lines: Time interval of the scaled map
From 0.000000 to 2.048000
2 ms binning
From T100_start-1 s to T100_start+1 s

Blue+Cyan dotted lines: Time interval of the scaled map
From 0.000000 to 2.048000
SN=5 or 10 sec. binning (whichever binning is satisfied first)
SN=5 or 10 sec. binning (T < 200 sec)
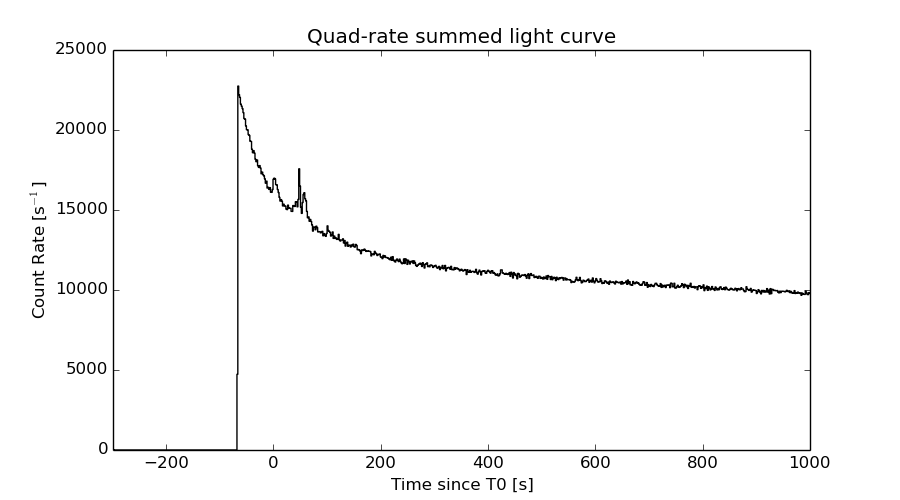
Quad-rate summed light curves (from T0-300s to T0+1000s)
Spectral Evolution

Spectra
Notes:
- 1) The fitting includes the systematic errors.
- 2) When the burst includes telescope slew time periods, the fitting uses an average response file made from multiple 5-s response files through out the slew time plus single time preiod for the non-slew times, and weighted by the total counts in the corresponding time period using addrmf. An average response file is needed becuase a spectral fit using the pre-slew DRM will introduce some errors in both a spectral shape and a normalization if the PHA file contains a lot of the slew/post-slew time interval.
- 3) For fits to more complicated models (e.g. a power-law over a cutoff power-law), the BAT team has decided to require a chi-square improvement of more than 6 for each extra dof.
Time averaged spectrum fit using the average DRM
Power-law model
Time interval is from   -1.556 sec. to  133.688 sec.

Spectral model in power-law:
------------------------------------------------------------
Parameters  : value       lower 90%   higher 90%
Photon index: 2.32621     ( -0.128849   0.133534 )
Norm@50keV  : 1.93607E-03    ( -0.000166594   0.000164962 )
------------------------------------------------------------
#Fit statistic : Chi-Squared =          53.57 using 59 PHA bins.
# Reduced chi-squared =         0.9398 for     57 degrees of freedom
# Null hypothesis probability =   6.046140e-01

Photon flux (15-150 keV)    in 135.2 sec: 0.343348 ( -0.0202085  0.0202337 ) ph/cm2/s
Energy fluence (15-150 keV)             : 2.51385e-06 ( -1.71841e-07  1.74954e-07 ) ergs/cm2
Cutoff power-law model

Time interval is from   -1.556 sec. to  133.688 sec.
Spectral model in the cutoff power-law:
------------------------------------------------------------
Parameters  : value       lower 90%   higher 90%
Photon index: 1.80689     (     )
Epeak [keV] : 13.9432      (   )
Norm@50keV  : 4.00190E-03    (     )
------------------------------------------------------------
#Fit statistic : Chi-Squared =          51.35 using 59 PHA bins.
# Reduced chi-squared =         0.9169 for     56 degrees of freedom
# Null hypothesis probability =   6.513952e-01

Photon flux (15-150 keV)    in 135.2 sec: 0.333159 ( -0.023086  0.023129 ) ph/cm2/s
Energy fluence (15-150 keV)             : 2.34755e-06 ( -2.31706e-07  2.52797e-07 ) ergs/cm2
Band function
Time interval is from   -1.556 sec. to  133.688 sec.

Spectral model in the Band function:
------------------------------------------------------------
Parameters  : value       lower 90%   higher 90%
alpha       : -1.38258   ( -0.755082   1.37954 )
beta        : -2.61346    ( 2.64423   0.335521 )
Epeak [keV] : 21.9036      ( -11.8896 6.8775 )
Norm@50keV   : 7.78152E-03    ( -0.00436208   574.581 )
------------------------------------------------------------
#Fit statistic : Chi-Squared =          49.70 using 59 PHA bins.
# Reduced chi-squared =         0.9036 for     55 degrees of freedom
# Null hypothesis probability =   6.767813e-01

Photon flux (15-150 keV)    in 135.2 sec:  (    ) ph/cm2/s
Energy fluence (15-150 keV)             : 0 ( 0  0 ) ergs/cm2
Single BB

Spectral model blackbody:
------------------------------------------------------------
Parameters  : value    Lower 90%  Upper 90%
kT [keV]    : 8.18878  (-0.548062  0.588525)
R^2/D10^2   : 0.321440  (-0.0799659   0.107191)
(R is the radius in km and D10 is the distance to the source in units of 10 kpc)
------------------------------------------------------------
#Fit statistic : Chi-Squared =          88.99 using 59 PHA bins.
# Reduced chi-squared =          1.561 for     57 degrees of freedom
# Null hypothesis probability =   4.283790e-03

Energy  Fluence     90% Error
[keV]   [erg/cm2]   [erg/cm2]
15- 25  5.359e-07   5.300e-08
25- 50  9.763e-07   6.929e-08
50-150  2.766e-07   5.442e-08
15-150  1.789e-06   1.264e-07
Thermal bremsstrahlung (OTTB)

Spectral model: thermal bremsstrahlung
------------------------------------------------------------
Parameters  : value         Lower 90%    Upper 90%
kT [keV]    : 39.6953       (-5.99911      7.60706)
Norm        : 2.17531       (-0.268929     0.317052)
------------------------------------------------------------
#Fit statistic : Chi-Squared =          52.56 using 59 PHA bins.
# Reduced chi-squared =         0.9221 for     57 degrees of freedom
# Null hypothesis probability =   6.422717e-01

Energy  Fluence     90% Error
[keV]   [erg/cm2]   [erg/cm2]
15- 25  6.736e-07   5.415e-08
25- 50  8.833e-07   6.037e-08
50-150  6.776e-07   1.393e-07
15-150  2.235e-06   1.798e-07
Double BB

Spectral model: bbodyrad<1> + bbodyrad<2>
------------------------------------------------------------
Parameters  : value         Lower 90%    Upper 90%
kT1 [keV]   : 5.11619        (-1.5149      1.8619)
R1^2/D10^2  : 1.56387        (-0.982879      4.59443)
kT2 [keV]   : 14.7069        (-4.05017      21.2129)
R2^2/D10^2  : 1.93547E-02    (-0.0176768   0.0649559)
------------------------------------------------------------
#Fit statistic : Chi-Squared =          55.16 using 59 PHA bins.
# Reduced chi-squared =          1.003 for     55 degrees of freedom
# Null hypothesis probability =   4.684758e-01

Energy  Fluence     90% Error
[keV]   [erg/cm2]   [erg/cm2]
15- 25  6.821e-07   1.824e-07
25- 50  8.528e-07   2.515e-07
50-150  6.941e-07   3.627e-07
15-150  2.229e-06   6.731e-07
Peak spectrum fit
Power-law model

Time interval is from   47.572 sec. to   48.572 sec.

Spectral model in power-law:
------------------------------------------------------------
Parameters  : value       lower 90%   higher 90%
Photon index: 1.98192     ( -0.179039   0.188245 )
Norm@50keV  : 1.49746E-02    ( -0.00182973   0.00179149 )
------------------------------------------------------------
#Fit statistic : Chi-Squared =          48.53 using 59 PHA bins.
# Reduced chi-squared =         0.8515 for     57 degrees of freedom
# Null hypothesis probability =   7.801760e-01

Photon flux (15-150 keV)    in 1 sec: 2.22773 ( -0.209257  0.209296 ) ph/cm2/s
Energy fluence (15-150 keV)             : 1.37972e-07 ( -1.57906e-08  1.61622e-08 ) ergs/cm2
Cutoff power-law model

Time interval is from   47.572 sec. to   48.572 sec.
Spectral model in the cutoff power-law:
------------------------------------------------------------
Parameters  : value       lower 90%   higher 90%
Photon index: 1.32482     ( -0.926159   0.751872 )
Epeak [keV] : 42.5606      (   )
Norm@50keV  : 3.58779E-02    (     )
------------------------------------------------------------
#Fit statistic : Chi-Squared =          46.36 using 59 PHA bins.
# Reduced chi-squared =         0.8279 for     56 degrees of freedom
# Null hypothesis probability =   8.172192e-01

Photon flux (15-150 keV)    in 1 sec: 2.16387 ( -0.22074  0.22106 ) ph/cm2/s
Energy fluence (15-150 keV)             : 1.28434e-07 ( -1.7958e-08  1.9267e-08 ) ergs/cm2
Band function

Time interval is from   47.572 sec. to   48.572 sec.

Spectral model in the Band function:
------------------------------------------------------------
Parameters  : value       lower 90%   higher 90%
alpha       : -1.32485   ( -3.44191   0.986878 )
beta        : -10.0000    ( 10   3.55271e-15 )
Epeak [keV] : 42.5517      ( -13.9094 -42.5517 )
Norm@50keV   : 3.58720E-02    ( -0.017163   0.0877355 )
------------------------------------------------------------
#Fit statistic : Chi-Squared =          46.36 using 59 PHA bins.
# Reduced chi-squared =         0.8430 for     55 degrees of freedom
# Null hypothesis probability =   7.900407e-01

Photon flux (15-150 keV)    in 1 sec: 2.17253 (    ) ph/cm2/s
Energy fluence (15-150 keV)             : 1.29586e-07 ( 0  0 ) ergs/cm2
Single BB

Spectral model blackbody:
------------------------------------------------------------
Parameters  : value    Lower 90%  Upper 90%
kT [keV]    : 10.0253  (-1.06711  1.20853)
R^2/D10^2   : 1.01842  (-0.359193   0.550612)
(R is the radius in km and D10 is the distance to the source in units of 10 kpc)
------------------------------------------------------------
#Fit statistic : Chi-Squared =          63.47 using 59 PHA bins.
# Reduced chi-squared =          1.114 for     57 degrees of freedom
# Null hypothesis probability =   2.589445e-01

Energy  Fluence     90% Error
[keV]   [erg/cm2]   [erg/cm2]
15- 25  2.086e-08   3.805e-09
25- 50  5.206e-08   6.080e-09
50-150  2.737e-08   7.110e-09
15-150  1.003e-07   1.306e-08
Thermal bremsstrahlung (OTTB)

Spectral model: thermal bremsstrahlung
------------------------------------------------------------
Parameters  : value         Lower 90%    Upper 90%
kT [keV]    : 67.0578       (-17.5893      28.1307)
Norm        : 11.1026       (-1.62655     1.89383)
------------------------------------------------------------
#Fit statistic : Chi-Squared =          46.38 using 59 PHA bins.
# Reduced chi-squared =         0.8137 for     57 degrees of freedom
# Null hypothesis probability =   8.414956e-01

Energy  Fluence     90% Error
[keV]   [erg/cm2]   [erg/cm2]
15- 25  2.835e-08   3.925e-09
25- 50  4.457e-08   4.735e-09
50-150  5.542e-08   1.465e-08
15-150  1.283e-07   1.680e-08
Double BB

Spectral model: bbodyrad<1> + bbodyrad<2>
------------------------------------------------------------
Parameters  : value         Lower 90%    Upper 90%
kT1 [keV]   : 4.09658        (-2.03763      3.81628)
R1^2/D10^2  : 18.1976        (-15.2185      752.096)
kT2 [keV]   : 13.7989        (-3.04761      15.6872)
R2^2/D10^2  : 0.249121    (-0.229378   0.507005)
------------------------------------------------------------
#Fit statistic : Chi-Squared =          48.26 using 59 PHA bins.
# Reduced chi-squared =         0.8774 for     55 degrees of freedom
# Null hypothesis probability =   7.281170e-01

Energy  Fluence     90% Error
[keV]   [erg/cm2]   [erg/cm2]
15- 25  2.859e-08   1.442e-08
25- 50  4.394e-08   1.702e-08
50-150  4.586e-08   2.147e-08
15-150  1.184e-07   4.614e-08
Pre-slew spectrum (Pre-slew PHA with pre-slew DRM)
Power-law model
Spectral model in power-law:
------------------------------------------------------------
Parameters  : value       lower 90%   higher 90%
Photon index: 2.28708     ( -0.227018   0.245869 )
Norm@50keV  : 3.46729E-03    ( -0.000575135   0.000562833 )
------------------------------------------------------------
#Fit statistic : Chi-Squared =          63.12 using 59 PHA bins.
# Reduced chi-squared =          1.107 for     57 degrees of freedom
# Null hypothesis probability =   2.691269e-01

Photon flux (15-150 keV)    in 25.42 sec: 0.601615 ( -0.0622283  0.06223 ) ph/cm2/s
Energy fluence (15-150 keV)             : 8.40291e-07 ( -1.10635e-07  1.1481e-07 ) ergs/cm2
Cutoff power-law model
Spectral model in the cutoff power-law:
------------------------------------------------------------
Parameters  : value       lower 90%   higher 90%
Photon index: 1.98946     ( -1.98946   -1.98946 )
Epeak [keV] : 1.38214      ( -0.686925 31.2233 )
Norm@50keV  : 5.22359E-03    (     )
------------------------------------------------------------
#Fit statistic : Chi-Squared =          63.67 using 59 PHA bins.
# Reduced chi-squared =          1.137 for     56 degrees of freedom
# Null hypothesis probability =   2.247308e-01

Photon flux (15-150 keV)    in 25.42 sec: 0.601550 ( -0.062432  0.062072 ) ph/cm2/s
Energy fluence (15-150 keV)             : 8.38863e-07 ( -1.36981e-07  1.16185e-07 ) ergs/cm2
Band function

Spectral model in the Band function:
------------------------------------------------------------
Parameters  : value       lower 90%   higher 90%
alpha       : 0.330469   ( 1.5371   1.5371 )
beta        : -2.33075    ( 2.31319   0.248129 )
Epeak [keV] : 18.4151      ( -14.0086 17.5314 )
Norm@50keV   : 0.493412    ( -0.487913   2363.44 )
------------------------------------------------------------
#Fit statistic : Chi-Squared =          62.92 using 59 PHA bins.
# Reduced chi-squared =          1.144 for     55 degrees of freedom
# Null hypothesis probability =   2.163329e-01

Photon flux (15-150 keV)    in 25.42 sec:  (    ) ph/cm2/s
Energy fluence (15-150 keV)             : 0 ( 0  0 ) ergs/cm2
S(25-50 keV) vs. S(50-100 keV) plot

S(25-50 keV)  = 8.15e-07
S(50-100 keV) = 6.50e-07
T90 vs. Hardness ratio plot
T90                                   = 104.291999995708 sec.
Hardness ratio (energy fluence ratio) = 0.797546
Color vs. Color plot
Count Ratio  (25-50 keV) / (15-25 keV) = 0.875881
Count Ratio (50-100 keV) / (15-25 keV) = 0.33055
Mask shadow pattern

IMX = -8.703118914732342E-01, IMY = -2.236117712951145E-01
TIME vs. PHA plot around the trigger time

Blue+Cyan dotted lines: Time interval of the scaled map
From 0.000000 to 2.048000
TIME vs. DetID plot around the trigger time

Blue+Cyan dotted lines: Time interval of the scaled map
From 0.000000 to 2.048000
100 us light curve (15-350 keV)

Blue+Cyan dotted lines: Time interval of the scaled map
From 0.000000 to 2.048000
Spacecraft aspect plot
Bright source in the pre-burst/pre-slew/post-slew images
Pre-burst image of 15-350 keV band
Time interval of the image:
-119.832000 -1.556000

# RAcent  DECcent POSerr Theta    Phi  PeakCts   SNR AngSep     Name
#  [deg]    [deg]    ['] [deg]  [deg]                   [']
170.4196 -60.6390   41.5  26.9  -62.2   0.0417   0.3    3.2	Cen X-3
186.6420 -62.7592    2.4  26.1  -44.4   0.6542   4.9    0.8	GX 301-2
264.8266 -44.3441    5.1  50.0   26.3   1.1115   2.2    7.3	4U 1735-44
221.4505 -47.5146    2.5  44.1  -14.3   0.9071   4.6 ------	UNKNOWN
109.4202 -36.0678    2.2  49.0 -131.6   2.9685   5.2 ------	UNKNOWN
Pre-slew background subtracted image of 15-350 keV band
Time interval of the image:
-1.556000 23.868600

# RAcent  DECcent POSerr Theta    Phi  PeakCts   SNR AngSep     Name
#  [deg]    [deg]    ['] [deg]  [deg]                   [']
170.0599 -60.6543    9.0  26.8  -62.6  -0.1075  -1.3    7.8	Cen X-3
186.4178 -62.8624   42.3  26.0  -44.6  -0.0203  -0.3    8.6	GX 301-2
264.8140 -44.5556    5.7  49.8   26.3  -0.5273  -2.0    7.0	4U 1735-44
 51.1031 -46.0289    0.8  41.9  165.6   1.8200  14.9 ------	UNKNOWN
 81.6478 -31.3987    2.1  54.5 -160.8   1.1332   5.4 ------	UNKNOWN
Post-slew image of 15-350 keV band
Time interval of the image:
82.268630 302.207900

# RAcent  DECcent POSerr Theta    Phi  PeakCts   SNR AngSep     Name
#  [deg]    [deg]    ['] [deg]  [deg]                   [']
  5.6838 -28.1281    3.2  39.7  101.7   2.5304   3.6 ------	UNKNOWN
 20.9551 -37.3383    2.4  24.0  101.5   1.1641   4.9 ------	UNKNOWN
 46.0822 -16.8427    2.6  29.5  171.2   0.9151   4.5 ------	UNKNOWN
Plot creation:
Sun May 31 15:54:34 EDT 2015