Click here for the BAT GCN circular template
Image
Pre-slew 15.0-350.0 keV image (Event data)
#   RAcent    DECcent   POSerr    Theta     Phi              Peak Cts       SNR   Name
   87.7548    -2.6458   0.0173    17.6442    52.2266         0.7552190     11.101 TRIG_00152113

Foreground time interval of the image:
 -0.208  39.584 (delta_t =  39.792 [sec])
Background time interval of the image:
-231.883  -0.208 (delta_t = 231.675 [sec])
Lightcurves
Notes:
- 1) The mask-weighted light curves are using the flight position.
- 2) Multiple plots of different time binning/intervals are shown to cover all scenarios of short/long GRBs, rate/image triggers, and real/false positives.
- 3) For all the mask-weighted lightcurves, the y-axis units are counts/sec/det where a det is 0.4 x 0.4 = 0.16 sq cm.
- 4) The verticle lines correspond to following: green dotted lines are T50 interval, black dotted lines are T90 interval, blue solid line(s) is a spacecraft slew start time, and orange solid line(s) is a spacecraft slew end time.
- 5) Time of each bin is in the middle of the bin.
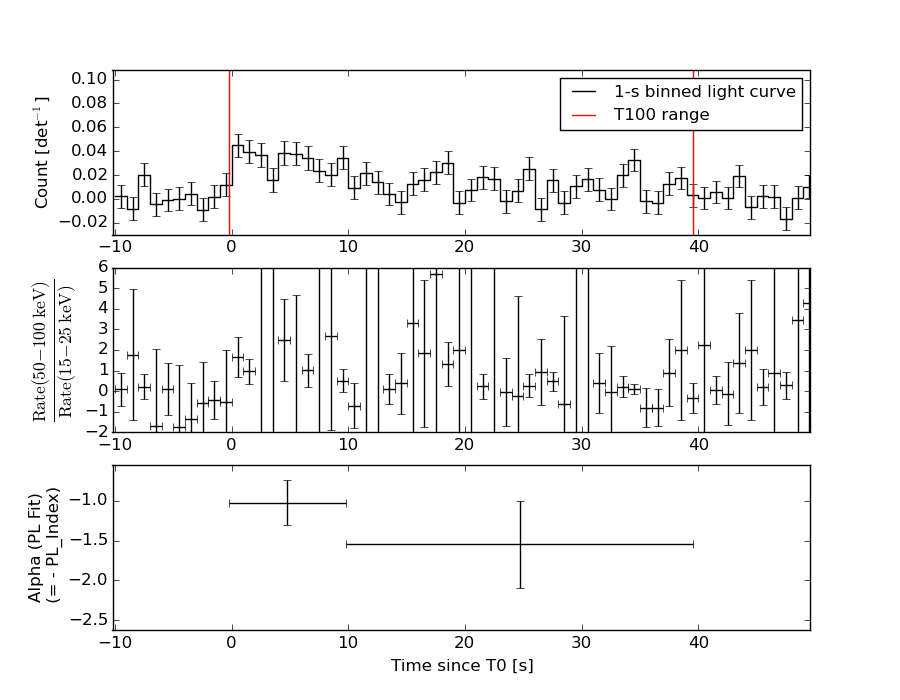
1 s binning
From T0-310 s to T0+310 s
From T100_start - 20 s to T100_end + 30 s
Full time interval
64 ms binning
Full time interval
From T100_start to T100_end
From T0-5 sec to T0+5 sec
16 ms binning
From T100_start-5 s to T100_start+5 s
8 ms binning
From T100_start-3 s to T100_start+3 s
2 ms binning
From T100_start-1 s to T100_start+1 s
SN=5 or 10 sec. binning (whichever binning is satisfied first)
SN=5 or 10 sec. binning (T < 200 sec)
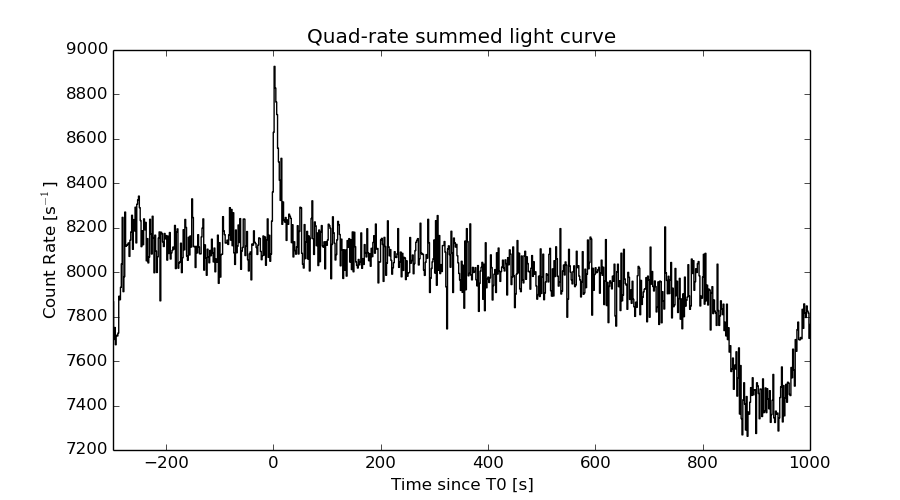
Quad-rate summed light curves (from T0-300s to T0+1000s)
Spectral Evolution
Spectra
Notes:
- 1) The fitting includes the systematic errors.
- 2) When the burst includes telescope slew time periods, the fitting uses an average response file made from multiple 5-s response files through out the slew time plus single time preiod for the non-slew times, and weighted by the total counts in the corresponding time period using addrmf. An average response file is needed becuase a spectral fit using the pre-slew DRM will introduce some errors in both a spectral shape and a normalization if the PHA file contains a lot of the slew/post-slew time interval.
- 3) For fits to more complicated models (e.g. a power-law over a cutoff power-law), the BAT team has decided to require a chi-square improvement of more than 6 for each extra dof.
Time averaged spectrum fit using the average DRM
Power-law model

Time interval is from   -0.208 sec. to   39.584 sec.

Spectral model in power-law:
------------------------------------------------------------
Parameters  : value       lower 90%   higher 90%
Photon index: 1.23405     ( -0.299205   0.292271 )
Norm@50keV  : 1.04899E-03    ( -0.000159148   0.000159139 )
------------------------------------------------------------
#Fit statistic : Chi-Squared =          65.80 using 59 PHA bins.
# Reduced chi-squared =          1.154 for     57 degrees of freedom
# Null hypothesis probability =   1.985151e-01

Photon flux (15-150 keV)    in 39.79 sec: 0.123752 ( -0.0194904  0.0195489 ) ph/cm2/s
Energy fluence (15-150 keV)             : 4.19498e-07 ( -7.1583e-08  7.24417e-08 ) ergs/cm2
Cutoff power-law model
Time interval is from   -0.208 sec. to   39.584 sec.
Spectral model in the cutoff power-law:
------------------------------------------------------------
Parameters  : value       lower 90%   higher 90%
Photon index: 1.23403     ( -0.501235   0.290364 )
Epeak [keV] : 9999.36      ( -9999.36 -9999.36 )
Norm@50keV  : 1.05357E-03    ( -0.000159769   0.00100672 )
------------------------------------------------------------
#Fit statistic : Chi-Squared =          65.81 using 59 PHA bins.
# Reduced chi-squared =          1.175 for     56 degrees of freedom
# Null hypothesis probability =   1.735256e-01

Photon flux (15-150 keV)    in 39.79 sec: 0.124109 ( -0.0198  0.019193 ) ph/cm2/s
Energy fluence (15-150 keV)             : 4.19613e-07 ( -7.16586e-08  7.00185e-08 ) ergs/cm2
Band function

Time interval is from   -0.208 sec. to   39.584 sec.

Spectral model in the Band function:
------------------------------------------------------------
Parameters  : value       lower 90%   higher 90%
alpha       : -1.02362   ( 1.02362   1.02362 )
beta        : -1.23402    ( -0.292353   0.299432 )
Epeak [keV] : 36.2765      ( -36.2765 -36.2765 )
Norm@50keV   : 1.91298E-03    ( -0.00102304   0.162288 )
------------------------------------------------------------
#Fit statistic : Chi-Squared =          65.80 using 59 PHA bins.
# Reduced chi-squared =          1.196 for     55 degrees of freedom
# Null hypothesis probability =   1.510925e-01

Photon flux (15-150 keV)    in 39.79 sec:  (    ) ph/cm2/s
Energy fluence (15-150 keV)             : 0 ( 0  0 ) ergs/cm2
Single BB
Spectral model blackbody:
------------------------------------------------------------
Parameters  : value    Lower 90%  Upper 90%
kT [keV]    : 18.8578  (-4.00585  5.77679)
R^2/D10^2   : 6.57364E-03  (-0.0037908   0.00804857)
(R is the radius in km and D10 is the distance to the source in units of 10 kpc)
------------------------------------------------------------
#Fit statistic : Chi-Squared =          79.81 using 59 PHA bins.
# Reduced chi-squared =          1.400 for     57 degrees of freedom
# Null hypothesis probability =   2.474657e-02

Energy  Fluence     90% Error
[keV]   [erg/cm2]   [erg/cm2]
15- 25  1.833e-08   6.038e-09
25- 50  8.771e-08   2.759e-08
50-150  2.289e-07   7.395e-08
15-150  3.349e-07   8.815e-08
Thermal bremsstrahlung (OTTB)
Spectral model: thermal bremsstrahlung
------------------------------------------------------------
Parameters  : value         Lower 90%    Upper 90%
kT [keV]    : 200.000       (      )
Norm        : 0.511623       (-0.0791622     0.0791535)
------------------------------------------------------------
#Fit statistic : Chi-Squared =          70.25 using 59 PHA bins.
# Reduced chi-squared =          1.232 for     57 degrees of freedom
# Null hypothesis probability =   1.117728e-01

Energy  Fluence     90% Error
[keV]   [erg/cm2]   [erg/cm2]
15- 25  5.072e-08   2.895e-08
25- 50  9.756e-08   5.553e-08
50-150  2.140e-07   1.227e-07
15-150  3.622e-07   2.015e-07
Double BB
R1^2/D10^2  : 4.22234E-02        (-325.643      631597)
kT2 [keV]   : 69.0446        (      )
R2^2/D10^2  : 1.34721E-04    (   )
------------------------------------------------------------
#Fit statistic : Chi-Squared =          67.53 using 59 PHA bins.
#Fit statistic : Chi-Squared =          67.25 using 59 PHA bins.
#Fit statistic : Chi-Squared =          67.23 using 59 PHA bins.
# Reduced chi-squared =          1.228 for     55 degrees of freedom
# Reduced chi-squared =          1.223 for     55 degrees of freedom
# Reduced chi-squared =          1.222 for     55 degrees of freedom
# Null hypothesis probability =   1.196320e-01
# Null hypothesis probability =   1.243096e-01
# Null hypothesis probability =   1.246423e-01

Energy  Fluence     90% Error
[keV]   [erg/cm2]   [erg/cm2]
15- 25  3.793e-08   1.657e-08
25- 50  7.387e-08   2.579e-08
50-150  2.594e-07   9.116e-08
15-150  3.712e-07   1.023e-07
Peak spectrum fit
Power-law model
Time interval is from   -0.204 sec. to    0.796 sec.

Spectral model in power-law:
------------------------------------------------------------
Parameters  : value       lower 90%   higher 90%
Photon index: 1.25186     ( -0.700977   0.666531 )
Norm@50keV  : 3.16719E-03    ( -0.00101178   0.00100884 )
------------------------------------------------------------
#Fit statistic : Chi-Squared =          36.89 using 59 PHA bins.
# Reduced chi-squared =         0.6473 for     57 degrees of freedom
# Null hypothesis probability =   9.821702e-01

Photon flux (15-150 keV)    in 1 sec: 0.374704 ( -0.123333  0.12367 ) ph/cm2/s
Energy fluence (15-150 keV)             : 3.16819e-08 ( -1.1489e-08  1.17675e-08 ) ergs/cm2
Cutoff power-law model
Time interval is from   -0.204 sec. to    0.796 sec.
Spectral model in the cutoff power-law:
------------------------------------------------------------
Parameters  : value       lower 90%   higher 90%
Photon index: 1.27230     ( -0.730029   0.64865 )
Epeak [keV] : 9999.36      ( -9999.36 -9999.36 )
Norm@50keV  : 3.15317E-03    ( -0.00101165   0.0103623 )
------------------------------------------------------------
#Fit statistic : Chi-Squared =          36.91 using 59 PHA bins.
# Reduced chi-squared =         0.6590 for     56 degrees of freedom
# Null hypothesis probability =   9.771493e-01

Photon flux (15-150 keV)    in 1 sec: 0.375782 ( -0.124053  0.122507 ) ph/cm2/s
Energy fluence (15-150 keV)             : 3.16351e-08 ( -1.1444e-08  1.15428e-08 ) ergs/cm2
Band function

Time interval is from   -0.204 sec. to    0.796 sec.

Spectral model in the Band function:
------------------------------------------------------------
Parameters  : value       lower 90%   higher 90%
alpha       : -0.972587   ( 0.968555   0.968555 )
beta        : -1.25309    ( 1.2561   0.705272 )
Epeak [keV] : 60.8356      ( -66.0618 -66.0618 )
Norm@50keV   : 5.71339E-03    ( -0.00353343   0 )
------------------------------------------------------------
#Fit statistic : Chi-Squared =          36.89 using 59 PHA bins.
# Reduced chi-squared =         0.6708 for     55 degrees of freedom
# Null hypothesis probability =   9.711392e-01

Photon flux (15-150 keV)    in 1 sec:  (    ) ph/cm2/s
Energy fluence (15-150 keV)             : 0 ( 0  0 ) ergs/cm2
Single BB
Spectral model blackbody:
------------------------------------------------------------
Parameters  : value    Lower 90%  Upper 90%
kT [keV]    : 24.7239  (-10.8058  24.9474)
R^2/D10^2   : 8.32545E-03  (-0.00828132   0.0434269)
(R is the radius in km and D10 is the distance to the source in units of 10 kpc)
------------------------------------------------------------
#Fit statistic : Chi-Squared =          41.22 using 59 PHA bins.
# Reduced chi-squared =         0.7232 for     57 degrees of freedom
# Null hypothesis probability =   9.426815e-01

Energy  Fluence     90% Error
[keV]   [erg/cm2]   [erg/cm2]
15- 25  8.893e-10   5.720e-10
25- 50  5.016e-09   3.129e-09
50-150  2.277e-08   1.439e-08
15-150  2.868e-08   1.808e-08
Thermal bremsstrahlung (OTTB)
Spectral model: thermal bremsstrahlung
------------------------------------------------------------
Parameters  : value         Lower 90%    Upper 90%
kT [keV]    : 199.363       (-124.223      -199.363)
Norm        : 1.53924       (-0.500383     0.500383)
------------------------------------------------------------
#Fit statistic : Chi-Squared =          38.02 using 59 PHA bins.
# Reduced chi-squared =         0.6670 for     57 degrees of freedom
# Null hypothesis probability =   9.750667e-01

Energy  Fluence     90% Error
[keV]   [erg/cm2]   [erg/cm2]
15- 25  3.833e-09   2.426e-09
25- 50  7.373e-09   4.649e-09
50-150  1.617e-08   1.019e-08
15-150  2.738e-08   1.691e-08
Double BB
Spectral model: bbodyrad<1> + bbodyrad<2>
------------------------------------------------------------
Parameters  : value         Lower 90%    Upper 90%
kT1 [keV]   : 4.65794        (-2.31952      3.75076)
R1^2/D10^2  : 2.18839        (-2.07105      73.4049)
kT2 [keV]   : 36.2019        (-16.3747      -36.2054)
R2^2/D10^2  : 2.47642E-03    (-0.00238204   0.00547349)
------------------------------------------------------------
#Fit statistic : Chi-Squared =          34.96 using 59 PHA bins.
# Reduced chi-squared =         0.6356 for     55 degrees of freedom
# Null hypothesis probability =   9.839716e-01

Energy  Fluence     90% Error
[keV]   [erg/cm2]   [erg/cm2]
15- 25  4.423e-09   2.719e-09
25- 50  5.140e-09   2.722e-09
50-150  2.501e-08   1.574e-08
15-150  3.457e-08   1.835e-08
Pre-slew spectrum (Pre-slew PHA with pre-slew DRM)
Power-law model

Spectral model in power-law:
------------------------------------------------------------
Parameters  : value       lower 90%   higher 90%
Photon index: 1.23405     ( -0.299205   0.292271 )
Norm@50keV  : 1.04899E-03    ( -0.000159148   0.000159139 )
------------------------------------------------------------
#Fit statistic : Chi-Squared =          65.80 using 59 PHA bins.
# Reduced chi-squared =          1.154 for     57 degrees of freedom
# Null hypothesis probability =   1.985151e-01

Photon flux (15-150 keV)    in 39.79 sec: 0.123752 ( -0.0194904  0.0195489 ) ph/cm2/s
Energy fluence (15-150 keV)             : 4.19498e-07 ( -7.1583e-08  7.24417e-08 ) ergs/cm2
Cutoff power-law model

Spectral model in the cutoff power-law:
------------------------------------------------------------
Parameters  : value       lower 90%   higher 90%
Photon index: 1.23403     ( -0.501235   0.290364 )
Epeak [keV] : 9999.36      ( -9999.36 -9999.36 )
Norm@50keV  : 1.05357E-03    ( -0.000159769   0.00100672 )
------------------------------------------------------------
#Fit statistic : Chi-Squared =          65.81 using 59 PHA bins.
# Reduced chi-squared =          1.175 for     56 degrees of freedom
# Null hypothesis probability =   1.735256e-01

Photon flux (15-150 keV)    in 39.79 sec: 0.124109 ( -0.0198  0.019193 ) ph/cm2/s
Energy fluence (15-150 keV)             : 4.19613e-07 ( -7.16586e-08  7.00185e-08 ) ergs/cm2
Band function
Spectral model in the Band function:
------------------------------------------------------------
Parameters  : value       lower 90%   higher 90%
alpha       : -1.02362   ( 1.02362   1.02362 )
beta        : -1.23402    ( -0.292353   0.299432 )
Epeak [keV] : 36.2765      ( -36.2765 -36.2765 )
Norm@50keV   : 1.91298E-03    ( -0.00102304   0.162288 )
------------------------------------------------------------
#Fit statistic : Chi-Squared =          65.80 using 59 PHA bins.
# Reduced chi-squared =          1.196 for     55 degrees of freedom
# Null hypothesis probability =   1.510925e-01

Photon flux (15-150 keV)    in 39.79 sec:  (    ) ph/cm2/s
Energy fluence (15-150 keV)             : 0 ( 0  0 ) ergs/cm2
S(25-50 keV) vs. S(50-100 keV) plot
S(25-50 keV)  = 8.99e-08
S(50-100 keV) = 1.53e-07
T90 vs. Hardness ratio plot
T90                                   = 29.5999999642372 sec.
Hardness ratio (energy fluence ratio) = 1.70189
Color vs. Color plot
Count Ratio  (25-50 keV) / (15-25 keV) = 1.53084
Count Ratio (50-100 keV) / (15-25 keV) = 1.37524
Mask shadow pattern
IMX = 1.948287804055376E-01, IMY = -2.514127592022140E-01
TIME vs. PHA plot around the trigger time
TIME vs. DetID plot around the trigger time
100 us light curve (15-350 keV)
Spacecraft aspect plot
Bright source in the pre-burst/pre-slew/post-slew images
Pre-burst image of 15-350 keV band
Time interval of the image:
-231.883400 -0.208000

# RAcent  DECcent POSerr Theta    Phi  PeakCts   SNR AngSep     Name
#  [deg]    [deg]    ['] [deg]  [deg]                   [']
 83.6247  22.0089    0.2  20.1  136.0  10.3263  57.6    0.6	Crab
 69.7178  25.1870    2.9  32.8  128.6   1.0318   4.0 ------	UNKNOWN
 70.6857  30.2160    2.8  34.2  137.4   1.1834   4.1 ------	UNKNOWN
141.0136 -14.2045    4.3  47.0  -53.2   2.5589   2.7 ------	UNKNOWN
141.2757  -2.6946    3.1  42.7  -68.3   3.5956   3.7 ------	UNKNOWN
141.9880  23.4587    2.7  42.0 -107.5   3.9994   4.2 ------	UNKNOWN
Pre-slew background subtracted image of 15-350 keV band
Time interval of the image:
-0.208000 39.584000

# RAcent  DECcent POSerr Theta    Phi  PeakCts   SNR AngSep     Name
#  [deg]    [deg]    ['] [deg]  [deg]                   [']
 83.5361  21.8439    9.6  20.0  135.5  -0.0773  -1.2   11.6	Crab
 87.7549  -2.6458    1.0  17.6   52.2   0.7553  11.1 ------	UNKNOWN
Post-slew image of 15-350 keV band
Time interval of the image:
90.316600 302.096000

# RAcent  DECcent POSerr Theta    Phi  PeakCts   SNR AngSep     Name
#  [deg]    [deg]    ['] [deg]  [deg]                   [']
 83.6319  22.0149    0.2  25.0 -176.8   9.0308  59.9    0.1	Crab
135.5474 -40.7317    8.3  57.4  -29.5   1.9727   1.4   10.7	Vela X-1
 87.6867 -42.2953    2.7  39.6   12.3   1.0112   4.3 ------	UNKNOWN
 92.4483 -35.6566    2.5  33.3    5.3   0.8784   4.6 ------	UNKNOWN
 94.0450 -17.0506    2.9  15.6  -10.6   0.6208   3.9 ------	UNKNOWN
 92.6220  44.7390    2.3  47.6 -163.0   1.6110   5.0 ------	UNKNOWN
132.0465 -16.9124    2.4  45.8  -56.6   3.7385   4.8 ------	UNKNOWN
128.8832  -0.6127    2.3  41.2  -79.9   3.3387   4.9 ------	UNKNOWN
Plot creation:
Sun May 31 15:50:57 EDT 2015