Click here for the BAT GCN circular template
Image
Pre-slew 15.0-350.0 keV image (Event data)

#   RAcent    DECcent   POSerr    Theta     Phi              Peak Cts       SNR   Name
   13.7144   -38.8610   0.0216    28.2734    74.5155         0.5021197      8.906 TRIG_00154630

Foreground time interval of the image:
 -0.996  15.968 (delta_t =  16.964 [sec])
Background time interval of the image:
-299.568  -0.996 (delta_t = 298.572 [sec])
Lightcurves
Notes:
- 1) The mask-weighted light curves are using the flight position.
- 2) Multiple plots of different time binning/intervals are shown to cover all scenarios of short/long GRBs, rate/image triggers, and real/false positives.
- 3) For all the mask-weighted lightcurves, the y-axis units are counts/sec/det where a det is 0.4 x 0.4 = 0.16 sq cm.
- 4) The verticle lines correspond to following: green dotted lines are T50 interval, black dotted lines are T90 interval, blue solid line(s) is a spacecraft slew start time, and orange solid line(s) is a spacecraft slew end time.
- 5) Time of each bin is in the middle of the bin.
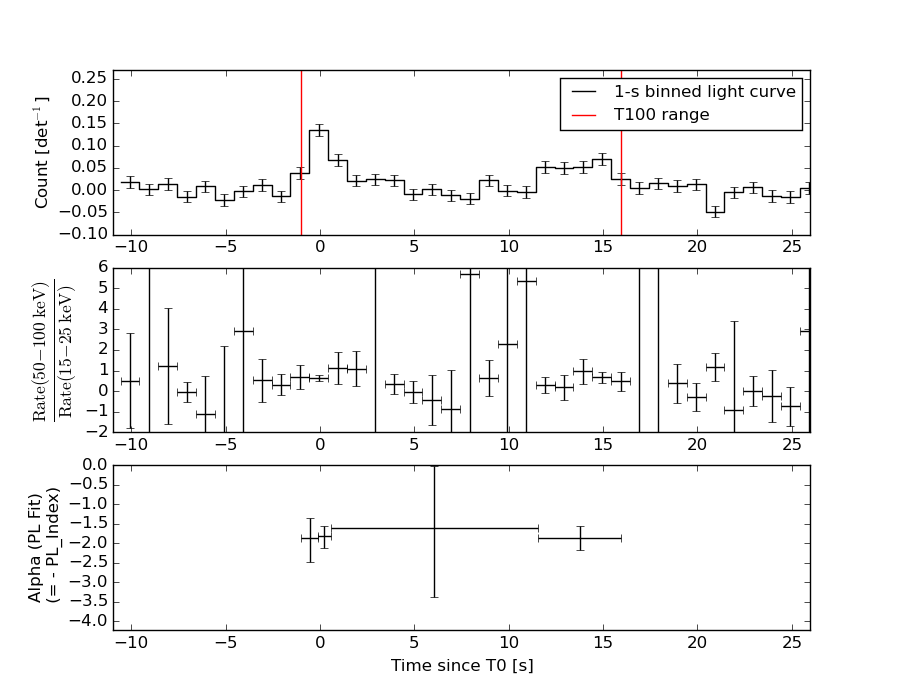
1 s binning
From T0-310 s to T0+310 s
From T100_start - 20 s to T100_end + 30 s
Full time interval
64 ms binning
Full time interval
From T100_start to T100_end

From T0-5 sec to T0+5 sec
16 ms binning
From T100_start-5 s to T100_start+5 s
Blue+Cyan dotted lines: Time interval of the scaled map
From 0.000000 to 0.512000
8 ms binning
From T100_start-3 s to T100_start+3 s
Blue+Cyan dotted lines: Time interval of the scaled map
From 0.000000 to 0.512000
2 ms binning
From T100_start-1 s to T100_start+1 s

Blue+Cyan dotted lines: Time interval of the scaled map
From 0.000000 to 0.512000
SN=5 or 10 sec. binning (whichever binning is satisfied first)
SN=5 or 10 sec. binning (T < 200 sec)

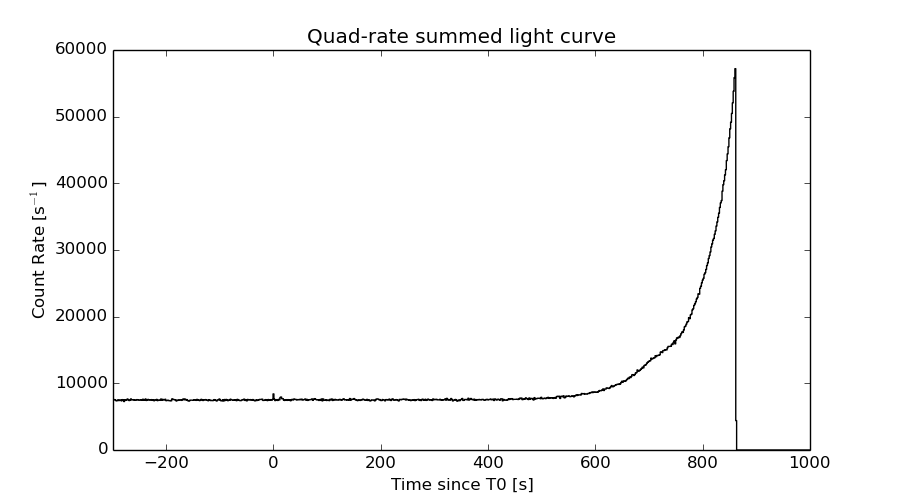
Quad-rate summed light curves (from T0-300s to T0+1000s)
Spectral Evolution
Spectra
Notes:
- 1) The fitting includes the systematic errors.
- 2) When the burst includes telescope slew time periods, the fitting uses an average response file made from multiple 5-s response files through out the slew time plus single time preiod for the non-slew times, and weighted by the total counts in the corresponding time period using addrmf. An average response file is needed becuase a spectral fit using the pre-slew DRM will introduce some errors in both a spectral shape and a normalization if the PHA file contains a lot of the slew/post-slew time interval.
- 3) For fits to more complicated models (e.g. a power-law over a cutoff power-law), the BAT team has decided to require a chi-square improvement of more than 6 for each extra dof.
Time averaged spectrum fit using the average DRM
Power-law model
Time interval is from   -0.996 sec. to   15.968 sec.

Spectral model in power-law:
------------------------------------------------------------
Parameters  : value       lower 90%   higher 90%
Photon index: 1.81614     ( -0.268992   0.284863 )
Norm@50keV  : 2.05135E-03    ( -0.000372144   0.000359976 )
------------------------------------------------------------
#Fit statistic : Chi-Squared =          47.77 using 59 PHA bins.
# Reduced chi-squared =         0.8381 for     57 degrees of freedom
# Null hypothesis probability =   8.031180e-01

Photon flux (15-150 keV)    in 16.96 sec: 0.284460 ( -0.041949  0.041955 ) ph/cm2/s
Energy fluence (15-150 keV)             : 3.20122e-07 ( -5.7498e-08  5.92007e-08 ) ergs/cm2
Cutoff power-law model

Time interval is from   -0.996 sec. to   15.968 sec.
Spectral model in the cutoff power-law:
------------------------------------------------------------
Parameters  : value       lower 90%   higher 90%
Photon index: 1.78607     ( -1.13668   0.970581 )
Epeak [keV] : 291.346      (   )
Norm@50keV  : 2.13547E-03    (     )
------------------------------------------------------------
#Fit statistic : Chi-Squared =          47.77 using 59 PHA bins.
# Reduced chi-squared =         0.8530 for     56 degrees of freedom
# Null hypothesis probability =   7.751015e-01

Photon flux (15-150 keV)    in 16.96 sec: 0.283969 ( -0.042802  0.042296 ) ph/cm2/s
Energy fluence (15-150 keV)             : 3.18324e-07 ( -6.76433e-08  6.04929e-08 ) ergs/cm2
Band function

Time interval is from   -0.996 sec. to   15.968 sec.

Spectral model in the Band function:
------------------------------------------------------------
Parameters  : value       lower 90%   higher 90%
alpha       : 4.95457   ( -4.95457   -4.95457 )
beta        : -1.93214    ( -0.368137   0.31341 )
Epeak [keV] : 22.2035      ( -22.2035 5.89358 )
Norm@50keV   : 576.781    ( -84.6056   2.12021e+06 )
------------------------------------------------------------
#Fit statistic : Chi-Squared =          46.76 using 59 PHA bins.
# Reduced chi-squared =         0.8501 for     55 degrees of freedom
# Null hypothesis probability =   7.777556e-01

Photon flux (15-150 keV)    in 16.96 sec:  (    ) ph/cm2/s
Energy fluence (15-150 keV)             : 0 ( 0  0 ) ergs/cm2
Single BB
Spectral model blackbody:
------------------------------------------------------------
Parameters  : value    Lower 90%  Upper 90%
kT [keV]    : 9.61403  (-1.67883  2.22947)
R^2/D10^2   : 0.152830  (-0.0830406   0.164682)
(R is the radius in km and D10 is the distance to the source in units of 10 kpc)
------------------------------------------------------------
#Fit statistic : Chi-Squared =          59.77 using 59 PHA bins.
# Reduced chi-squared =          1.049 for     57 degrees of freedom
# Null hypothesis probability =   3.752726e-01

Energy  Fluence     90% Error
[keV]   [erg/cm2]   [erg/cm2]
15- 25  4.808e-08   1.288e-08
25- 50  1.130e-07   2.460e-08
50-150  5.254e-08   2.212e-08
15-150  2.136e-07   4.614e-08
Thermal bremsstrahlung (OTTB)

Spectral model: thermal bremsstrahlung
------------------------------------------------------------
Parameters  : value         Lower 90%    Upper 90%
kT [keV]    : 93.4879       (-39.9376      -93.4935)
Norm        : 1.27642       (-0.247574     0.343527)
------------------------------------------------------------
#Fit statistic : Chi-Squared =          48.36 using 59 PHA bins.
# Reduced chi-squared =         0.8485 for     57 degrees of freedom
# Null hypothesis probability =   7.853341e-01

Energy  Fluence     90% Error
[keV]   [erg/cm2]   [erg/cm2]
15- 25  5.654e-08   1.212e-08
25- 50  9.641e-08   1.945e-08
50-150  1.502e-07   8.889e-08
15-150  3.032e-07   1.048e-07
Double BB
Spectral model: bbodyrad<1> + bbodyrad<2>
------------------------------------------------------------
Parameters  : value         Lower 90%    Upper 90%
kT1 [keV]   : 6.59137        (-1.84418      2.05493)
R1^2/D10^2  : 0.500996        (-0.267969      0.858683)
kT2 [keV]   : 29.3349        (-14.5884      158.417)
R2^2/D10^2  : 1.72281E-03    (-0.00123842   0.00814707)
------------------------------------------------------------
#Fit statistic : Chi-Squared =          45.86 using 59 PHA bins.
# Reduced chi-squared =         0.8339 for     55 degrees of freedom
# Null hypothesis probability =   8.051098e-01

Energy  Fluence     90% Error
[keV]   [erg/cm2]   [erg/cm2]
15- 25  5.946e-08   3.437e-08
25- 50  9.179e-08   4.974e-08
50-150  1.583e-07   1.042e-07
15-150  3.096e-07   1.732e-07
Peak spectrum fit
Power-law model
Time interval is from   -0.104 sec. to    0.896 sec.

Spectral model in power-law:
------------------------------------------------------------
Parameters  : value       lower 90%   higher 90%
Photon index: 1.82404     ( -0.280248   0.297508 )
Norm@50keV  : 9.55824E-03    ( -0.00175029   0.00168187 )
------------------------------------------------------------
#Fit statistic : Chi-Squared =          55.55 using 59 PHA bins.
# Reduced chi-squared =         0.9746 for     57 degrees of freedom
# Null hypothesis probability =   5.295331e-01

Photon flux (15-150 keV)    in 1 sec: 1.32958 ( -0.196534  0.196611 ) ph/cm2/s
Energy fluence (15-150 keV)             : 8.79291e-08 ( -1.58584e-08  1.63072e-08 ) ergs/cm2
Cutoff power-law model

Time interval is from   -0.104 sec. to    0.896 sec.
Spectral model in the cutoff power-law:
------------------------------------------------------------
Parameters  : value       lower 90%   higher 90%
Photon index: 2.15157     ( -1.08305   0.070025 )
Epeak [keV] : 61.5203      (   )
Norm@50keV  : 6.52059E-03    (     )
------------------------------------------------------------
#Fit statistic : Chi-Squared =          55.60 using 59 PHA bins.
# Reduced chi-squared =         0.9929 for     56 degrees of freedom
# Null hypothesis probability =   4.899516e-01

Photon flux (15-150 keV)    in 1 sec: 1.33007 ( -0.19643  0.19599 ) ph/cm2/s
Energy fluence (15-150 keV)             : 8.72651e-08 ( -1.55161e-08  1.66269e-08 ) ergs/cm2
Band function

Time interval is from   -0.104 sec. to    0.896 sec.

Spectral model in the Band function:
------------------------------------------------------------
Parameters  : value       lower 90%   higher 90%
alpha       : -1.33105   ( 1.32259   1.32259 )
beta        : -1.84679    ( 1.84779   0.299987 )
Epeak [keV] : 34.1940      ( -33.6744 -33.6744 )
Norm@50keV   : 2.22998E-02    ( -0.0234379   2.30159e+06 )
------------------------------------------------------------
#Fit statistic : Chi-Squared =          55.48 using 59 PHA bins.
# Reduced chi-squared =          1.009 for     55 degrees of freedom
# Null hypothesis probability =   4.566782e-01

Photon flux (15-150 keV)    in 1 sec:  (    ) ph/cm2/s
Energy fluence (15-150 keV)             : 0 ( 0  0 ) ergs/cm2
Single BB

Spectral model blackbody:
------------------------------------------------------------
Parameters  : value    Lower 90%  Upper 90%
kT [keV]    : 10.1497  (-2.31179  3.1809)
R^2/D10^2   : 0.563262  (-0.556757   0.93506)
(R is the radius in km and D10 is the distance to the source in units of 10 kpc)
------------------------------------------------------------
#Fit statistic : Chi-Squared =          74.31 using 59 PHA bins.
# Reduced chi-squared =          1.304 for     57 degrees of freedom
# Null hypothesis probability =   6.154080e-02

Energy  Fluence     90% Error
[keV]   [erg/cm2]   [erg/cm2]
15- 25  1.188e-08   3.288e-09
25- 50  3.015e-08   7.225e-09
50-150  1.642e-08   6.683e-09
15-150  5.845e-08   1.407e-08
Thermal bremsstrahlung (OTTB)

Spectral model: thermal bremsstrahlung
------------------------------------------------------------
Parameters  : value         Lower 90%    Upper 90%
kT [keV]    : 99.7783       (-44.3511      -99.7848)
Norm        : 5.82859       (-1.03646     1.60729)
------------------------------------------------------------
#Fit statistic : Chi-Squared =          57.26 using 59 PHA bins.
# Reduced chi-squared =          1.005 for     57 degrees of freedom
# Null hypothesis probability =   4.653613e-01

Energy  Fluence     90% Error
[keV]   [erg/cm2]   [erg/cm2]
15- 25  1.523e-08   3.115e-09
25- 50  2.633e-08   5.025e-09
50-150  4.262e-08   2.454e-08
15-150  8.418e-08   2.836e-08
Double BB

Spectral model: bbodyrad<1> + bbodyrad<2>
------------------------------------------------------------
Parameters  : value         Lower 90%    Upper 90%
kT1 [keV]   : 5.50394        (-1.4231      1.842)
R1^2/D10^2  : 4.59074        (-3.04979      10.6026)
kT2 [keV]   : 25.9221        (-8.83837      30.2408)
R2^2/D10^2  : 1.48998E-02    (-0.0133032   0.0504545)
------------------------------------------------------------
#Fit statistic : Chi-Squared =          54.04 using 59 PHA bins.
# Reduced chi-squared =         0.9826 for     55 degrees of freedom
# Null hypothesis probability =   5.112055e-01

Energy  Fluence     90% Error
[keV]   [erg/cm2]   [erg/cm2]
15- 25  1.785e-08   9.789e-09
25- 50  2.312e-08   1.269e-08
50-150  4.964e-08   2.937e-08
15-150  9.061e-08   4.796e-08
Pre-slew spectrum (Pre-slew PHA with pre-slew DRM)
Power-law model

Spectral model in power-law:
------------------------------------------------------------
Parameters  : value       lower 90%   higher 90%
Photon index: 1.81614     ( -0.268992   0.284863 )
Norm@50keV  : 2.05135E-03    ( -0.000372144   0.000359976 )
------------------------------------------------------------
#Fit statistic : Chi-Squared =          47.77 using 59 PHA bins.
# Reduced chi-squared =         0.8381 for     57 degrees of freedom
# Null hypothesis probability =   8.031180e-01

Photon flux (15-150 keV)    in 16.96 sec: 0.284460 ( -0.041949  0.041955 ) ph/cm2/s
Energy fluence (15-150 keV)             : 3.20122e-07 ( -5.7498e-08  5.92007e-08 ) ergs/cm2
Cutoff power-law model

Spectral model in the cutoff power-law:
------------------------------------------------------------
Parameters  : value       lower 90%   higher 90%
Photon index: 1.78607     ( -1.13668   0.970581 )
Epeak [keV] : 291.346      (   )
Norm@50keV  : 2.13547E-03    (     )
------------------------------------------------------------
#Fit statistic : Chi-Squared =          47.77 using 59 PHA bins.
# Reduced chi-squared =         0.8530 for     56 degrees of freedom
# Null hypothesis probability =   7.751015e-01

Photon flux (15-150 keV)    in 16.96 sec: 0.283969 ( -0.042802  0.042296 ) ph/cm2/s
Energy fluence (15-150 keV)             : 3.18324e-07 ( -6.76433e-08  6.04929e-08 ) ergs/cm2
Band function

Spectral model in the Band function:
------------------------------------------------------------
Parameters  : value       lower 90%   higher 90%
alpha       : 4.95457   ( -4.95457   -4.95457 )
beta        : -1.93214    ( -0.368137   0.31341 )
Epeak [keV] : 22.2035      ( -22.2035 5.89358 )
Norm@50keV   : 576.781    ( -84.6056   2.12021e+06 )
------------------------------------------------------------
#Fit statistic : Chi-Squared =          46.76 using 59 PHA bins.
# Reduced chi-squared =         0.8501 for     55 degrees of freedom
# Null hypothesis probability =   7.777556e-01

Photon flux (15-150 keV)    in 16.96 sec:  (    ) ph/cm2/s
Energy fluence (15-150 keV)             : 0 ( 0  0 ) ergs/cm2
S(25-50 keV) vs. S(50-100 keV) plot

S(25-50 keV)  = 9.07e-08
S(50-100 keV) = 1.03e-07
T90 vs. Hardness ratio plot
T90                                   = 16.2399999797344 sec.
Hardness ratio (energy fluence ratio) = 1.13561
Color vs. Color plot
Count Ratio  (25-50 keV) / (15-25 keV) = 1.12682
Count Ratio (50-100 keV) / (15-25 keV) = 0.65158
Mask shadow pattern

IMX = 1.435927784720583E-01, IMY = -5.183233407212076E-01
TIME vs. PHA plot around the trigger time

Blue+Cyan dotted lines: Time interval of the scaled map
From 0.000000 to 0.512000
TIME vs. DetID plot around the trigger time

Blue+Cyan dotted lines: Time interval of the scaled map
From 0.000000 to 0.512000
100 us light curve (15-350 keV)
Blue+Cyan dotted lines: Time interval of the scaled map
From 0.000000 to 0.512000
Spacecraft aspect plot

Bright source in the pre-burst/pre-slew/post-slew images
Pre-burst image of 15-350 keV band
Time interval of the image:
-299.568000 -0.996000

# RAcent  DECcent POSerr Theta    Phi  PeakCts   SNR AngSep     Name
#  [deg]    [deg]    ['] [deg]  [deg]                   [']
 21.4235 -19.9665    2.6  35.7  110.3   1.7990   4.5 ------	UNKNOWN
 63.7768  -4.1497    2.7  43.3 -178.2   1.2638   4.3 ------	UNKNOWN
205.1200 -82.5609    2.4  50.7  -20.9   1.8943   4.9 ------	UNKNOWN
109.7701 -51.5030    3.8  37.9  -76.5   1.4753   3.1 ------	UNKNOWN
Pre-slew background subtracted image of 15-350 keV band
Time interval of the image:
-0.996000 15.968000

# RAcent  DECcent POSerr Theta    Phi  PeakCts   SNR AngSep     Name
#  [deg]    [deg]    ['] [deg]  [deg]                   [']
 13.7144 -38.8610    1.3  28.3   74.5   0.5021   8.9 ------	UNKNOWN
 64.3792 -17.9195    3.1  30.2 -171.1   0.1542   3.8 ------	UNKNOWN
 81.2058  -2.8818    2.2  50.5 -156.3   0.4581   5.1 ------	UNKNOWN
Post-slew image of 15-350 keV band
Time interval of the image:
Plot creation:
Sun May 31 15:41:22 EDT 2015